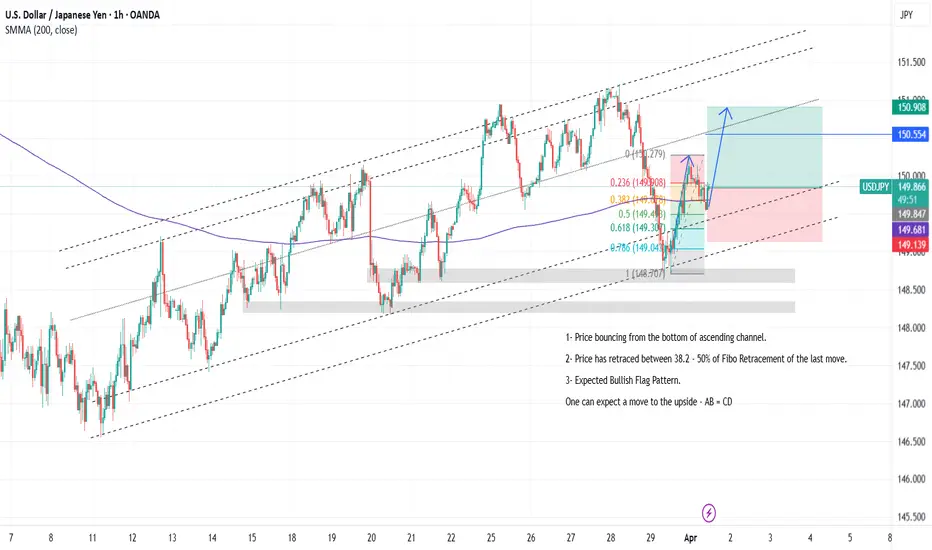
01-04-2025 _ Short Term Bullish Idea _ USDJPY H11- Price bouncing from the bottom of ascending channel.
2- Price has retraced between 38.2 - 50% of Fibo Retracement of the last move.
3- Expected Bullish Flag Pattern.
One can expect a move to the upside - AB = CD
USDJPY_LMAX trade ideas
Bearish drop?USD/JPY is reacting off the resistance level which is a pullback resistance that aligns with the 38.2% Fibonacci retracement and could drop from this level to our take profit.
Entry: 149.50
Why we like it:
There is a pullback resistance level that lies up with the 38.2% Fibonacci retracement.
Stop loss: 149.95
Why we like it:
There is a pullback resistance level that lines up with the 71% Fibonacci retracement.
Take profit: 148.66
Why we like it:
There is a pullback support level.
Enjoying your TradingView experience? Review us!
Please be advised that the information presented on TradingView is provided to Vantage (‘Vantage Global Limited’, ‘we’) by a third-party provider (‘Everest Fortune Group’). Please be reminded that you are solely responsible for the trading decisions on your account. There is a very high degree of risk involved in trading. Any information and/or content is intended entirely for research, educational and informational purposes only and does not constitute investment or consultation advice or investment strategy. The information is not tailored to the investment needs of any specific person and therefore does not involve a consideration of any of the investment objectives, financial situation or needs of any viewer that may receive it. Kindly also note that past performance is not a reliable indicator of future results. Actual results may differ materially from those anticipated in forward-looking or past performance statements. We assume no liability as to the accuracy or completeness of any of the information and/or content provided herein and the Company cannot be held responsible for any omission, mistake nor for any loss or damage including without limitation to any loss of profit which may arise from reliance on any information supplied by Everest Fortune Group.


Japan's Business Sentiment Mixed, Yen StrengthensThe Japanese yen has gained ground on Tuesday. In the North American session, USD/JPY is trading at 149.27, down 0.47% on the day.
The yen was red-hot in the fourth quarter of 2024, gaining a massive 9.5% against the US dollar, but has reversed directions in Q1, declining 4.7%.
The Manufacturing Tankan index indicated that confidence among manufacturers eased to 12 in Q1 2025, down from 14 in the previous quarter. This was the lowest level in a year, reflective of growing concern among Japanese manufacturers over US tariff policy.
The Non-manufacturing Tankan index, meanwhile, moved in the opposite direction, climbing to 35 in Q1, up from 33 in the Q4 2024 release. This was the fastest pace of growth since August 1991, as companies are increasingly passing on costs to consumers.
The mixed Tankan report is unlikely to change the cautious stance of the Bank of Japan, which has expressed concerns about the uncertainty caused by the threat of additional US tariffs. The BoJ held rates steady in March and the next meeting is on May 1, with the markets projecting another hold.
US President Donald Trump has threatened to impose wide-ranging tariffs on April 2, leaving US trading partners and the financial markets highly anxious ahead of what Trump has declared "Liberation Day".
It is unclear which countries will be targeted or what the tariff rates will be, which has only added to financial market jitters. If Trump goes ahead with the tariffs and targeted countries retaliate with counter-tariffs, we will be one step closer to a global trade war.
USD/JPY has pushed below support at 149.65. Below, there is support at 149.02
There is resistance at 150.59 and 151.22

My LEAP Competition USDJPY Short Position 01/04/2025This is a position trade in LEAP competition that I'm happy to take. USDJPY is at an interesting position and environment where the USD wants to see more room for downwards and JPY wants to see strength. BOJ is neutral-hawkish although there were moments where they sounded neutral-dovish but overall I think with time jpy will strengthen this year.

USDJPY Set To Grow! BUY!
My dear followers,
This is my opinion on the USDJPY next move:
The asset is approaching an important pivot point 149.16
Bias - Bullish
Technical Indicators: Supper Trend generates a clear long signal while Pivot Point HL is currently determining the overall Bullish trend of the market.
Goal - 150.13
About Used Indicators:
For more efficient signals, super-trend is used in combination with other indicators like Pivot Points.
Disclosure: I am part of Trade Nation's Influencer program and receive a monthly fee for using their TradingView charts in my analysis.
———————————
WISH YOU ALL LUCK

Bearish drop?USD/JPY is rising towards the resistanec elvel which is a pullback resistance and could drop from this level to the downside.

USD-JPY Bearish Breakout! Sell!
Hello,Traders!
USD-JPY is trading in a
Downtrend and the pair
Broke our of the bearish
Wedge pattern then made
A retest and is going down
Now so we are bearish
Biased and we will be
Expecting a further move down
Sell!
Comment and subscribe to help us grow!
Check out other forecasts below too!
Disclosure: I am part of Trade Nation's Influencer program and receive a monthly fee for using their TradingView charts in my analysis.

USDJPY (LONG)
Inverse Head and Shoulders
we forming right shoulder and as per Dollar index we looking for bulls

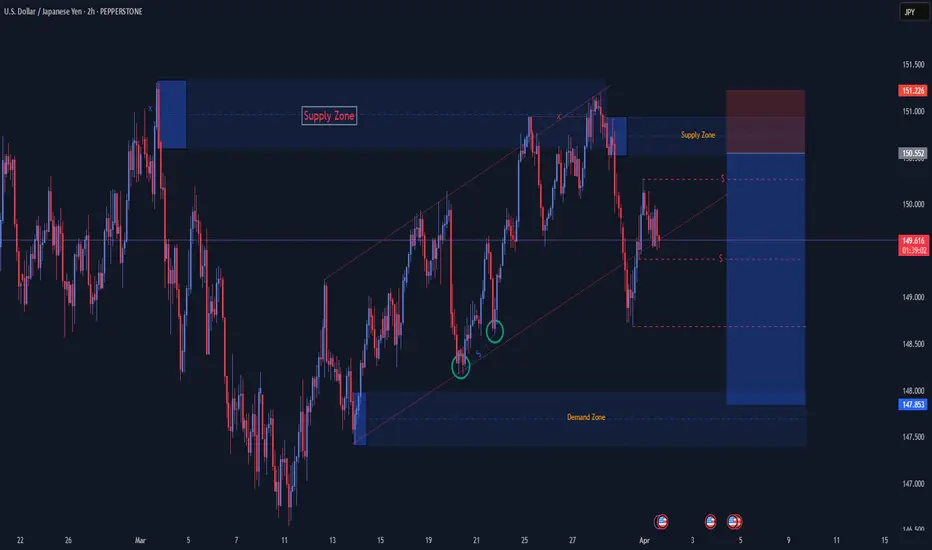
USDJPY 1H – Rejection from Supply Zone, Short Bias ActivatedHey traders 👋
Here's a setup I’m currently watching on USDJPY.
We just saw price react sharply from a clear supply zone around 149.90 – 150.00, which aligns perfectly with a previous structure and imbalance area.
After a solid bearish rejection candle, I entered short with the expectation of a continued drop, targeting the 148.40 support zone. The RR is decent on this one.
Setup details:
Entry: ~149.58
SL: Above the supply zone (~149.95)
TP: ~148.42
Bias: Bearish
RR: ~3.5R
I’m keeping a close eye on how price behaves around the 149.00 psychological level – any strong reaction might warrant partials or tighter management.
Let me know what you think! Are you shorting too or waiting for confirmation?

Triangle Breakout in JPY/USD – Bullish Move Ahead?This TradingView chart represents a detailed technical analysis setup for the Japanese Yen (JPY) against the U.S. Dollar (USD). The main focus of the chart is a symmetrical triangle pattern breakout, a common formation that signals potential price movement.
In this detailed breakdown, we will analyze the following aspects:
Technical Pattern: Symmetrical Triangle Formation
Support and Resistance Levels
Breakout Confirmation
Trading Setup Explanation
Risk Management Strategy
Market Expectations (Bullish & Bearish Scenarios)
Conclusion & Trading Plan
1. Technical Pattern: Symmetrical Triangle Formation
The chart showcases a symmetrical triangle, which is a continuation pattern that typically occurs in trending markets. It indicates a period of consolidation where buyers and sellers struggle for dominance, leading to an eventual breakout.
Characteristics of the Symmetrical Triangle in This Chart:
Converging Trendlines:
The upper trendline (resistance) is sloping downward, showing lower highs.
The lower trendline (support) is sloping upward, showing higher lows.
Apex Formation:
As the price moves closer to the triangle's apex, volatility decreases, creating a squeeze effect.
Breakout Possibility:
Once price reaches a critical point, a breakout is expected in either direction.
Why is This Pattern Important?
Symmetrical triangles suggest that the market is indecisive, but once a breakout occurs, it can trigger a strong price movement.
Traders wait for the breakout direction to confirm the trade before entering a position.
2. Key Support and Resistance Levels
Support and resistance levels are crucial for identifying potential entry, stop-loss, and target areas.
Resistance Level:
A horizontal resistance zone (highlighted in beige) is drawn at the top.
This zone represents historical price rejection levels, where sellers have previously stepped in.
A confirmed breakout above this level would indicate strong bullish momentum.
Support Level:
The lower support zone (marked in blue) acts as a buying interest area.
Price has bounced off this zone multiple times, confirming it as a strong support level.
A break below this zone would signal a bearish reversal.
Trendline Support:
The lower boundary of the symmetrical triangle also acts as dynamic support.
If price respects this trendline, it suggests bullish strength leading to a breakout.
3. Breakout Confirmation & Market Reaction
The most important part of the setup is the breakout, which occurs when the price successfully moves beyond the triangle's trendline resistance.
Key Observations from the Chart:
Breakout Zone:
The breakout occurs near the right edge of the triangle (circled in red).
The price breaks above the upper trendline, confirming a bullish breakout.
Confirmation Candle:
A bullish candle follows the breakout, confirming buying pressure.
Traders should wait for a retest of the trendline before entering.
Volume Consideration:
Strong breakout moves are typically accompanied by a rise in volume, increasing the likelihood of follow-through.
4. Trading Setup Explanation
This trade follows a trend-following breakout strategy, where traders capitalize on price momentum after confirmation.
Entry Point:
The ideal entry is just above the breakout candle.
Traders can also wait for a retest of the broken trendline before entering.
Stop Loss Placement:
The stop loss is placed slightly below the previous swing low at 0.006652.
This prevents excessive drawdowns in case of a false breakout.
Profit Target Calculation:
The profit target is set at 0.006795, which is calculated based on:
The height of the triangle formation projected from the breakout point.
The next major resistance level, aligning with historical price action.
5. Risk Management Strategy
Risk management is a critical component of any trading strategy. Here’s how it is applied in this setup:
Risk-to-Reward Ratio (RRR):
A good trade setup maintains an RRR of at least 2:1.
If the stop loss is 33 pips (0.000033) and the target is 112 pips (0.000112), the RRR is 3:1, making this a high-probability trade.
Position Sizing Consideration:
Risk per trade should be limited to 1-2% of the total account balance.
Leverage should be used cautiously, as breakouts can sometimes retest the breakout zone before continuing.
6. Market Expectations (Bullish & Bearish Scenarios)
Bullish Scenario (Successful Breakout):
✅ If price sustains above the breakout level, it will likely continue to rally toward the target at 0.006795.
✅ A strong bullish momentum candle would confirm further buying pressure.
✅ If volume supports the breakout, trend continuation is highly probable.
Bearish Scenario (False Breakout or Reversal):
❌ If price falls back inside the triangle, it indicates a false breakout.
❌ If price closes below 0.006652, bears take control, and price may drop further.
❌ A breakdown below the support level would shift the market sentiment bearish.
7. Conclusion & Trading Plan
This chart presents a classic symmetrical triangle breakout trade with a clear entry, stop-loss, and target strategy.
Summary of Trading Plan:
Component Details
Pattern Symmetrical Triangle
Breakout Direction Bullish
Entry Point Above the breakout confirmation candle
Stop Loss 0.006652 (below support)
Take Profit (Target) 0.006795
Risk-to-Reward Ratio Favorable (3:1)
Market Bias Bullish (if price sustains above breakout)
Final Considerations:
Always wait for confirmation before entering.
Monitor volume and price action for additional validation.
Stick to the risk management plan to minimize losses.
If executed correctly, this setup offers a high-probability trade with a strong risk-to-reward ratio, making it a profitable trading opportunity in the JPY/USD market.

USDJPY Price ActionHello Traders,
As you can see, the price dropped from the previous supply zone and has formed a new one. Along the way, it created both internal and external liquidity, which helps strengthen the newly formed zone — a common pattern we see repeatedly.
Remember, just because price didn’t move as expected and hit your stop loss, it doesn’t mean your analysis was wrong. That’s exactly why we use stop losses — to protect our capital before chasing profit.
I’ve marked the internal and external liquidity, along with the new supply and demand zones on the chart. As always, without liquidity, there’s no valid zone confirmation. Risk management is key — that’s all you really need.
Wishing you all the best and happy trading.
Thank you!
ONEUSD/JPY Asian Range Pullback Strategy
Timeframe: 30 Minutes
Key Session: Asian Market Hours (00:00 - 05:30 +2GMT)
Strategy Rules
1. Identify the Asian Range
Mark the high and low of USD/JPY between 00:00 - 05:30 ( +2GMT )
Only trade if the range is >25pips (avoids noise).
2. Wait for Breakout + Pullback
Breakout: Price must close outside the range (candle body, not wick).
Pullback: Enter on a 50% retracement of the Asian range.
Longs: Breakout above range → buy at 50% pullback.
Shorts: Breakout below range → sell at 50% pullback.
3. Trade Execution
Entry: 50% retracement level of the Asian range.
Stop Loss:
Longs: Below the range low (for breakouts above).
Shorts: Above the range high (for breakouts below).
Take Profit : 1:1 Risk-Reward (RR).

Bullish USDJPY Trade Idealooking for USDJPY to retest the daily open / intraday highs from this solid - low time frame - support level

USDJPY Swing buys!Bounced perfectly off 61.8 Fib on the weekly timeframe. Only looking for buys until that level is broken. Final target 167

Will the BoJ's hawkish approach affect the yen's strength?
US equity markets plunged amid growing concerns that the Trump administration's tariffs, set to be announced on April 2, could be aggressively implemented. Goldman Sachs warned that US tariff rates could reach as high as 18%, potentially shaving 1.0% off GDP growth and pushing the unemployment rate to 4.5% this year.
Bank of Japan Governor Kazuo Ueda signaled a continued tightening stance, stating that if persistently rising food prices lead to broader inflation, the central bank would consider raising interest rates.
USDJPY broke below the support at 149.50 before retracing to 150.00. However, failing to reenter the channel, the price hovers near the channel’s lower bound. If USDJPY fails to reenter the channel, the price may break below 149.50 again. Conversely, if USDJPY reenters the channel, the price could gain upward momentum toward the resistance at 151.30.

USDJPY InsightHello, subscribers!
Please share your personal opinions in the comments. Don’t forget to like and subscribe!
Key Points
- The White House spokesperson mentioned unfair trade practices in a press briefing, citing examples such as the EU’s 50% dairy tariffs, Japan’s 700% rice tariffs, India’s 100% agricultural tariffs, and Canada’s 300% butter and cheese tariffs. As Japan was specifically mentioned, yen volatility has increased.
- Ahead of President Trump’s reciprocal tariff implementation on April 2, discussions within the ECB are strengthening around the need to hold interest rates steady in April, considering the impact of Germany’s fiscal stimulus.
This Week’s Key Economic Events
+ April 1: Reserve Bank of Australia interest rate decision, Eurozone March CPI
+ April 2: U.S. March ADP Non-Farm Employment Change
+ April 4: U.S. March Non-Farm Payrolls, U.S. March Unemployment Rate, Fed Chair Powell’s speech
USDJPY Chart Analysis
The pair has recently shown strong upward momentum, reaching the 151 level before facing resistance and retreating to the 149 level. As the current support and resistance range is quite narrow, it is crucial to observe the market for further direction.
>>If the 151 level is breached, an upward move toward the 154–155 range can be expected.
>>If it fails to break above 151, support at the 148–149 range will need to be confirmed. A further breakdown below this level could lead to a decline toward the 144–145 range.

USDJPY_2025-03-31Insane Trade Today.
Drawdown:3.8pips
TP: 81 Pips
To start the week, we have price reach and hover at a daily Luquidity Void.
From there, During London came a entry - Below Asia Low.
We would look to enter here being a bit bullish on the DLV.
To reinforce this buy idea, (if you didnt enter at asia low)
Price then broke a near high.
Retraces to the 15min Orderblock, then continued upward to TP at 81pips.

Usdjpy sell ideaWe’ve seen a clear ChOCh on UJ..prices however has reacted off our decisional orderblock I’m shorting

Quick sell on USDJPYUSDJPY is currently reacting off the resistance zone on a 1hr and this might see a bearish continuation off that zone

Potential Bearish Drop?USD/JPY is reacting off the pivot whichis a pullback resistance and could drop from this level to he downside.

USDJPY - Signs of Pull backUSDJPY has broken through the descending trendline after printing strong divergence on MACD. The break out is supported by decent volume bars indicating we might be in for pullback now.

Could the price reverse from here?USD/JPY is rising towards the resistance level which is a pullback resistance that lines up with the 71% Fibonacci retracement and could drop from this level to our take profit.
Entry: 150.40
Why we like it:
There is a pullback resistance level that lines up with the 71% Fibonacci retracement.
Stop loss: 150.89
Why we like it:
There is a pullback resistance that lines up with the 88.6% Fibonacci retracement.
Take profit: 149.62
Why we like it:
There is a pullback support level.
Enjoying your TradingView experience? Review us!
Please be advised that the information presented on TradingView is provided to Vantage (‘Vantage Global Limited’, ‘we’) by a third-party provider (‘Everest Fortune Group’). Please be reminded that you are solely responsible for the trading decisions on your account. There is a very high degree of risk involved in trading. Any information and/or content is intended entirely for research, educational and informational purposes only and does not constitute investment or consultation advice or investment strategy. The information is not tailored to the investment needs of any specific person and therefore does not involve a consideration of any of the investment objectives, financial situation or needs of any viewer that may receive it. Kindly also note that past performance is not a reliable indicator of future results. Actual results may differ materially from those anticipated in forward-looking or past performance statements. We assume no liability as to the accuracy or completeness of any of the information and/or content provided herein and the Company cannot be held responsible for any omission, mistake nor for any loss or damage including without limitation to any loss of profit which may arise from reliance on any information supplied by Everest Fortune Group.
