JPY/USD 4H Chart Analysis – Head & Shoulders Breakdown & BearishThis detailed technical analysis covers a Head & Shoulders pattern formation on the 4-hour chart of JPY/USD, highlighting a potential bearish reversal setup. The pattern suggests a shift from an uptrend to a downtrend, supported by a trendline breakdown and key resistance & support levels.
1️⃣ Understanding the Chart Pattern: Head & Shoulders (H&S)
📉 What is the Head & Shoulders Pattern?
The Head & Shoulders (H&S) is a classic bearish reversal pattern that appears after a prolonged uptrend, signaling a shift in market sentiment from bullish to bearish. It consists of three main parts:
Left Shoulder: A peak followed by a retracement.
Head: A higher peak, indicating the last strong bullish attempt.
Right Shoulder: A lower peak, failing to reach the height of the head, showing weakening momentum.
Neckline: A crucial support level that connects the lows of the shoulders. A confirmed break below this neckline is the trigger for a bearish continuation.
📊 Breakdown of the Pattern in This Chart
Left Shoulder (First Peak): The price made a high and then pulled back.
Head (Higher Peak): The market made another higher high but failed to sustain it, indicating exhaustion.
Right Shoulder (Lower Peak): A weaker attempt to push higher, but price failed to break previous highs, confirming the loss of bullish strength.
Neckline Breakout: The dotted trendline shows the ascending support that was eventually broken, confirming bearish momentum.
2️⃣ Key Technical Levels & Market Structure
Understanding the important levels in the market is crucial for setting up an effective trade.
🟧 Resistance Zone (Supply Area)
The resistance level, marked in a beige box, is located around 0.006800.
Price was rejected multiple times from this zone, confirming strong selling pressure.
The head of the pattern was formed in this region before a sharp drop.
🔵 Support Level (Neckline & Demand Area)
The neckline of the Head & Shoulders pattern was acting as support before being broken.
This level was tested multiple times before the final breakdown.
Once broken, it turned into a resistance level, meaning price may pull back to this area before continuing downward.
📉 Trendline Breakout (Bearish Confirmation)
A dashed trendline was previously supporting the uptrend but was broken, confirming the bearish shift in market structure.
This signals a trend reversal and a possible extended move lower.
3️⃣ Trading Strategy & Execution
A well-planned entry, stop loss, and take-profit strategy is essential for managing risk effectively.
📌 Entry Strategy (Short Setup)
Ideal Entry: Look for price to pull back to the neckline (previous support turned resistance).
Confirmation: Watch for bearish candlestick patterns such as:
Bearish engulfing
Pin bar rejection
Shooting star
Lower highs forming near the neckline
A rejection in this zone confirms seller dominance and a high-probability short setup.
📌 Stop Loss Placement
The Stop Loss is placed above the right shoulder at 0.006725.
This ensures protection from false breakouts or unexpected bullish moves.
📌 Profit Target Projection
Take-Profit Target: The projected move suggests a target at 0.006493.
This aligns with previous structural support, increasing its significance.
The measured move for Head & Shoulders suggests that price could fall further after confirmation.
Risk-Reward Ratio
The Risk (Stop Loss): Around 50 pips.
The Reward (Profit Target): Around 180 pips.
This results in a Risk-Reward Ratio of approximately 1:3, making it an attractive trade.
4️⃣ Market Sentiment & Expected Price Movement
📉 Bearish Scenario (Most Likely)
Price retests the neckline but fails to break above it.
Sellers step in, rejecting the resistance level, leading to further downside.
Price targets the next major support at 0.006493, completing the Head & Shoulders move.
📈 Bullish Scenario (Alternative)
If price reclaims the neckline and moves back above 0.006725, the pattern is invalidated.
This could lead to a bullish continuation back toward previous highs.
In this case, traders should cut losses early and avoid forcing a short trade.
5️⃣ Risk Management & Best Practices
1️⃣ Position Sizing:
Risk only 1-2% of your account per trade to maintain long-term profitability.
2️⃣ Confirmation Before Entry:
Wait for price to reject the neckline resistance before entering short.
Avoid entering too early without clear bearish signs.
3️⃣ Monitor News & Fundamentals:
Major economic events, interest rate decisions, or central bank announcements could impact JPY/USD price action.
🔎 Final Conclusion: Bearish Outlook on JPY/USD
The Head & Shoulders breakdown signals a trend reversal from bullish to bearish.
The neckline breakout confirms seller control over the market.
The best short entry is on a pullback to previous support (now resistance).
Target at 0.006493, with a Stop Loss at 0.006725 ensures controlled risk.
📢 Trading Bias: Bearish 📉
💡 Watch for a retest & rejection before entering short.
USDJPY_LMAX trade ideas

USDJPY 4H USDJPY Analysis
The previous bearish outlook was invalidated early in the week with a break above 149.4, confirming a bullish trend. The uptrend is expected to continue toward 152.73.
However, on the higher timeframe, an unusual price structure suggests a bearish formation, aligning with my projected setup.

possible sellThe price is already in the demand zone in the four-hour time frame. If it breaks 149.506 to remove liquidity, it will retest and then rally down to 147.036, but if it fails to break 149.506, then the price will buy to 151.219 and finally sell off to 147.036

usdjpy looking bearish Formed Ascending channel And seems Like Japanese Yen Turned Bearish, Currently Testing Ascending Channel's Trendline, Incase Of Breakout It Can Provide 200 Pips Bearish Move.

USDJPY bearish engulfing, bearish flag , bearish hammerThe USD JPY was in correction mode of the down trend, On daily time frame it has formed the bearish engulfing candle along with that we can also see a bearish flag and on weekly chart it has formed the inverted hammer , all these indciates the proce gone go down to 145.5 where it has strong support.

BUY USDJPYUSD/JPY has reached a key area of support and is showing signs of reversal on the 1h chart while also being oversold.

USDJPY - Key Levels to WatchThe USD/JPY pair is showing an interesting setup on the 4-hour chart—here's what to watch:
🔹 1️⃣ Ascending Channel in Play: The pair is trending within a bullish channel, signaling an overall upward momentum. Traders should keep an eye on this structure for potential opportunities.
🔹 2️⃣ Support Zone Under Test: Price action is near the critical blue-shaded support area at 149.815. This level has historically held as a strong rebound zone. Buyer activity here could determine the next move!
🔹 3️⃣ Potential Scenarios:
Bullish Case: A strong bounce from the support zone could propel the price higher, maintaining the channel's bullish trend.
Bearish Case: A failure to hold the support level may lead to further declines, possibly testing the lower boundary of the channel.
Insights for Traders: Patience is key—monitor the 149.815 zone for signals before committing to a trade. The combination of price patterns and volume data will provide clarity.

USDJPY swing trade idea Next week, I expect usdjpy to retest 148.000 possibly before the full bullish move will be expected. entry 148.000
SL 146.000 TP 158.000


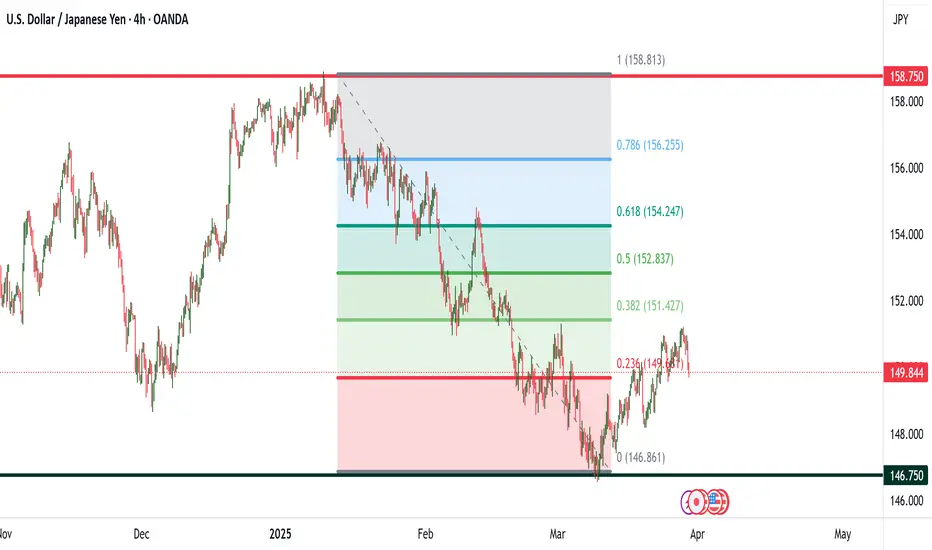
USDJPY Week 14 29032025Our point of reference is what the market has provided. The pair was supplied from price 158.750 on 10-01-2025 making that price level our resistance. Price failed to push below 146.750 on 11-03-2025 and this will serve as a demand price. Price has retraced to 38% of the bearish move. Therefore in the short term, the pair is bullish. The market can play out the following scenarios.
It can be complete bullishness that completes the retracement or
It can be 61% retracement or
The move can void the retracement bias and the main move becomes bullish
And long term is bearish.
So if you want to buy, you can
entry price 150 (buy stop)
take profit 152.5
stop loss 149.25
lot size 0.01
For those of us who wants to sell, we let the bulls run out
entry price 146.750 (sell stop)
take profit 140
stop loss 150
lot size 0.01
Disclaimer: Not a trading advice, practice on demo account from your broker
If you like my post give it boost so that others can find it. If you disagree with my bias, leave a comment and let's chat
Trade idea for upcoming week. bearish opportunity on UJThis week price hit 4h order block that was created two weeks ago and broke structure on the downside. From then, there is a higher chance that price will drop next week. However, nothing is guarantee in trading. A proper risk management is always required on every trade!!!

USDJPY BulishThere is market structure shift in daily timeframe. The price is retesting previous resistance (current support) and 23.6 Fibo level and lower line of uptrend channel. There is a divergence in lower timeframe and a price action. Price is targeting 38.2, 50 and upper channel line.

USDJPYUSDJPY is overall bullish on the higher timeframe we had an impulse leg to the upside previously we are currently at a possible low to buy from i am currently long to the upside to 160

USDJPY SHORT Same setup from previous week, Price respected structure, going to look for an opportunity again
Market structure bearish DW
Entry at both Weekly and Daily
Weekly Rejection at AOi
Previous Weekly Structure Point
Daily Rejection at AOi
Previous Structure point Daily
Around Psychological Level 149.000
H4 Candlestick rejection
Levels 9.99
Entry 95%
REMEMBER : Trading is a Game Of Probability
: Manage Your Risk
: Be Patient
: Every Moment Is Unique
: Rinse, Wash, Repeat!
: Christ is King.

USD/JPY 4H – Bearish Setup Forming?The pair is rejecting a major supply zone, signaling potential downside movement. A liquidity sweep paired with imbalance zone may have fueled this reversal, and price is now testing lower levels.
📊 Key Observations:
✔ Supply Zone Rejection: Price reacted strongly from the 151.200–151.500 zone.
✔ Liquidity Grab ($$$): Stops above the highs may have been taken before the sell-off.
✔ Imbalance (IMB) & Demand Zone: The 147.600–147.800 area remains untested and could act as a target.
🔎 Trade Idea: A short position could be considered upon a retracement into the smaller supply zone (150.600–150.900), targeting the demand zone below.

USDJPY POSSIBLE SELL OPPORTUNITY ALERT!Price has been moving in a channel since last week and we might likely see a massive decline in price following the recent drop last Friday. A sell opportunity is envisaged once price drops lower at the button board. Our target profit is 146.772

USDJPY Bullish OutlookHere is my analysis for USDJPY for the coming weeks.
Price is approaching correctively towards the Lower time frame 0.618-0.500 area or Golden ratio, price is currently forming a Running Flat pattern and may react from that Buy zone area. Another scenario, price may be forming an Expanding Flat pattern or may go lower between 0.786-0.618 area before price reacts towards the upside.
Once the price reacts on the Buy zone, it will be expected to impulsively towards the Sell zone area or Higher time frame 0.618-0.500 or Golden ratio. From there, we might be expecting a long-term Bearish Outlook.

USD/JPY BULLS ARE GAINING STRENGTH|LONG
Hello, Friends!
Previous week’s red candle means that for us the USD/JPY pair is in the downtrend. And the current movement leg was also down but the support line will be hit soon and lower BB band proximity will signal an oversold condition so we will go for a counter-trend long trade with the target being at 150.465.
Disclosure: I am part of Trade Nation's Influencer program and receive a monthly fee for using their TradingView charts in my analysis.
✅LIKE AND COMMENT MY IDEAS✅

ShortYesterday, I opened a short position during the Asian session and published my trade set up , but I ended up manually closing the position before the US open becauseI was a bit anxious about US GDP data.
But the main concern was the price was hovering around the major support and resistance area and I could see valid reasons to go long as well.
The obvious reason for the long position was the price was forming big inverted head and shoulder patterns. So, if the price broke above the resistance area, there would have been a great upside potential.
However, after the US session opened, I ended up opening a short position. The reasons are written in the article I published yesterday. Please read that article that is linked below.
But another argument I would like to add for the bear scenario is this.
In Nov-Dec 2024, we had a very similar set up ( dark blue rectangular box in the chart.) At the time, the price was also forming the inverted head and shoulder at the same support/resistance zone. Once it broke the resistance line, it took off to the upside. And that same scenario can unfold this time as well.
However, what is different between Dec 2024 period and the current period are:
1) VWAP (volume weighted average price) drawn from the major low in 24th Sept was working as support but this time the same VWAP is working as resistance.
2) MACD and RSI were moving from bear zone to the bull zone, but this time they are moving to the downside from the bull zone.
Therefore, I think the momentum is to the downside this time. The only time will tell.
My current short position is quite small. However, once the direction becomes more clear I plan to add more position because the move to the downside from here can be quite significant.

JPY/USD Weekly Forecast – Falling Wedge Breakout & Bullish MoveChart Overview
This chart presents a technical analysis of the Japanese Yen (JPY) against the U.S. Dollar (USD) on a daily timeframe, published on TradingView. The setup is based on a Falling Wedge pattern, which has led to a bullish breakout, signaling a potential price rally. Let's break it down step by step.
1️⃣ Identifying the Pattern – Falling Wedge Formation
The primary pattern identified in the chart is a Falling Wedge, which is a well-known bullish reversal pattern.
Characteristics of the Falling Wedge in this Chart:
Two downward-sloping trendlines (black lines) forming a wedge shape.
Price makes lower highs and lower lows, but the distance between highs and lows gradually narrows.
The breakout occurs when price closes above the upper trendline, confirming a potential uptrend.
Key Observations:
✅ The pattern starts forming around September 2024 and continues until December 2024.
✅ A breakout occurs at the end of December 2024, confirming bullish momentum.
✅ After breaking out, the price retests the wedge's upper boundary, acting as new support before continuing upward.
2️⃣ Support & Resistance Zones – Key Price Levels
Support Level:
The support zone is marked in a beige rectangle at the bottom of the chart.
This is where buyers repeatedly stepped in, preventing further decline.
The price touched this area multiple times before reversing upwards, making it a strong demand zone.
Resistance Level:
The resistance zone is identified at the top of the chart (shaded beige area).
This level represents previous price peaks, where selling pressure was strong.
The price is expected to face some resistance when approaching this zone.
3️⃣ Trend Reversal Confirmation & Bullish Structure
After breaking out of the falling wedge, the price has started forming higher highs and higher lows, indicating an uptrend.
Key Trend Indicators:
✔ Curved blue dashed line suggests an upward trajectory, confirming a rounded bottom reversal.
✔ Price is following a trendline support, validating bullish sentiment.
✔ Momentum is strong, and buyers are in control after the breakout.
4️⃣ Trading Setup – Entry, Stop Loss & Take Profit
This analysis is structured into a trading plan with clear risk management.
📌 Entry Point (Buy Confirmation)
Entry is ideal on a retest of the breakout zone or a continuation of the bullish structure.
The recent higher low serves as a great point to confirm trend continuation.
📌 Stop-Loss Placement
Stop-loss is placed at 0.006465 (marked in blue), below the latest support.
This level ensures protection against false breakouts.
📌 Take Profit Target
The target is set at 0.007128, aligning with historical resistance.
If momentum remains strong, the price might push even higher.
5️⃣ Risk-to-Reward Ratio (RRR) & Trade Justification
Risk-to-Reward Analysis:
Stop-Loss: 0.006465 (below support)
Entry Price: Around 0.006671
Target Price: 0.007128
Risk-to-Reward Ratio: Approximately 1:2.5, meaning for every $1 risked, there's a $2.5 potential gain.
Trade Justification:
✔ Falling Wedge breakout is confirmed.
✔ Retest of broken resistance turned support gives an ideal entry.
✔ Bullish trend structure supports the upside move.
✔ Well-defined stop-loss and take-profit levels provide controlled risk exposure.
6️⃣ Final Thoughts & Conclusion
📌 This is a textbook bullish setup based on a Falling Wedge breakout. The combination of pattern breakout, trend structure, and strong support makes this a high-probability trade.
📌 Potential Risks to Watch:
If price fails to hold above stop-loss, it could indicate bullish weakness.
Major macroeconomic news or fundamental events can shift momentum.
📌 Overall Bias: ✅ Bullish towards the 0.007128 target, as long as the price remains above key support zones.

USDJPY analysis week 14🌐Fundamental Analysis
The Federal Reserve (Fed) kept interest rates unchanged in the 4.25% - 4.50% range and forecast core PCE inflation to average 2.8% by year-end. The higher-than-expected inflation data reinforced expectations that the Fed will maintain current interest rates for an extended period. Investors are concerned that these tariffs could add to global inflationary pressures and trigger a recession.
In Japan, the Tokyo CPI rose sharply in March, boosting expectations that the Bank of Japan (BoJ) will continue to raise interest rates this year. The hot inflation data also supported the Yen's appreciation against other currencies.
🕯Technical Analysis
USDJPY is still in a bullish recovery. The pair is facing support at 149.200, preventing further declines. The weekly high around 151.100 is still acting as key resistance before the pair breaks out to 152.000. Conversely, if the trend breaks at 149.200, weekly support is seen at 148.300.
📈📉Trading Signals
SELL USDJPY 151.300-151.100 SL 150.500
SELL USDJPY 152.000-152.200 SL 152.400
BUY USDJPY 149.300-149.100 SL 148.900

Bearish USDJPY 31 Mar 2025Weekly has a bullish trendline breakout but looking ahead Trump's tariff likely to create volatility for OANDA:USDJPY
Looking to sell near 151 after 4H CHOCH.

