My USDJPY Short Idea 28/03/2025Tokyo CPI came in hot today we have inflation in progress signaling mild-hawkish tone for BOJ. BOJ is known for taking decisions slowly so I do not expect a rate hike to happen soon but we may see it in the very near future. Afterall BOJ Interest rate 0.5 is considered high for its historical data. Aiming for 1.00 interest rate is something huge that few people understands its magnitude.
Taking this short attempt.
USDJPY_LMAX trade ideas

ShortI had a few failed short trades in the last few weeks for this pair.
My overall bias is bearish and I must admit having a strong bias cost me. I was too eager to execute a trade and I ended up front running and instead of reacting to the price action.
This morning, I opened two short positions (1 position size divided into two) for USDJPY .
Trade set up:
Entry: 150.945Stop Loss: 151.458
Target 1: 149.680 (blue horizontal line - previous week open price, Fair value gap and order block in 4H) Target 2: 148.306 (Previous week low, fair value gap )
Reasons for short entry:
Weekly:
The price had broken and closed below the previous low at 148.65. It went up again but it is respecting FVG at 150.50 zone.
RSI is starting to enter the bear territory.
Daily:
The price is still below EMA 200 and is respecting FVG at 150.50 zone.
RSI line is still in the bear zone.
4H:
The price dropped and closed below the ascending trendline.
I like the candlestick formations at the FVG - very small candles with upper wicks followed by a large engulfing candle. (1H is better to see the price movement). Sorry, I forgot the name of this formation! RSI is presenting negative divergence.
Ideally, it is better to wait for the price to drop, retest and close below 200EMA in 4H and 4H RSI to dive into bear territory. However, I felt there are enough confluences to support my bias and I like the risk:reward for this set up. Therefore, I decided to open a short position, but my position size is small.
Please let me know what you think.

USD/JPY(20250328)Today's AnalysisToday's buying and selling boundaries:
150.74
Support and resistance levels
151.83
151.42
151.16
150.32
150.06
149.66
Trading strategy:
If the price breaks through 151.16, consider buying, the first target price is 151.42
If the price breaks through 150.74, consider selling, the first target price is 150.32

USDJPY Technical AnalysisF enzo F x—USD/JPY tested the 151.2 resistance but failed to make new highs, retreating to around 150.4.
Bullish Scenario : The primary trend remains bullish, but a close above 151.2 is needed to target 154.8.
Bearish Scenario : A break below 149.540 could spark bearish momentum toward 145.5.

USDJPY Will Go Lower! Short!
Take a look at our analysis for USDJPY.
Time Frame: 3h
Current Trend: Bearish
Sentiment: Overbought (based on 7-period RSI)
Forecast: Bearish
The market is on a crucial zone of supply 150.395.
The above-mentioned technicals clearly indicate the dominance of sellers on the market. I recommend shorting the instrument, aiming at 149.580 level.
P.S
Please, note that an oversold/overbought condition can last for a long time, and therefore being oversold/overbought doesn't mean a price rally will come soon, or at all.
Disclosure: I am part of Trade Nation's Influencer program and receive a monthly fee for using their TradingView charts in my analysis.
Like and subscribe and comment my ideas if you enjoy them!

USD/JPY - Potential TargetsDear Fellow Traders,
This major pair has the potential for a "SHORT" - RSI Divergence.
Upside is limited in the short term.
A strong quality breakout is necessary, either way.
Feel free to ask if anything is unclear.
Thank you for taking the time to study my analysis.

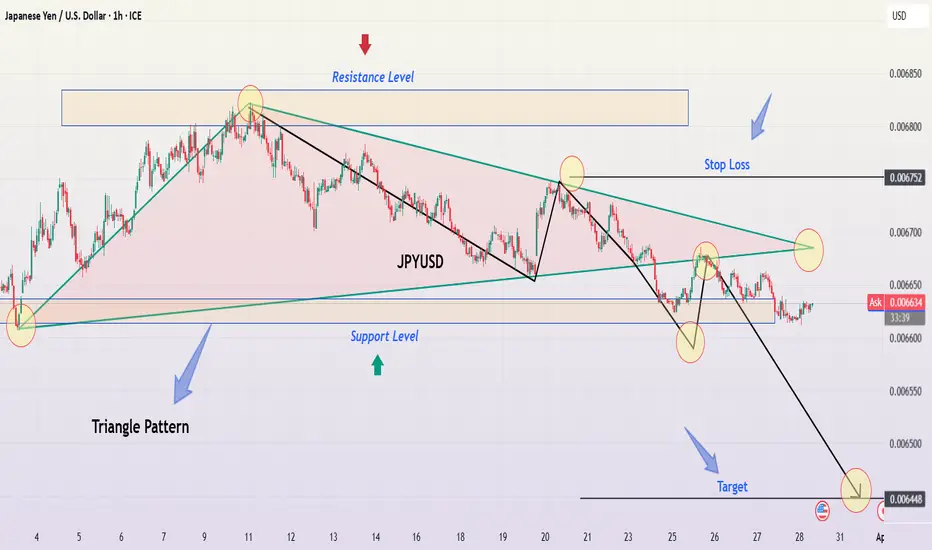
JPY/USD Descending Triangle Breakdown – Bearish Trading Setup📌 Overview: Understanding the Current Market Structure
This analysis focuses on the JPY/USD pair on the 1-hour timeframe, highlighting a well-defined descending triangle pattern, a classic bearish continuation setup. The price action indicates selling pressure increasing as lower highs form, while support remained relatively stable before ultimately breaking down.
This setup suggests a potential trend continuation to the downside, making it a compelling trade opportunity for short-sellers. Let's dive deeper into the technical breakdown, trading strategy, and market expectations.
📊 Technical Breakdown: Chart Pattern Analysis
1️⃣ The Descending Triangle Pattern: A Bearish Signal
The descending triangle is one of the most reliable continuation patterns in technical analysis, often leading to a breakdown when support is breached. This chart confirms the pattern through:
✅ Downward Sloping Resistance Line:
The price tested this level multiple times but was consistently rejected.
Lower highs indicate sellers are dominating and buyers are failing to push higher.
✅ Flat Support Level:
The price found strong support at a key horizontal level, bouncing off multiple times.
However, each bounce became weaker, signaling buyers losing strength.
✅ Breakout & Confirmation:
The final breakdown below support occurred with strong momentum.
The price has now turned previous support into resistance, a bearish confirmation.
🔎 Implication:
A descending triangle breakout to the downside often results in an extended downward move, aiming for the measured move target based on the triangle’s height.
2️⃣ Key Price Levels & Trading Zones
📌 🔴 Resistance Zone (Upper Triangle Boundary):
0.006700 – 0.006750
This level acted as a strong rejection zone, confirming lower highs.
It now serves as a resistance level after the breakdown.
📌 🟢 Support Level (Triangle Base):
This level previously held price from breaking lower multiple times.
However, with each bounce becoming weaker, it finally gave way.
Break & Close below this level confirms the bearish continuation.
📌 🎯 Target Projection (Based on Triangle Breakout):
0.006448 (Final Target) – This level aligns with historical price action and the triangle’s projected move.
📌 🚨 Stop Loss Placement:
Above the last swing high (~0.006752)
If price reclaims this zone, the bearish outlook becomes invalid.
📈 Price Action & Market Sentiment
3️⃣ Bearish Momentum & Breakdown Confirmation
✅ Lower Highs Indicate Weakness:
Buyers attempted multiple recoveries but were consistently rejected at lower levels.
This pattern suggests exhaustion in buying pressure.
✅ Breakout Candle Strength & Volume Confirmation:
The price broke support with strong momentum and increased volume, confirming sellers’ control.
A breakdown without volume is often a fakeout, but this chart shows clear momentum.
✅ Potential Retest Before Further Drop:
After a breakdown, price often retests the broken support before continuing lower.
A pullback to the resistance zone (~0.006650 - 0.006700) could offer an ideal short entry.
✅ Bearish Trend Confirmation:
The price remains below key resistance and continues forming lower lows.
The downtrend structure remains intact, reinforcing the bearish sentiment.
📉 Trading Strategy: How to Trade This Setup?
🔹 Entry Strategy:
Ideal Entry: Short after a pullback to broken support (~0.006650 - 0.006700).
Aggressive Entry: Short immediately on the breakdown if momentum remains strong.
🔹 Stop Loss Placement:
Place above last swing high (0.006752) to avoid being stopped out by noise.
Ensures protection against sudden bullish reversals or fakeouts.
🔹 Take Profit Targets:
✅ First Target: 0.006500 (Psychological level)
✅ Final Target: 0.006448 (Triangle measured move)
🔹 Risk Management:
Use a Risk-to-Reward ratio (RRR) of at least 1:2 for an optimal trade setup.
Never risk more than 2% of total capital per trade.
⚠️ Market Outlook & Key Watchpoints
📌 Scenario 1: Bearish Continuation (High Probability)
If price retests the broken support and faces rejection, expect further downside.
Target remains at 0.006448.
📌 Scenario 2: Fake Breakdown & Bullish Reversal (Low Probability)
If price closes above 0.006750, it invalidates the bearish setup.
In that case, a bullish move towards 0.006800+ is possible.
📢 Final Thoughts:
The bearish breakout is clear, but waiting for a proper pullback before entry is ideal.
Volume confirmation is crucial to avoid fakeouts.
If support turns into resistance, a high-probability short trade is set up.
🔹 What’s your take on this setup? Will JPY/USD reach its target? Drop your thoughts below! 🚀
#JPYUSD #ForexTrading #TechnicalAnalysis #PriceAction
USDJPY has formed a head and shoulders bottom patternOn the 4-hour chart, USDJPY formed a head-and-shoulders bottom pattern and then stabilized upward, with a short-term bullish trend. Currently, the effective support below is around 149.5, and it is expected to continue to rise if it falls back and does not break. The upper resistance is around 152.3, and after breaking through, the upper resistance is around 154.5.

USDJPY Long BiasThe USDJPY pair on the 4H timeframe is forming a bullish structure, showing signs of continuation to the upside. The price is currently trading above key moving averages and consolidating near a resistance-turned-support zone, indicating potential bullish momentum.
Additionally, the formation resembles an inverse head and shoulders pattern, a strong bullish reversal signal. A successful break and retest of the 151.200 zone could confirm further upside movement, with the next key target around 156.700. However, failure to hold above the support zone may lead to a deeper retracement before resuming the uptrend.

Fundamental Market Analysis for March 28, 2025 USDJPYEvent to pay attention to today:
14:30 EET. USD - Core PCE Price Index
USDJPY:
On Friday, during the Asian session, the Japanese yen (JPY) fell to a near four-week low against its US counterpart. This was due to concerns that US President Donald Trump's trade tariffs could affect key domestic exports. However, the release of robust consumer inflation data from Tokyo provided a welcome respite for those anticipating a more hawkish stance from the Bank of Japan (BoJ), potentially paving the way for further interest rate hikes. The BoJ's opinion summary also indicates that a rate hike remains a possibility should the economy and prices align with forecasts.
Additionally, the prevailing risk-off environment, triggered by Trump's imposition of auto tariffs late Wednesday, has served to support the safe-haven yen, leading to a fall in the USD/JPY pair below 151.00 in the last hour. However, the emergence of some US Dollar (USD) dip buying could support the currency pair and help limit further losses. Additionally, traders may adopt a wait-and-see approach, preferring to observe the US Personal Consumption Expenditure (PCE) price index to ascertain the Federal Reserve's (Fed) rate-cutting intentions.
Trade recommendation: BUY 151.000, SL 150.400, TP 151.750

Bearish drop off overlap resistance?USD/JPY is reacting off the pivot and could drop to the 1st support which has been identified as an overlap support.
Pivot: 151.23
1st Support: 149.91
1st Resistance: 152.23
Risk Warning:
Trading Forex and CFDs carries a high level of risk to your capital and you should only trade with money you can afford to lose. Trading Forex and CFDs may not be suitable for all investors, so please ensure that you fully understand the risks involved and seek independent advice if necessary.
Disclaimer:
The above opinions given constitute general market commentary, and do not constitute the opinion or advice of IC Markets or any form of personal or investment advice.
Any opinions, news, research, analyses, prices, other information, or links to third-party sites contained on this website are provided on an "as-is" basis, are intended only to be informative, is not an advice nor a recommendation, nor research, or a record of our trading prices, or an offer of, or solicitation for a transaction in any financial instrument and thus should not be treated as such. The information provided does not involve any specific investment objectives, financial situation and needs of any specific person who may receive it. Please be aware, that past performance is not a reliable indicator of future performance and/or results. Past Performance or Forward-looking scenarios based upon the reasonable beliefs of the third-party provider are not a guarantee of future performance. Actual results may differ materially from those anticipated in forward-looking or past performance statements. IC Markets makes no representation or warranty and assumes no liability as to the accuracy or completeness of the information provided, nor any loss arising from any investment based on a recommendation, forecast or any information supplied by any third-party.

USD/JPY H4 | Falling to Fibonacci confluence supportUSD/JPY is falling towards a multi-swing-low support and could potentially bounce off this level to climb higher.
Buy entry is at 150.11 which is a multi-swing-low support that aligns with a confluence of Fibonacci levels i.e. the 23.6% and 38.2% retracements.
Stop loss is at 149.30 which is a level that lies underneath a multi-swing-low support and the 38.2% Fibonacci retracement level.
Take profit is at 151.17 which is an overlap resistance.
High Risk Investment Warning
Trading Forex/CFDs on margin carries a high level of risk and may not be suitable for all investors. Leverage can work against you.
Stratos Markets Limited (www.fxcm.com):
CFDs are complex instruments and come with a high risk of losing money rapidly due to leverage. 63% of retail investor accounts lose money when trading CFDs with this provider. You should consider whether you understand how CFDs work and whether you can afford to take the high risk of losing your money.
Stratos Europe Ltd (www.fxcm.com):
CFDs are complex instruments and come with a high risk of losing money rapidly due to leverage. 63% of retail investor accounts lose money when trading CFDs with this provider. You should consider whether you understand how CFDs work and whether you can afford to take the high risk of losing your money.
Stratos Trading Pty. Limited (www.fxcm.com):
Trading FX/CFDs carries significant risks. FXCM AU (AFSL 309763), please read the Financial Services Guide, Product Disclosure Statement, Target Market Determination and Terms of Business at www.fxcm.com
Stratos Global LLC (www.fxcm.com):
Losses can exceed deposits.
Please be advised that the information presented on TradingView is provided to FXCM (‘Company’, ‘we’) by a third-party provider (‘TFA Global Pte Ltd’). Please be reminded that you are solely responsible for the trading decisions on your account. There is a very high degree of risk involved in trading. Any information and/or content is intended entirely for research, educational and informational purposes only and does not constitute investment or consultation advice or investment strategy. The information is not tailored to the investment needs of any specific person and therefore does not involve a consideration of any of the investment objectives, financial situation or needs of any viewer that may receive it. Kindly also note that past performance is not a reliable indicator of future results. Actual results may differ materially from those anticipated in forward-looking or past performance statements. We assume no liability as to the accuracy or completeness of any of the information and/or content provided herein and the Company cannot be held responsible for any omission, mistake nor for any loss or damage including without limitation to any loss of profit which may arise from reliance on any information supplied by TFA Global Pte Ltd.
The speaker(s) is neither an employee, agent nor representative of FXCM and is therefore acting independently. The opinions given are their own, constitute general market commentary, and do not constitute the opinion or advice of FXCM or any form of personal or investment advice. FXCM neither endorses nor guarantees offerings of third party speakers, nor is FXCM responsible for the content, veracity or opinions of third-party speakers, presenters or participants.

Daily CLS I KL - Order Block, Model 3 Continuation setupHey Traders!!
Feel free to share your thoughts, charts, and questions in the comments below—I'm about fostering constructive, positive discussions!
🧩 What is CLS?
CLS represents the "smart money" across all markets. It brings together the capital from the largest investment and central banks, boasting a daily volume of over 6.5 trillion.
✅By understanding how CLS operates—its specific modes and timings—you gain a powerful edge with more precise entries and well-defined targets.
🛡️Follow me and take a closer look at Models 1 and 2.
These models are key to unlocking the market's potential and can guide you toward smarter trading decisions.
📍Remember, no strategy offers a 100%-win rate—trading is a journey of constant learning and improvement. While our approaches often yield strong profits, occasional setbacks are part of the process. Embrace every experience as an opportunity to refine your skills and grow.
Wishing you continued success on your trading journey. May this educational post inspire you to become an even better trader!
“Adapt what is useful, reject what is useless, and add what is specifically your own.”
David Perk ⚔

USD/JPY Nears 200-dma Re-Test After 150 DefenseUSD/JPY has continued to snag bears with several bear traps so far this year. While there was a series of lower-lows in the first part of March, as the USD was plummeting against most major currencies, USD/JPY has turned around over the past three weeks, and is now nearing a re-test of the 200-day moving average.
The 150.77 Fibonacci level held the highs on Monday, Tuesday and Wednesday of this week, and that now becomes a spot of higher-low support potential for pullback scenarios. For next resistance, the 151.51 Fibonacci level is nearing confluence with the 200-day moving average, and the 151.95 level remains important. If bulls can stretch the move, that seems a logical area to look for a pause in the trend. - js

USD-JPY Resistance Ahead! Sell!
Hello,Traders!
USD-JPY keeps growing
But will soon hit a horizontal
Resistance of 151.466
So after the retest we will
Be expecting a local
Bearish correction
Sell!
Comment and subscribe to help us grow!
Check out other forecasts below too!
Disclosure: I am part of Trade Nation's Influencer program and receive a monthly fee for using their TradingView charts in my analysis.

USDJPY LongAussie Inflation and BOJ Decision in focuse
Dollar getting strong because of FED Decision:,,No-rates cuts!,,
2 ways to trade this:
aggressive entry
and conservative entry:Risk to enter the 2nd approach(That price comes back to the 2nd entry is 37,25% but higher reward-risk ratio
Risk management based on your risk appetite

USDJPYWe've got this massive inverted head and shoulder on the daily and h4 that has been forming for a full month. Major upside movement very soon. Keep a look out.

USDJPY 15M LAST PUMP TO UPSIDE BEFORE MASSIVE CRASHWe have few more up to go, still i see bearish sign LONG TERM
But we have unfinish business around 151.65-151.87 (WHICH WILL BE VERY GOOD AREA TO SELL, IF WE GET SELLING FORMATION CANDLE)
Good luck

LAST SELLING OPPORTUNITY FOR UJWe are at the last huddle for UJ, break above this upper daily trend line will suggested market change to bullish, which i still see this as bearish market (GOOD AREA AS WELL TO HOLD TILL 140.85)
Will take some profit along the way

USDJPY: Short Trading Opportunity
USDJPY
- Classic bearish pattern
- Our team expects retracement
SUGGESTED TRADE:
Swing Trade
Sell USDJPY
Entry - 150.88
Stop - 151.54
Take - 149.68
Our Risk - 1%
Start protection of your profits from lower levels
Disclosure: I am part of Trade Nation's Influencer program and receive a monthly fee for using their TradingView charts in my analysis.
❤️ Please, support our work with like & comment! ❤️

USD/JPY AnalysisIn this video I am sharing the possible scenarios that could take place for the UJ pair.
Keeping in mind that tomorrow we have Tokyo CPI and PCE numbers in the US.

15M USDJPY ANOTHER SELLING SQUIZZZZZ LOLSellers hasnt done yet, i went in as seen on the chart. Another one of those try to earn as many pips then you can :)

USD/JPY For Bullishwait for pull-back near by entry point and then go long
general trend is up trend
have fun :)
