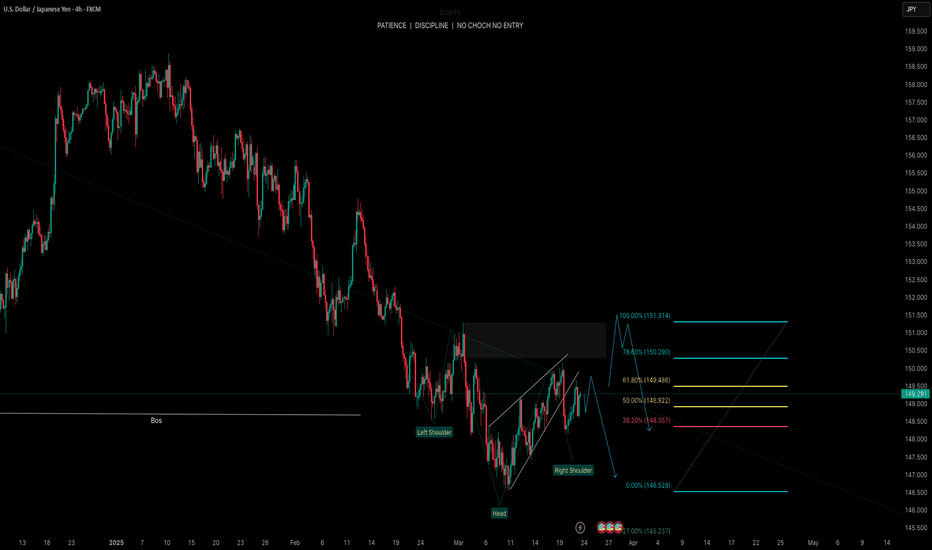
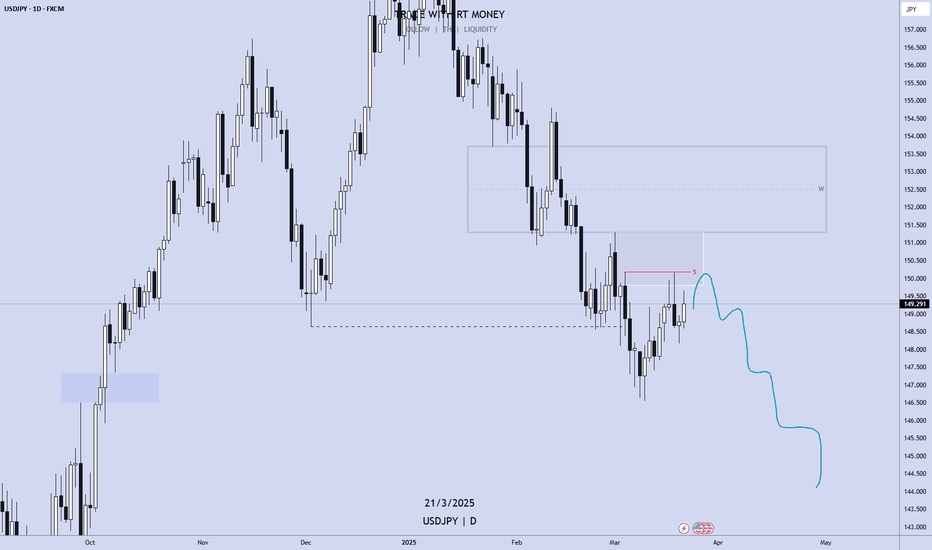
USD/JPY - Playing the Retracement SmartThe 4H is locked in a bearish structure, breaking a major recent low—confirming downside intent. But before further drops, I see a play. Liquidity needs to be grabbed, and that means a bullish retracement is on the table.
Dropping to the 30M, I’m looking for confirmation to ride the bulls up into the 4H supply zone—the red zone where sellers are likely waiting. Precision over impulse, patience over noise. Let’s see how price delivers.
Bless Trading!
USDJPY_LMAX trade ideas
USD/JPY(20250324)Today's AnalysisToday's buying and selling boundaries:
149.18
Support and resistance levels:
150.25
149.85
148.59
148.77
148.51
148.11
Trading strategy:
If the price breaks through 148.59, consider buying, the first target price is 149.85
If the price breaks through 149.18, consider selling, the first target price is 148.77
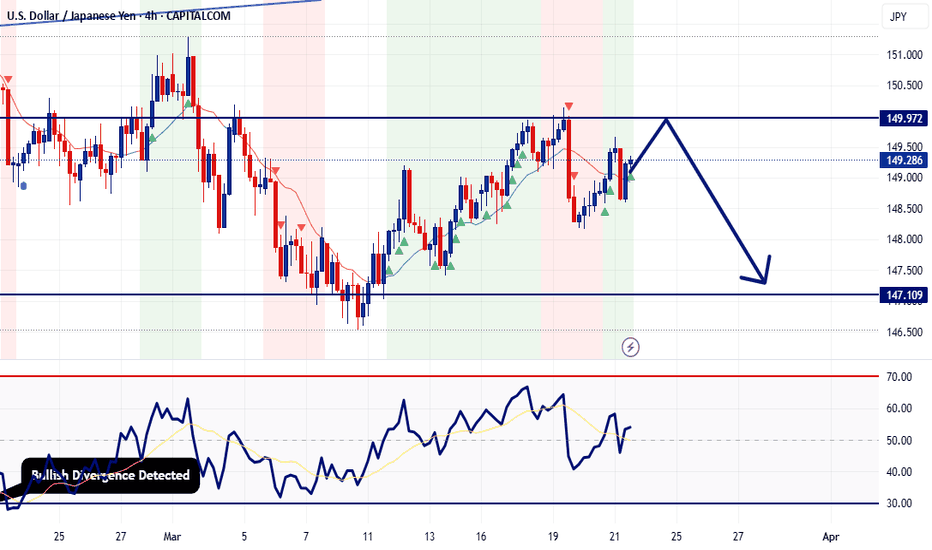
Potential bearish reversal?USD/JPY is rising towards the pivot and could reverse to the 1st support which has been identified as an overlap support.
Pivot: 151.21
1st Support: 146.92
1st Resistance: 154.40
Risk Warning:
Trading Forex and CFDs carries a high level of risk to your capital and you should only trade with money you can afford to lose. Trading Forex and CFDs may not be suitable for all investors, so please ensure that you fully understand the risks involved and seek independent advice if necessary.
Disclaimer:
The above opinions given constitute general market commentary, and do not constitute the opinion or advice of IC Markets or any form of personal or investment advice.
Any opinions, news, research, analyses, prices, other information, or links to third-party sites contained on this website are provided on an "as-is" basis, are intended only to be informative, is not an advice nor a recommendation, nor research, or a record of our trading prices, or an offer of, or solicitation for a transaction in any financial instrument and thus should not be treated as such. The information provided does not involve any specific investment objectives, financial situation and needs of any specific person who may receive it. Please be aware, that past performance is not a reliable indicator of future performance and/or results. Past Performance or Forward-looking scenarios based upon the reasonable beliefs of the third-party provider are not a guarantee of future performance. Actual results may differ materially from those anticipated in forward-looking or past performance statements. IC Markets makes no representation or warranty and assumes no liability as to the accuracy or completeness of the information provided, nor any loss arising from any investment based on a recommendation, forecast or any information supplied by any third-party.
USDJPY Short from ResistanceHello Traders
In This Chart USDJPY HOURLY Forex Forecast By FOREX PLANET
today USDJPY analysis 👆
🟢This Chart includes_ (USDJPY market update)
🟢What is The Next Opportunity on USDJPY Market
🟢how to Enter to the Valid Entry With Assurance Profit
This CHART is For Trader's that Want to Improve Their Technical Analysis Skills and Their Trading By Understanding How To Analyze The Market Using Multiple Timeframes and Understanding The Bigger Picture on the Charts
USDJPY at Pivotal MomentThe USD/JPY pair is indeed at a critical juncture as of March 23, 2025, testing resistance around 149. Let’s analyze this based on the historical price levels and the current market context, without inventing unsupported details.
The 149 level has shown significance in recent history. On December 24, 2024, USD/JPY faced resistance near this zone (close to 149.20 per X posts around that time), followed by a rejection that aligns with your noted potential reversal. Similarly, on August 15, 2024, after peaking around 149.50 earlier in the month, the pair reversed sharply, dropping over 13% from July highs near 162 to test 141.70 by early August (Forex.com, Aug 28, 2024). This historical behavior suggests 149 acts as a pivotal resistance where bullish momentum has previously faltered, supporting a possible decline if it fails again.
If USD/JPY breaks above 149, the next major resistance at 157 is plausible, rooted in historical data. On January 9, 2025, the pair approached 157 during a post-election USD rally (X sentiment), and on May 24, 2024, it tested 157.91 amid a bullish leg (J2T.com, Nov 5, 2024). A break above 149 could signal renewed USD strength, potentially driven by Fed policy expectations or yen weakness, targeting 157 as a key ceiling where sellers might reemerge.
Conversely, if 149 holds as resistance and the pair breaks below, support at 140 aligns with past levels. On September 17, 2024, USD/JPY stabilized near 140.25–141.02 after a steep decline (Forex.com, Sep 13, 2024), and on December 28, 2023, it found support at 141.40 (FinanceFeeds, Sep 12, 2024). A drop below 149 could see bears push toward 140, especially if risk-off sentiment or a stronger yen (e.g., BoJ hawkishness) takes hold.
Current price action, hovering around 149.287 as of March 22, 2025 (LiteFinance.org), shows RSI declining below 50 and bearish candlestick patterns like Evening Star near higher levels (e.g., 161.57), hinting at fading bullish momentum (Web ID: 0). The 50-day moving average lies below, and 140.55 is flagged as a key support by analysts, reinforcing 140 target if downside prevails. Posts on X from March 19–22, 2025, also note resistance at 149.50–150, with supports at 147.60–148.80, suggesting a tight range before a decisive move.
USD/JPY is at a pivotal moment at 149. A break above could test 157, backed by January and May 2024 highs, while failure might drive it to 140, consistent with September 2024 and December 2023 supports. The outcome hinges on momentum and broader market triggers like Fed or BoJ signals—watch for a clear break to confirm direction.
USD/JPY Bullish Outlook – Targeting Key Resistance at 150.155USD/JPY Technical Analysis – Bullish Outlook Toward Resistance
Chart Insights:
The price is currently in a recovery phase after a significant drop.
A Fair Value Gap (FVG) zone has been identified, suggesting a potential pullback before further movement.
The target point aligns with the resistance level around 150.155, which acts as a key supply zone.
Potential Scenario:
Price may retrace into the FVG zone around 148.704 – 148.956.
A bullish rebound from this level could drive price toward the resistance at 150.155.
If price reaches the resistance level, further rejection or continuation will depend on market conditions.
Key Levels:
Support Zone: 148.167 – 148.315
FVG Area: 148.704 – 148.956
Resistance Zone: 150.007 – 150.155 (Target area)
Conclusion:
The current structure suggests a bullish bias if price respects the FVG zone for a push higher. However, a break below the FVG could signal further downside movement.
USD/JPY Premium Trade Setup | High-Probability Short OpportunityKey Elements in the Chart:
Uptrend Channel: The price was moving inside an ascending channel but recently broke downward.
Resistance Zone: Marked near the 150.000 level, indicating a key rejection area where sellers are strong.
Sell Zone: A potential short-selling opportunity is identified around 149.300 after a breakdown from the channel.
Support Zone: Located around 148.500, where the price may find temporary buying interest.
Target: The final target for the bearish move is near 147.000, suggesting a further downside potential.
Trading Idea:
Bias: Bearish (selling opportunity after a trendline break)
Entry: Near 149.300 (confirmed rejection)
Target: 147.000
Risk Management: Stop-loss can be placed above the resistance area.
This setup suggests that USD/JPY may continue its downward move after failing to sustain the uptrend. Traders should watch for confirmation signals before entering.
Bearish reversal off pullback resistance?USD/JPY is rising towards the resistance level that is a pullback resistance and could reverse from this level to our take profit.
Entry: 149.68
Why we like it:
There is a pullback resistance level which is a pullback resistance.
Stop loss: 150.16
Why we like it:
There is a pullback resistance level that line sup wit the 138.2% Fibonacci extension.
Take profit: 148.96
Why we like it:
There is a pullback support level.
Enjoying your TradingView experience? Review us!
Please be advised that the information presented on TradingView is provided to Vantage (‘Vantage Global Limited’, ‘we’) by a third-party provider (‘Everest Fortune Group’). Please be reminded that you are solely responsible for the trading decisions on your account. There is a very high degree of risk involved in trading. Any information and/or content is intended entirely for research, educational and informational purposes only and does not constitute investment or consultation advice or investment strategy. The information is not tailored to the investment needs of any specific person and therefore does not involve a consideration of any of the investment objectives, financial situation or needs of any viewer that may receive it. Kindly also note that past performance is not a reliable indicator of future results. Actual results may differ materially from those anticipated in forward-looking or past performance statements. We assume no liability as to the accuracy or completeness of any of the information and/or content provided herein and the Company cannot be held responsible for any omission, mistake nor for any loss or damage including without limitation to any loss of profit which may arise from reliance on any information supplied by Everest Fortune Group.
Idea for a set upUSD/JPY falls back as the US Dollar gains on the Fed’s support for a restrictive policy stance.
US President Trump’s tariff policies are expected to boost US inflation and weigh on economic growth.
Japan’s National CPI cooled down in February.
The USD/JPY pair gives up entire intraday gains after facing selling pressure around 149.60 and drops to near 148.60 during North American trading hours on Friday. The asset drops as the US Dollar (USD) gains, with the US Dollar Index (DXY) rising to near 104.00.
The Greenback attracts bids as the Federal Reserve (Fed) is unlikely to cut interest rates in the near term. On Wednesday, Fed Chair Jerome Powell stated that they are not in a hurry to cut interest rates amid “unusually elevated” uncertainty over the United States (US) economic outlook under the leadership of President Donald Trump. Powell also warned that Trump’s tariff policy tends to push growth lower and inflation higher.
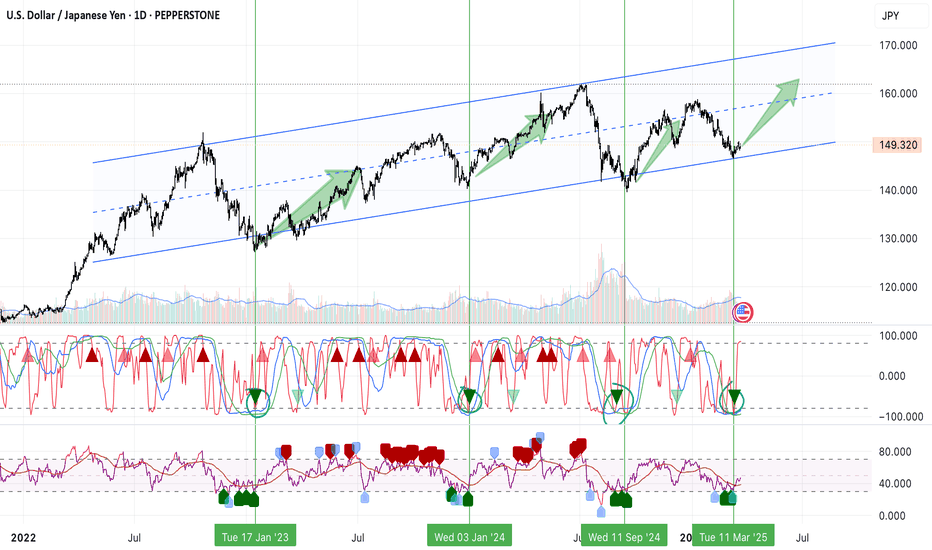
USDJPY BUY SETUPThe USD/JPY daily chart shows a descending channel pattern, with price recently testing the lower boundary and rebounding. Key resistance levels are marked as TP1 (around 155.000), TP2 (approximately 162.327 - 165.941), and TP3 (near 178.490 - 178.635), indicating potential bullish targets. The price is currently hovering around 149.300, with a possible breakout above the channel signaling further upside movement. The marked support levels around 146.481 - 144.946 suggest a critical zone for risk management.
Risk Management Disclaimer:
Trading in financial markets involves significant risk and may not be suitable for all investors. The analysis provided is for informational purposes only and does not constitute financial advice. Past performance is not indicative of future results. Always conduct your own research, use proper risk management strategies, and consult with a professional financial advisor before making trading decisions. Never trade with money you cannot afford to lose.
USDJPY – Major Symmetrical Triangle Breakdown | Retest PlayUSDJPY has recently broken down from a large symmetrical triangle pattern visible on the 4H timeframe. After a prolonged uptrend that formed the triangle structure, price decisively broke below the lower support line, indicating a shift in momentum from bullish to bearish.
📊 Technical Breakdown
1. Symmetrical Triangle Breakdown
Price formed a classic symmetrical triangle pattern over several months.
A strong bearish breakout occurred from the lower trendline, signaling a potential reversal.
The projected measured move target from this breakdown points toward 141.526, representing a 6.5% decline.
2. Retest Zone
Price has pulled back to retest the broken triangle trendline from below.
This bearish retest setup is a textbook confirmation of resistance turning from previous support.
The current consolidation suggests the market is gathering liquidity before a potential next leg down.
3. Market Structure & Momentum
Lower highs and lower lows are now forming post-breakdown, confirming a bearish structure.
A clear rejection from the retest zone around the 151.500–152.000 level would further validate the short thesis.
🧠 Trade Idea
Entry Zone: On confirmation of rejection near the retest (~151.5 area)
Target : 141.526 (Measured move from triangle breakdown)
Stop Loss : Above the triangle high or above the recent swing (~153.00+)
Risk-Reward : High probability play based on pattern + structure shift
⚠️ Key Watch Levels
Resistance: 151.5–152.0 (triangle retest)
Support/Target: 141.5 (measured move)
Break above 153.0 will invalidate this bearish bias.
DOLLAR/YEN LAST WEEK OF THE 1st 1/4The Bank of Japan (BOJ) raised its interest rate to 0.5% in March 2025, marking a significant policy shift.
This decision was made unanimously during the March 18-19, 2025, Monetary Policy Meeting.
It seems likely that this move reflects the BOJ's confidence in Japan's economic recovery and stable inflation around 2%.
The U.S. Dollar Index (DXY) as of March 21, 2025, is around 104.0880, showing stability.
It seems likely that the Bank of Japan's (BOJ) rate hike on March 19, 2025, had minimal impact, with the dollar slightly strengthening afterward.
Research suggests the dollar's strength is driven by U.S. economic growth and monetary policy differences, despite global rate changes.
Weekly FOREX Forecast Mar 24-28: Buy CAD, CHF, JPY vs USD!This is an outlook for the week of March 24 - 28th.
In this video, we will analyze the following FX markets:
USD Index
EUR
GBP
AUD
NZD
The USD Index is entering a Daily +FVG, which is nested in a Weekly +FVG. This is a bearish indication for the USD, which is a potential bullish situation for EURUSD, GBPUSD, AUDUSD and NZDUSD. This will be potentially bearish for the USDCAD, USDCHF, and USDJPY. Wait for the market structure shift going in the direction of your TP, and enter on the pullback.
Enjoy!
May profits be upon you.
Leave any questions or comments in the comment section.
I appreciate any feedback from my viewers!
Like and/or subscribe if you want more accurate analysis.
Thank you so much!
Disclaimer:
I do not provide personal investment advice and I am not a qualified licensed investment advisor.
All information found here, including any ideas, opinions, views, predictions, forecasts, commentaries, suggestions, expressed or implied herein, are for informational, entertainment or educational purposes only and should not be construed as personal investment advice. While the information provided is believed to be accurate, it may include errors or inaccuracies.
I will not and cannot be held liable for any actions you take as a result of anything you read here.
Conduct your own due diligence, or consult a licensed financial advisor or broker before making any and all investment decisions. Any investments, trades, speculations, or decisions made on the basis of any information found on this channel, expressed or implied herein, are committed at your own risk, financial or otherwise.


