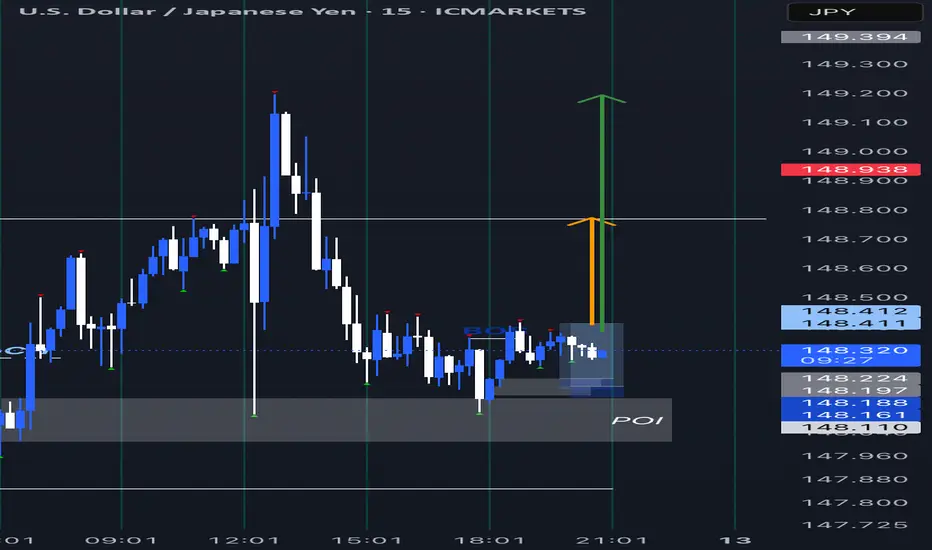
USDJPY Take it or leave itUSDJPY - The price rejected today the last demand zone. Market this week in general until today it was slow. Price is possible to make a good bear move the last two days of the week. Today the news for USD was negative we also have high impact news for USD on 13/03/2025 i am expecting the price continue the bear trend on London session so i can find a good opportunity to sell the pair and wait the news if next news will be negative again we can make a good profit. Good luck on whatever you choose.
USDJPY_LMAX trade ideas

USDJPY TRADE IDEA : LONG | BUY (12/03)Price has been ever so bullish. Taking advantage of that opportunity.
RR: 5
N.B.: This is not financial advice. Trade safely and with caution.
A market reconsidering USD | FX ResearchFinancial markets can't get away from all things trade tariffs, and it's clear the unpredictability has been rattling sentiment. The unpredictability has also been behind a lot of the US dollar selling we've been seeing, particularly against the major currencies now viewed as alternative safe havens amidst the deterioration in confidence in the buck.
Meanwhile, the euro has been shining brightest as it also benefits from the new EU fiscal reform narrative. We have seen some weakness in the yen in recent sessions, presumably on worry over Japan's fate with respect to getting trade exemptions from the US.
Looking ahead, key standouts on Wednesday's calendar come from an ECB Lagarde speech, US inflation data, and the Bank of Canada policy decision.


Falling towards 50% Fibonacci support?USD/JPY is falling towards the support level which is a pullback support that aligns with the 50% Fibonacci retracement and could bunce from this level to our take profit.
Entry: 148.03
Why we like it:
There is a pullback support level that aligns with the 50% Fibonacci retracement.
Stop loss: 149.23
Why we like it:
There is a pullback support level that lines up with he 78.6% Fibonacci retracement.
Take profit: 149.23
Why we like it:
There is a pullback resistance level.
Enjoying your TradingView experience? Review us!
Please be advised that the information presented on TradingView is provided to Vantage (‘Vantage Global Limited’, ‘we’) by a third-party provider (‘Everest Fortune Group’). Please be reminded that you are solely responsible for the trading decisions on your account. There is a very high degree of risk involved in trading. Any information and/or content is intended entirely for research, educational and informational purposes only and does not constitute investment or consultation advice or investment strategy. The information is not tailored to the investment needs of any specific person and therefore does not involve a consideration of any of the investment objectives, financial situation or needs of any viewer that may receive it. Kindly also note that past performance is not a reliable indicator of future results. Actual results may differ materially from those anticipated in forward-looking or past performance statements. We assume no liability as to the accuracy or completeness of any of the information and/or content provided herein and the Company cannot be held responsible for any omission, mistake nor for any loss or damage including without limitation to any loss of profit which may arise from reliance on any information supplied by Everest Fortune Group.

Falling Wedge Breakout in Play? Key Levels to Watch!After analyzing the chart across multiple timeframes, we have identified a Falling Wedge pattern, signaling a potential bullish breakout. Additionally, bullish divergence is visible on most timeframes, reinforcing the likelihood of upward momentum.
Currently, the price is trading above a strong support level at 146.213, indicating a solid base. Our nearest resistance stands at 147.807—a breakout above this level could pave the way for further gains. The next key targets align with the 38.2% and 50% Fibonacci retracement levels, offering potential profit opportunities.
As always, stick to your risk management strategy to protect your capital. Stay disciplined and trade wisely!

USD_JPY LOCAL SHORT|
✅USD_JPY has retested a key resistance level of 149.600
And as the pair is already making a bearish pullback
A move down to retest the demand level below at 147.600 is likely
SHORT🔥
✅Like and subscribe to never miss a new idea!✅

USDJPY INTRADAY Key Trading LevelsThe USD/JPY price action sentiment appears bearish, aligned with the prevailing long-term downtrend. Recent price movements suggest potential for continued downward pressure, with a key resistance level in focus.
Key Levels and Price Action
The critical trading level to watch is 150.60, which marks the current intraday swing high and the falling resistance trendline. A corrective oversold rally towards this level, followed by a bearish rejection, could indicate continued downside momentum. In this scenario, the next downside targets would be 148.75, followed by 147.25 and 146.30 over the longer timeframe.
Alternatively, a confirmed breakout above 150.60, supported by a daily close above this level, would invalidate the bearish outlook. Such a breakout could open the door for further rallies higher, with potential resistance levels at 151.46 and 153.00.
Conclusion
The sentiment remains bearish as long as the 150.60 resistance level holds, with potential downside targets at 148.75, 147.25, and 146.30. A breakout above 150.60 would shift the outlook to bullish, suggesting a move towards 151.46 and 153.00. Traders should carefully monitor price action and daily closes around the 150.60 level to assess any sentiment shifts.
This communication is for informational purposes only and should not be viewed as any form of recommendation as to a particular course of action or as investment advice. It is not intended as an offer or solicitation for the purchase or sale of any financial instrument or as an official confirmation of any transaction. Opinions, estimates and assumptions expressed herein are made as of the date of this communication and are subject to change without notice. This communication has been prepared based upon information, including market prices, data and other information, believed to be reliable; however, Trade Nation does not warrant its completeness or accuracy. All market prices and market data contained in or attached to this communication are indicative and subject to change without notice.

UsdjpyAs we can see usdjpy is on a down trend on a 1 day and 1 week 30 mins and 1hr too we have the market on a down trend so we are selling more

[STRONG BUY SIGNAL] USD/JPY – Inverse Head & Shoulders Setup### 🟢📈 ** USD/JPY – Inverse Head & Shoulders Setup!** 🚀
#### **🔍 Trade Setup Breakdown:**
📌 **Pattern:** Inverse Head & Shoulders (Bullish Reversal)
📍 **Entry Point:** **148.700** ✅ (Breakout Confirmation)
⛔ **Stop-Loss (SL):** **147.000** ❌ (Below Right Shoulder for Protection)
🎯 **Target (TP):** **150.000** 🎯 (Measured Move from Head to Neckline)
📊 **EMA 50 Confirmation:** If price stays **above 50 EMA**, bullish momentum strengthens! 🔼
#### **💰 Risk Management (Trade Smart!)**
⚖️ **Risk per Trade:** **170 pips** (148.700 - 147.000)
💎 **Potential Reward:** **130 pips** (150.000 - 148.700)
📊 **Risk-Reward Ratio (RRR):** **1:1.76** – A well-balanced trade setup! ✅
#### **🎯 Trade Execution Tips:**
✔️ **Wait for a Clean Breakout & Retest** at **148.700** before entering! 🚀
✔️ **Monitor EMA 50** for trend confirmation 📈
✔️ **Stick to Proper Position Sizing** – No Overleveraging! 💰
✔️ **Exit if Price Drops Below 147.000** – Control Your Risk! 🚦
🔥 **This setup indicates a strong bullish reversal! Stay disciplined & trade smart!** 💪💵

Possible Diagonal End Formation?According to Elliott Wave theory, if this is forming a diagonal ending, the price is likely to retest the nearest trendline. Watching for confirmation will be key to identifying the next move. 📉📈

USDJPY MADE FALLING WEDGE PATTERN IN 4-H TA Hello Guys Here Is Chart Of USDJPY in 4-H AT
Entry Level: Buy Around 142.000
Support: lower Low around $140.000
Target Will Be : 154.000
If USDJPY breaks upper resistance level, the wedge pattern is successful,

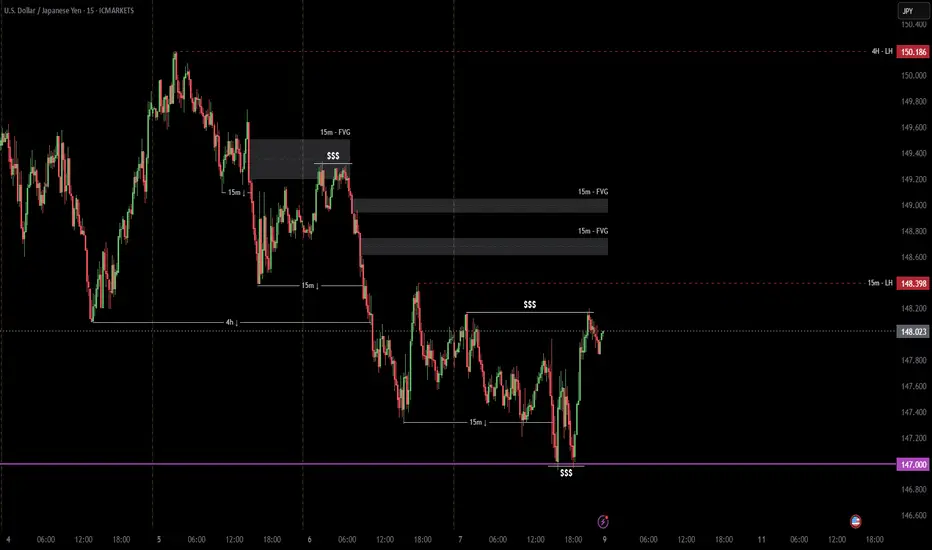
Manipulation followed by a liquidity grab, then a continuation I expect a liquidity grab near the 147 level to trigger a temporary bullish move, aiming to take out the buy-side liquidity above 148.167. The Fair Value Gaps (FVGs) are less likely to play a significant role. Price may then reach around 149.322, and once the buy-side liquidity is taken, the overall bearish trend should resume.

USDJPY My Opinion! BUY!
My dear friends,
Please, find my technical outlook for USDJPY below:
The price is coiling around a solid key level - 147.21
Bias -Bullish
Technical Indicators: Pivot Points Low anticipates a potential price reversal.
Super trend shows a clear buy, giving a perfect indicators' convergence.
Goal - 148.63
About Used Indicators:
The pivot point itself is simply the average of the high, low and closing prices from the previous trading day.
———————————
WISH YOU ALL LUCK

USDJPY ABOUT TO PUSH TO THE UPSIDEas we can see from the analysis USDJPY broke a major zone indicating it's bullish momentum
and this might be a CHoC, meaning uptrend will form
