USDJPY: B+ trade → A if clean reversal bar formsA page from my trading journal. Please take it with a grain of salt, as I’m still learning and growing 🌟
USDJPY_LMAX trade ideas

Trade news gradually improves - Supporting USD to rise again🔔🔔🔔 USD/JPY news:
➡️ The USD/JPY pair extended its gains to approach the 144.00 level early Friday, driven by renewed demand for the U.S. dollar following a Bloomberg report suggesting that China is considering suspending the 125% tariff on certain U.S. imports. The pair largely ignored Tokyo’s hotter-than-expected CPI inflation data.
Personal opinion:
➡️ USD/JPY continues to rise thanks to positive news from the Trump administration’s negotiations with Asian countries. Although good Japanese economic data supports the JPY, the focus is still on the active trade war and it supports the USD
➡️ Analysis based on important resistance - support and Fibonacci levels combined with EMA to come up with a suitable strategy
Personal plan:
🔆Price Zone Setup:
👉Buy USD/JPY 143.00 - 144.40
❌SL: 142.50 | ✅TP: 143.80 - 144.40
FM wishes you a successful trading day 💰💰💰

USDJPY 1 Hour Timeframe Impulsive Upwave, Break of StructureUSDJPY is potentially ready for the long term upwave. In the 1 hour timeframe, the last impulse broke the previous structure. Waiting on the formation of corrective structure before trading the next upwave.

USD/JPY in Free Fall: What’s Behind the Break Below 140?🔍 Technical Analysis – USD/JPY
The weekly chart shows a sharp rejection in the macro zone between 155–158, where strong supply is present (highlighted in red). After brushing historical highs, USD/JPY experienced a vertical drop down to 140, decisively breaking through the key zone at 148–146.
Price has now broken the weekly structure and is approaching an area that previously triggered significant rallies (blue zone between 138–141). Monthly support is in danger, with the RSI deeply in oversold territory, but no clear reversal signals just yet.
📊 COT Report – USD Index
Asset Managers: Slight recovery on long positions, but still in neutral territory.
Leverage Money: Increasing net shorts, indicating speculative bets against the dollar.
The divergence between the falling USD Index and speculative positions confirms a growing lack of confidence in the greenback.
📊 COT Report – JPY Futures
Asset Managers: Strong increase in long positions on the yen since December 2024.
Leverage Money: Reinforcing long bias since February 2025.
This confirms that institutional players are accumulating yen, possibly anticipating BoJ interventions or a broader flight-to-safety.
💥 Trade Outlook
USD/JPY is in full bearish breakout mode. If the 140 level breaks decisively, the next technical targets are:
137.00 → historical mid-level support
134.00 → base of the 2023 structure
Keep an eye on the RSI: a bullish divergence with strong volume could trigger a technical rebound. But as long as the overall sentiment remains strongly risk-off, every rally is a selling opportunity.

USDJPY Hello, traders
Although the main trend remains bearish with targets at 138.70, 136.15, and potentially lower,
a temporary bullish correction is expected.
Short-term bullish targets:
144.76
146.87
With a lower probability:
148.24

The beginning of the carry trade unwind part 2?If we look at the chart, the current structure looks very similar to what happened right before the market decline in August.
We've formed a head and shoulders (albeit not perfect as it's slanted), and price seems to be breaking down.
If price action accelerates to do downside, it's likely to take the market with it just like it did the last time.
Paying attention to this over the coming weeks.

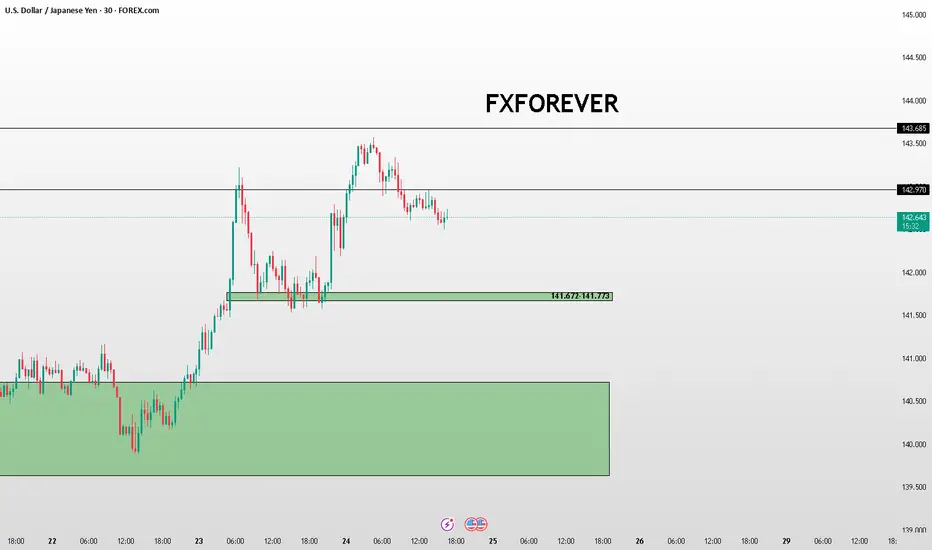
USD/JPY Price Action Update – April 24, 2025📊USD/JPY Price Action Update – April 24, 2025
🔹Current Price: 142.657
🔹Timeframe: 30M
📌Key Resistance Levels:
🔴143.685 – Major Intraday Resistance
🔴142.970 – Minor Structure Resistance (watch for breakout/rejection)
📌Key Demand Zones (Support):
🟢141.672–141.773 – Recent Bullish Breaker Block (potential reaction zone)
🟢139.635–140.722 – Higher Timeframe Demand Zone (strong support and reversal base)
📈Bullish Outlook:
Price is consolidating just below the 142.970 resistance level after a strong bullish rally. A clean breakout above this level could lead to a move toward 143.685. For safer buys, wait for a retest of the 141.672–141.773 zone.
📉Bearish Outlook:
If price rejects from the 142.970 level and breaks below 141.672, expect a deeper correction toward the 139.635–140.722 HTF demand. Monitor for bearish structure shifts or strong rejections near resistance zones.
⚡Trade Setup Tip:
✅Wait for a breakout + retest or confirmation candle
✅Use the 141.672 zone for possible long entries
✅Control risk around key levels with clear invalidation points
#USDJPY #ForexAnalysis #SmartMoneyConcepts #PriceAction #SupplyAndDemand #IntradaySetups #TechnicalAnalysis #FXFOREVER #MarketUpdate #JPY #YenTradeSetup
USDJPY Short Term Buy Trading PlanM15 - Strong bullish momentum followed by a pullback
No opposite signs
Expecting bullish continuation until the two Fibonacci support zones hold.
If you enjoy this idea, don’t forget to LIKE 👍, FOLLOW ✅, SHARE 🙌, and COMMENT ✍! Drop your thoughts and charts below to keep the discussion going. Your support helps keep this content free and reach more people! 🚀
--------------------------------------------------------------------------------------------------------------------
Disclosure: I am part of Trade Nation's Influencer program and receive a monthly fee for using their TradingView charts in my analysis.

JPYUSD - might pull backThis could pull back for a couple of months. Is this move down on JPYUSD gonna fuel rally in Equities? Gold looks like it wants to pull back (may be to 21 EMA or even a deeper correction to $2000/OZ). DXY might have a relief rally or just chop sideways. US10Y could drop to 3.4%. Have to watch SPX, GOLD, GOLD/SPX ratio, BTC/USD, BTC/GLX, US10Y, DXY, JPY/USD and VIX. We have to figure out if the secular bear market is already underway on equities (which means we sell the bounce on equities and buy the dip on GOLD), or if there is more blow off top left in equities. Only time will tell. Massive opportunities ahead either way. So protect your capital

kitty kittykitty kitty moving in good direction, time to find some fare value, $ os looking for some good investors to value it.

Trade Friction and Fed Pressure Lift Japanese YenThe Japanese yen strengthened to approximately 140.5 per dollar on Tuesday, marking its strongest level in seven months, as investors sought safe-haven assets amid heightened global trade tensions and concerns over U.S. economic stability. Market sentiment declined following stalled trade talks, with China resisting President Trump's tariff demands. Confidence further eroded after Trump renewed calls to remove Fed Chair Powell over delayed rate cuts. Attention now turns to the upcoming Bank of Japan meeting, where rates are likely to remain at 0.5%, though the central bank may lower its growth forecast due to mounting external pressures.
Key resistance is at 142.00, with further levels at 144.00 and 145.90. Support stands at 139.70, followed by 137.00 and 135.00.

USDJPY Wave Analysis – 21 April 2025
- USDJPY broke support area
- Likely to fall to support level 139.55
The USDJPY currency pair recently broke the support area at the intersection of the support trendline of the daily down channel from January and the support level 142.00 (which started the daily uptrend in September).
The breakout of this support area should accelerate the active impulse wave 3, which belongs to the intermediate impulse wave (3) from March.
Given the strongly bearish US dollar sentiment, USDJPY currency pair can be expected to fall to the next support level 139.55 (the former multi-month support level from September).

USDJPY | Gaining bullish momentumAfter hitting lower low USDJPY is bouncing back and makinf new higher highs and higher lows,which indicates that it is it is gaining bullish momentum and will soon break its resistance area to mark new highs.Enjoy the ride.

USD/JPY pair may form a short-term BUY trendBased on the analysis, the USD/JPY pair may form a short-term BUY trend. Based on this analysis, we can try to enter a Buy position with a small risk margin.

USDJPY Short Term Buy Trading Plan Update!!!Hi Traders, on April 23rd I shared this idea "USDJPY Short Term Buy Trading Plan"
I expected bullish continuation higher from the marked Fibonacci support zones. You can read the full post using the link above.
Price reached the first Fibonacci support zone, respected it and bounced higher as expected!!!
If you enjoy this idea, don’t forget to LIKE 👍, FOLLOW ✅, SHARE 🙌, and COMMENT ✍! Drop your thoughts and charts below to keep the discussion going. Your support helps keep this content free and reach more people! 🚀
-------------------------------------------------------------------------------------------------------------------
Disclosure: I am part of Trade Nation's Influencer program and receive a monthly fee for using their TradingView charts in my analysis.

Yen extends gains, BOJ Core CPI lower than expectedThe Japanese yen has rallied for a third straight day. In the European session, USD/JPY is trading at 140.38, down 0.33% on the day. The yen has climbed 1.3% since Thursday, as the US dollar is under pressure against the major currencies.
BoJ Core CPI, a key inflation indicator, remained at 2.2% for a third consecutive month in March, shy of the forecast of 2.4%. This follows Japan's National Core CPI, which rose 3.2% y/y, matching expectations but higher than the 3.0% gain in February. National CPI eased to 3.6%, down from 3.7% in February and below the market estimate of 3.7%.
The inflation data comes a week before the BoJ's policy meeting next week. The central bank has signaled that it will continue to raise interest rates as wages and inflation have been rising. However, the risks to inflation and growth from US tariffs have muddied the rate outlook and the BoJ may decide to push off another hike until later in the year.
The finance ministers of Japan and the US will meet later this week, as Tokyo looks to carve out some tariff exemptions. The BoJ is likely to sit tight and see if the talks lead to a breakthrough. The US is expected to bring up the exchange rate, as President Trump has accused Japan of deliberately keeping the yen weak in order to protect its export sector.
There are no key releases out of the US today, but we'll hear from three FOMC members later today. The markets have priced in a rate cut in May at 10%, with a 62% probability of a rate cut in June.

USDJPY Potentially a long opportunity for this pair.
- Hit weekly SR line and rejected and retested it
- as you can see the white arrow path is creating a W pattern potentially giving us insight to a switch in direction and go towards an bullish trend
- high wicks rejecting off the W SR line
- bullish engulfing candle is another confirmation

Fundamental Market Analysis for April 28, 2025 USDJPYUSDJPY:
The Japanese yen (JPY) fluctuated in a narrow range in Monday's Asian session and paused its recent pullback from a multi-month high reached last week against its U.S. counterpart. U.S. Treasury Secretary Scott Bessent did not support President Donald Trump's statement that tariff talks with China are underway. That tempered optimism about a quick resolution to trade tensions between the world's two largest economies and provided some support for the safe-haven yen.
Meanwhile, traders pushed back expectations of an immediate interest rate hike by the Bank of Japan (BoJ) due to rising economic risks from US tariffs. However, signs of rising inflation in Japan leave the door open for further BoJ rate hikes this year, which is a big divergence from bets on more aggressive Federal Reserve (Fed) policy easing. This keeps USD bulls on the defensive and also serves as a tailwind for the low-yielding Yen.
Trading recommendation: SELL 143.20, SL 143.60, TP 142.50

USDJP WEEKLY UPDATESHello folks, if you're following
this idea since, then the higher chances are, you win the trade on my short idea before.
Now I'm expecting lows again, This idea is on weekly gap to be filled.
Chart are on 4HTF. this idea are on weekly.
It might retrace, but the weekly timeframe still on bearish.+
This is not a financial advice, follow for more.

USDJPY sell setup H4Hello! Friends,
Greetings. Please leave a Like if you like the idea.
Before start talking about technical Let's share your LOVE by giving me LIKES to support this work. Thanks in advance.

Japanese Yen seems poised to appreciate further against weaker UFrom a technical perspective, the daily Relative Strength Index (RSI) is already flashing slightly oversold conditions and warrants some caution for bearish traders. Hence, it will be prudent to wait for some near-term consolidation or a modest bounce before positioning for an extension of the USD/JPY pair's well-established downtrend witnessed over the past three months or so.
In the meantime, attempted recovery might now confront some resistance near the 141.60-141.65 region. This is followed by the 142.00 round figure and the 142.40-142.45 hurdle, above which a fresh bout of a short-covering move could lift the USD/JPY pair to the 143.00 mark en route to the 143.25-143.30 zone. Any further move up, however, might still be seen as a selling opportunity.
On the flip side, a sustained break and acceptance below the 141.00 mark could be seen as a fresh trigger for bearish traders and makes the USD/JPY pair vulnerable. The subsequent downfall below the 140.45-140.40 intermediate support might expose the 140.00 psychological mark. The downward trajectory could extend to the 2024 yearly swing low, around the 139.60-139.55 region.

USD/JPY: Bearish Trend Remains StrongUSD/JPY: Bearish Trend Remains Strong
In our previous analysis, USD/JPY tested the resistance zone and responded as expected. The market is still uncertain regarding Trump's tariff policies, but as long as the price respects the 144.40 resistance level, the downward trend is likely to continue.
It may take time, but based on current data, the direction remains bearish. Potential targets for further declines are 142.00, 140.00, and 138.00.
You may find more details in the chart!
Thank you and Good Luck!
❤️PS: Please support with a like or comment if you find this analysis useful for your trading day❤️
Disclosure: I am part of Trade Nation's Influencer program and receive a monthly fee for using their TradingView charts in my analysis.

headed towards 140s. but we might reverse before going fully Shows a bearish setup for USD/JPY on the 1-hour timeframe.
We might reverse before going fully 140s, so thats why i think this is a little short settup.
