USD/JPY) demand and supply analysis ); Read The ChaptianSMC Trading point update
shows a bearish setup for USD/JPY on the 1-hour timeframe. Here’s a breakdown
---
1. Trend Context:
Downtrend: The pair is clearly in a bearish channel, forming lower highs and lower lows.
200 EMA (~146.297) is above price and sloping down — confirms bearish bias.
---
2. Key Zones Identified:
Supply Zone (~144.800–145.200): A strong area of resistance where sellers may re-enter. If price returns here, it’s a potential short setup.
Demand Zone (~142.800–143.100): A possible reaction point where short-term buyers may provide a bounce.
Target Point (~141.168): A projected target if the downtrend continues and demand zone fails.
---
3. Expected Scenarios:
Primary Bearish Move:
Price may react from current levels or from the demand zone.
A pullback to the supply zone is expected before continuation downward.
Then, sell-off toward the target zone around 141.168.
Alternate Play:
Price could bounce between the demand and supply zones a bit more before breaking down.
---
4. Indicators:
RSI (~46.37): Shows room to the downside before oversold, aligning with bearish momentum.
Mild bullish divergence in RSI recently, suggesting potential for a small pullback or bounce.
Mr SMC Trading point
---
Summary of Idea:
This is a sell setup:
Sell entries: Ideal around the supply zone (144.8–145.2).
First target: Demand zone (~143.0)
Final target: 141.168
Invalidation: Break above 146.30 (200 EMA and channel resistance).
pales support boost 🚀 analysis follow,)
USDJPY_LMAX trade ideas

USDJPYbuying USDJPY
sl 142.452
tp 143.907
1% risk on each trade
like an follow me for more
long on USD/JPY

Bearish Momentum Eases at 141.70 Support in USD/JPYFenzoFx—The USD/JPY currency pair resumed its bearish trend after breaking below 144.56 but steadied at the 141.70 support level. Indicators show sideways movement, reflecting a lack of momentum.
With the price below the 50-period moving average, the bearish outlook persists. If the pair stabilizes below 141.70, the downtrend may deepen, while surpassing 144.56 could pave the way for a rise toward 148.20.
>>> No Deposit Bonus
>>> %100 Deposit Bonus
>>> Forex Analysis Contest
All at F enzo F x Decentralized Forex Broker

USDJPY BUY ANALYSIS SMART MONEY CONCEPT Here on Usdjpy price form a demand around level of 142.330 and is likely to continue going up so trader should go for long with expect profit target of 144.628 and 146.947 . Use money management

USDJPY 15mintue ForecastHello guys I hope you are all well Let me tell you that our target right now is the order block bearish, from where we will get a strong sell position, where we can take good profit, and there is a strong sell position, where our target will be the support area.

USDJPY: patience is key. 2 high-probability setupsThat lowest low says a lot of things. I think price would respect it. but the sell trend is too strong. I'm open for 2 setups now.
Bearish drop?USD/JPY has rejected off the resistance level which is a pullback resistance and could drop from this level to our take profit.
Entry: 142.87
Why we like it:
There is a pullback resistance level.
Stop loss: 143.69
Why we like it:
There is a pullback resistance level that is slightly above the 23.6% Fibonacci retracement.
Take profit: 141.48
Why we like it:
There is a support level at the 78.6% Fibonacci projection.
Enjoying your TradingView experience? Review us!
Please be advised that the information presented on TradingView is provided to Vantage (‘Vantage Global Limited’, ‘we’) by a third-party provider (‘Everest Fortune Group’). Please be reminded that you are solely responsible for the trading decisions on your account. There is a very high degree of risk involved in trading. Any information and/or content is intended entirely for research, educational and informational purposes only and does not constitute investment or consultation advice or investment strategy. The information is not tailored to the investment needs of any specific person and therefore does not involve a consideration of any of the investment objectives, financial situation or needs of any viewer that may receive it. Kindly also note that past performance is not a reliable indicator of future results. Actual results may differ materially from those anticipated in forward-looking or past performance statements. We assume no liability as to the accuracy or completeness of any of the information and/or content provided herein and the Company cannot be held responsible for any omission, mistake nor for any loss or damage including without limitation to any loss of profit which may arise from reliance on any information supplied by Everest Fortune Group.

USD/JPY: Buy Opportunity from Key Demand ZoneWelcome back! Let me know your thoughts in the comments!
** USDJPY Analysis !
We recommend that you keep this pair on your watchlist and enter when the entry criteria of your strategy is met.
Please support this idea with a LIKE and COMMENT if you find it useful and Click "Follow" on our profile if you'd like these trade ideas delivered straight to your email in the future.
Thanks for your continued support! Welcome back! Let me know your thoughts in the comments!

USDJPY Wave Analysis – 15 April 2025
- USDJPY reversed from long-term support level 142.00
- Likely to rise to the resistance level 144.65
USDJPY currency pair recently reversed up from the support zone between the long-term support level 142.00 (which has been reversing the price from the end of 2023), support trendline of the weekly down-channel from January and the lower weekly Bollinger Band.
The upward reversal from this support zone stopped the previous intermediate impulse wave (3) from last month.
Given the strength of the support level 142.00 and the oversold weekly Stochastic, USDJPY currency pair can be expected to rise to the next resistance level 144.65.

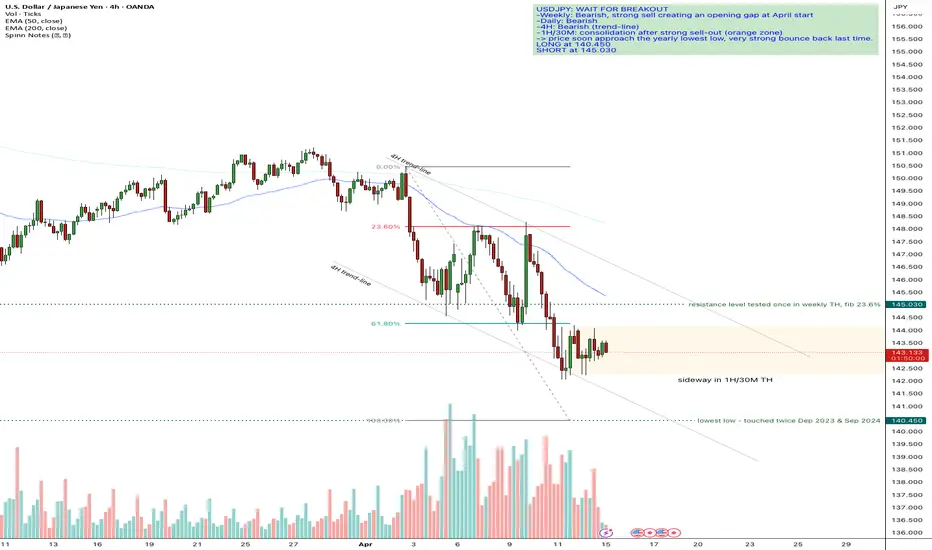
USDJPY LONG FORECAST Q2 W16 D18 Y25USDJPY LONG FORECAST Q2 W16 D18 Y25
Fun Coupon Friday
SUMMARY
- Trading in the absolute Depths of the ocean, anticipating orders are being created for price to take an explosive breath. IMO!
- Weekly order block breached, YES.
- Weekly order block still valid due to no clear close below- Long positions only.
- A setup for break and close above key 15' structure point of interest creating higher high.
- B setup to await for lower time frame break of structure.
FRGNT X

USDJPY Will Explode! BUY!
My dear followers,
This is my opinion on the USDJPY next move:
The asset is approaching an important pivot point 142.79
Bias - Bullish
Technical Indicators: Supper Trend generates a clear long signal while Pivot Point HL is currently determining the overall Bullish trend of the market.
Goal - 143.26
About Used Indicators:
For more efficient signals, super-trend is used in combination with other indicators like Pivot Points.
Disclosure: I am part of Trade Nation's Influencer program and receive a monthly fee for using their TradingView charts in my analysis.
———————————
WISH YOU ALL LUCK

Fundamental Market Analysis for April 18, 2025 USDJPYThe USD/JPY pair is down to 142.25 in thin trading session on Friday. The US Dollar (USD) is declining against the Japanese Yen (JPY) amid concerns over the economic impact of tariffs.
Data released by the Statistics Bureau of Japan on Friday showed that the national consumer price index (CPI) rose 3.6% in March, up from the previous reading of 3.7%. Meanwhile, the national CPI excluding fresh food was 3.2% y/y in March, up from 3.0% previously. The reading was in line with the market consensus.
Finally, the consumer price index excluding fresh food and energy rose 2.9% y/y in March vs. the previous reading of 2.6%. The Japanese Yen remains strong against the US Dollar as an immediate reaction to Japanese inflation data.
However, JPY gains may be limited as Bank of Japan (BoJ) officials signalled a pause in the consideration of interest rate hikes, emphasising the need to monitor uncertainty heightened by US tariff measures.
Economic data from the US on Thursday was mixed. US initial jobless claims fell to their lowest level in two months, signalling a stable labour market. In addition, the Philadelphia Fed index fell short of expectations, a warning shot from the manufacturing sector.
Trade recommendation: SELL 142.05, SL 143.40, TP 139.80
USDJPY Buy Trade Setup – 4H TimeframeI have taken a buy position on USDJPY based on a confluence of technical factors supporting a bullish bias:
🔹 Key Weekly Support Zone: Price recently bounced from a strong weekly support level, which has held well in the past, indicating buyers' interest.
🔹 Bullish Daily Candle: On the daily timeframe, a strong bullish candlestick closed above the support level, signaling a potential trend reversal or short-term upside move.
🔹 Trendline Support: On the 4H chart, price is respecting a clear ascending trendline, acting as dynamic support.
🔹 RSI Indicator: RSI is recovering from the oversold zone and showing signs of bullish momentum buildup, supporting a possible upward move.
🔹 200 EMA (Resistance): While the price is still trading below the 200 EMA, this trade targets a move toward that level as the next potential resistance.
🎯 Entry: Near 143.00
🛑 Stop Loss: Below 142.20 (just under recent wick lows)
✅ Take Profit: Around 144.80 (just before the 200 EMA)
Risk-to-reward ratio is favorable, and this setup aligns with higher-timeframe support and confirmation from bullish price action.

USDJPYUsdjpy has been in a bearish trend, currently reacting off decisional orderblock, with not just a 15min ichoch but also a 1hr ichoch, I have set a sell limit order, let’s see how this goes

USD/JPY Technical and Fundamental Analysis – April 2025Technical Analysis
The USD/JPY monthly chart reveals a strong bullish breakout from a long-standing consolidation zone, defined as the Long-Term Support Region (circa 101.00–122.00). This breakout confirms a major structural shift, where prior resistance has turned into support, signaling the potential for sustained upside momentum.
Upward Price Break: The breakout is clean and supported by significant volume, suggesting institutional participation. The price broke out of the multi-year range and retested the breakout level, respecting it with a strong bullish impulse.
Higher Highs and Higher Lows Channel: Post-breakout, the pair has entered a rising price channel with clearly defined higher highs and higher lows—an essential indicator of bullish market structure. The pair remains well-supported within this upward sloping channel.
Projected Upside: A measured move target (based on the channel and Fibonacci projections) suggests the next key resistance lies around 165.67, offering a 16.72% potential gain from the breakout zone.
Downside Risk: The nearest support lies at 141.94–142.56. A break below this would challenge the structure, but only a drop beneath 136.06 (channel and prior structure support) would invalidate the bullish outlook.
Technically, the pair is in a medium-to-long-term bullish trend. Traders should consider long setups on pullbacks towards support zones unless key structural levels are broken.
Fundamental Analysis
The current macroeconomic landscape provides a mixed but slightly USD-supportive narrative, which aligns well with the bullish technical chart.
Supportive Factors for USD
Hawkish Fed: Fed Chair Jerome Powell signaled that interest rate cuts are off the table for now, citing sticky inflation. The upbeat US Retail Sales report (+1.4% in March) further strengthens the USD by highlighting ongoing consumer strength.
Geopolitical Risks: The escalating US-China trade war and the imposition of tariffs on AI chips are boosting demand for USD as a global reserve currency.
JPY-Supportive Factors (Limiting USD/JPY Gains)
BoJ Rate Hike Prospects: Despite some dovish commentary, the BoJ is still expected to raise interest rates in 2025, which should provide medium-term support for the yen.
US-Japan Trade Optimism: Positive trade negotiations between the US and Japan (with a second meeting planned within a 90-day window) could further strengthen the yen if an agreement is reached.
BoJ Concerns on US Tariffs: Governor Ueda hinted that Japan may take policy action if US tariffs hurt their economy. However, the BoJ is also expected to cut its growth forecast, which limits the yen’s upside strength.
Risk Sentiment: Despite recent global jitters, equity markets in Asia and the US are rebounding, slightly reducing the safe-haven demand for JPY.

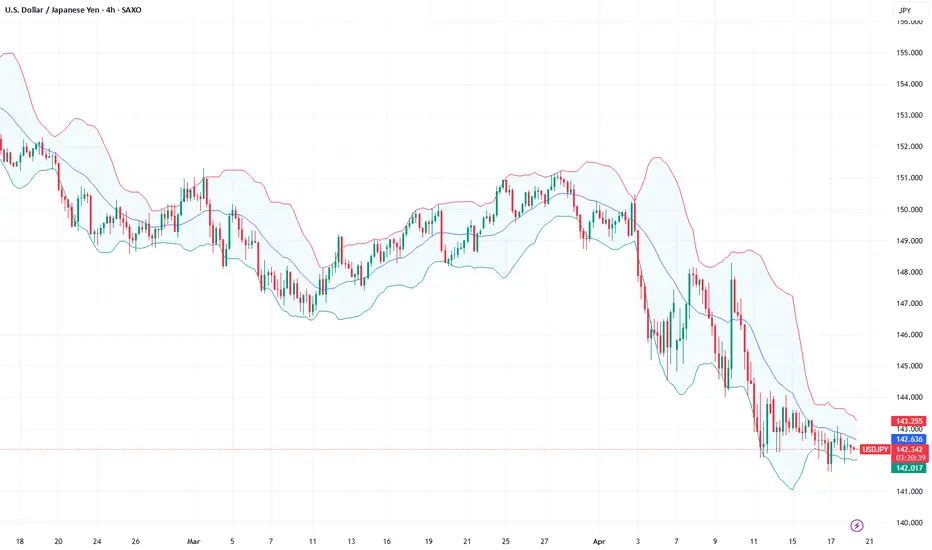
Usdjpy buy 142.52Usdjpy declined below bottom Bolinger band on 4hr . And walking Bolinger down for past couple days. Yesterday it broke up and now resistance becomes support.
Buy on retest of the bottom Bolinger from the top and see if buying will push price to test blue resistance SCD band on 4 hr around 143.50.
If price manages to close below Bolinger again I will stop out.

[_] ONENTRYUSD/JPY - ‘2FIB Strategy’ by ONENTRY
Timeframe: 30 Minutes
Session: London & New York
### **Step 1: Identify the Overnight Range**
- Mark the **high** and **low** of the price range between **00:00 - 06:30 (+2GMT)**.
- Wait for a **clear breakout** with a candle *closing* above (for longs) or below (for shorts) this range.
- Wait for at least one reversal candle.
Step 2: Apply Fibonacci Levels**
- After the breakout, use the **Fibonacci retracement tool**:
- **Anchor Point 1:** Start at the *close* of the last impulse candle wick.
- **Anchor Point 2:** Drag to the *start* of the impulse move - first candle wick of the range.
- Key level for entry: **0.5 and** **0.35 retracement Step 3: Trade Execution**
- **Entry:** Enter on a pullback to **0.5** and **0.35 Fib level** after the breakout.
- **Stop Loss :**
- *Long trades:* Below the **low of the breakout candle wick.**
- *Short trades:* Above the **high of the breakout candle wick.**
- **Take Profit Targets:**
- **TP1:** 1.0 Fib
- **TP2:** 1.25 Fib extension.
- TP3: 1.6 FIB extension
- **TP4:** 2.3 Fib extension (runner position).
### **Step 4: Trade Management**
- Move SL to breakeven when price hits **TP1**.
- Close the running trade before midnight.
Always Test The Strategy

Safe-haven currencies gain in uncertain trade landscapeFinancial markets continue to navigate a complex landscape shaped by evolving U.S. trade policies and global economic dynamics. U.S. dollar weakness is at the centre of attention as investors reconsider the greenback’s safe haven status in a world of trade wars.
There has been some relief on the tariff front—at least for now—allowing U.S. and global equities to recover in recent sessions. The Swiss franc and euro have gained significant ground as safe haven flows bolster confidence, while the pound has remained resilient, supported by solid UK economic data and expectations for a more stable Bank of England policy outlook.
In Asia, the yen continues to attract bids, reflecting Japan’s firm stance in upcoming trade talks with the U.S. Overall, markets remain cautiously optimistic, balancing hopes for trade de-escalation against persistent uncertainty from erratic U.S. policy moves.
Looking ahead, key calendar standouts include German wholesale prices, UK employment data, Eurozone industrial production, German and Eurozone ZEW sentiment readings, Canadian inflation, U.S. import and export prices, Empire manufacturing, and various Fed speeches.
Exclusive FX research from LMAX Group Market Strategist, Joel Kruger

USDJPY Analysis — Bullish Setup in Progress
🧠:
During the current Asian session, I expect the market to **grab some liquidity** below recent lows before initiating a bullish move.
From a broader perspective, USDJPY is setting up for a **bullish continuation** over the next few days. My directional bias is supported by a combination of key factors:
🔍 **Key Elements of This Analysis:**
- **Market Structure:** The current downtrend has started to show signs of exhaustion, and a **change of character (CHOCH)** has been observed in lower timeframes.
- **Fair Value Gaps (FVG):** Price is consolidating around a clear imbalance zone. A pullback into this FVG is expected to act as a springboard for the next bullish leg.
- **Liquidity Sweep:** The market is likely to sweep lows for liquidity before pushing higher, aligning with typical behavior during the **Asian range**.
- **Trend Context:** The higher timeframe structure still favors a bullish retracement or reversal, especially if price holds above the lower key level at **141.75–141.67**.
---
🎯 **Key Levels:**
- **Liquidity Zone:** 142.09 – 141.67
- **Bullish Target Zones:**
- TP1: 144.15
- TP2: 147.38
- Final target: 149.08
🛡️ Risk Management
My stop is placed below the identified liquidity zone, maintaining a clean **risk-to-reward structure** that aligns with my daily bias.
This trade idea aligns with my daily execution model combining **trend, liquidity, FVG zones**, and **CHOCH** confirmation. As always, manage risk and stay sharp.
— Emerson Massawe

USD/JPY@14.862 BUY SETUP 4h chart analysisHere’s a detailed breakdown of your USD/JPY trade setup based on the latest chart:
---
Chart Analysis (3H Timeframe)
Trend Context:
Prior downtrend with multiple breaks of structure (BOS) and continuation of lower highs/lows.
Recent liquidity sweep + double bottom near 140.518, indicating a potential reversal.
First bullish move breaking structure hints at buyers stepping in.
---
Trade Details:
Entry Point: 142.862 (as marked on the chart)
Stop Loss (SL): 140.518 (below double bottom and liquidity sweep)
Take Profit 1 (TP1): 146.000 (mid-range resistance before 200 EMA & supply zone)
Final Target: 150.014 (top of green box, historical supply area)
---
Support & Resistance Zones:
Support Zones:
1. 140.518 – Strong support (double bottom + liquidity grab zone)
2. 142.000–142.500 – Recent minor support after break and retest
3. 143.300–143.500 – Flip zone, previously support turned resistance
Please hit the like button and
Leave a comment to support for My Post!
Your likes and comments are incredibly motivating and will encourage me to share more analysis with you.
Best Regards, JAMES_GOLD_MASTER_MQL5
Thank you.
Resistance Zones:
1. 146.000 – First real resistance, aligns with 200 EMA
2. 147.300–147.800 – Prior supply zone / consolidation zone
3. 150.014–149.000 – Final target zone, strong resistance and historical supply
---
Additional Observations:
EMA 200 is sloping down; price might react near it before continuing up.
Risk-Reward looks to be around 1:3+, making this a high-probability trade if structure holds.
Potential breaker block or order block just above current price might offer re-entry if it pulls back.

Short USDJPYEcon factors: Fed to lower interest rates, weakening USD
Weekly: Downtrend
Daily Factor: LHs, LLs
Hourly: Identify a place where liquidity is strong to go short.

After completing the triangle patternFX:USDJPY After completing the triangle pattern and achieving its targets, we wait for the key level to break at the fourth wave and for the completion of the first impulsive wave.

USDJPY M15 | Bullish Bounce Based on the M15 chart analysis, the price is falling toward our buy entry level at 142.16, a pullback support that aligns with the 61.8% Fibonacci retracement.
Our take profit is set at 143.55, a swing high resistance.
The stop loss is placed at 141.62, a swing low support.
High Risk Investment Warning
Trading Forex/CFDs on margin carries a high level of risk and may not be suitable for all investors. Leverage can work against you.
Stratos Markets Limited (tradu.com):
CFDs are complex instruments and come with a high risk of losing money rapidly due to leverage. 63% of retail investor accounts lose money when trading CFDs with this provider. You should consider whether you understand how CFDs work and whether you can afford to take the high risk of losing your money.
Stratos Europe Ltd (tradu.com):
CFDs are complex instruments and come with a high risk of losing money rapidly due to leverage. 63% of retail investor accounts lose money when trading CFDs with this provider. You should consider whether you understand how CFDs work and whether you can afford to take the high risk of losing your money.
Stratos Global LLC (tradu.com):
Losses can exceed deposits.
Please be advised that the information presented on TradingView is provided to Tradu (‘Company’, ‘we’) by a third-party provider (‘TFA Global Pte Ltd’). Please be reminded that you are solely responsible for the trading decisions on your account. There is a very high degree of risk involved in trading. Any information and/or content is intended entirely for research, educational and informational purposes only and does not constitute investment or consultation advice or investment strategy. The information is not tailored to the investment needs of any specific person and therefore does not involve a consideration of any of the investment objectives, financial situation or needs of any viewer that may receive it. Kindly also note that past performance is not a reliable indicator of future results. Actual results may differ materially from those anticipated in forward-looking or past performance statements. We assume no liability as to the accuracy or completeness of any of the information and/or content provided herein and the Company cannot be held responsible for any omission, mistake nor for any loss or damage including without limitation to any loss of profit which may arise from reliance on any information supplied by TFA Global Pte Ltd.
The speaker(s) is neither an employee, agent nor representative of Tradu and is therefore acting independently. The opinions given are their own, constitute general market commentary, and do not constitute the opinion or advice of Tradu or any form of personal or investment advice. Tradu neither endorses nor guarantees offerings of third-party speakers, nor is Tradu responsible for the content, veracity or opinions of third-party speakers, presenters or participants.
