Bullish bounce?USD/ZAR is falling towards the pivot and could bounce to the 1st resistance.
Pivot: 18.42633
1st Support: 18.12402
1st Resistance: 18.77859
Risk Warning:
Trading Forex and CFDs carries a high level of risk to your capital and you should only trade with money you can afford to lose. Trading Forex and CFDs may not be suitable for all investors, so please ensure that you fully understand the risks involved and seek independent advice if necessary.
Disclaimer:
The above opinions given constitute general market commentary, and do not constitute the opinion or advice of IC Markets or any form of personal or investment advice.
Any opinions, news, research, analyses, prices, other information, or links to third-party sites contained on this website are provided on an "as-is" basis, are intended only to be informative, is not an advice nor a recommendation, nor research, or a record of our trading prices, or an offer of, or solicitation for a transaction in any financial instrument and thus should not be treated as such. The information provided does not involve any specific investment objectives, financial situation and needs of any specific person who may receive it. Please be aware, that past performance is not a reliable indicator of future performance and/or results. Past Performance or Forward-looking scenarios based upon the reasonable beliefs of the third-party provider are not a guarantee of future performance. Actual results may differ materially from those anticipated in forward-looking or past performance statements. IC Markets makes no representation or warranty and assumes no liability as to the accuracy or completeness of the information provided, nor any loss arising from any investment based on a recommendation, forecast or any information supplied by any third-party.
USDZAR trade ideas


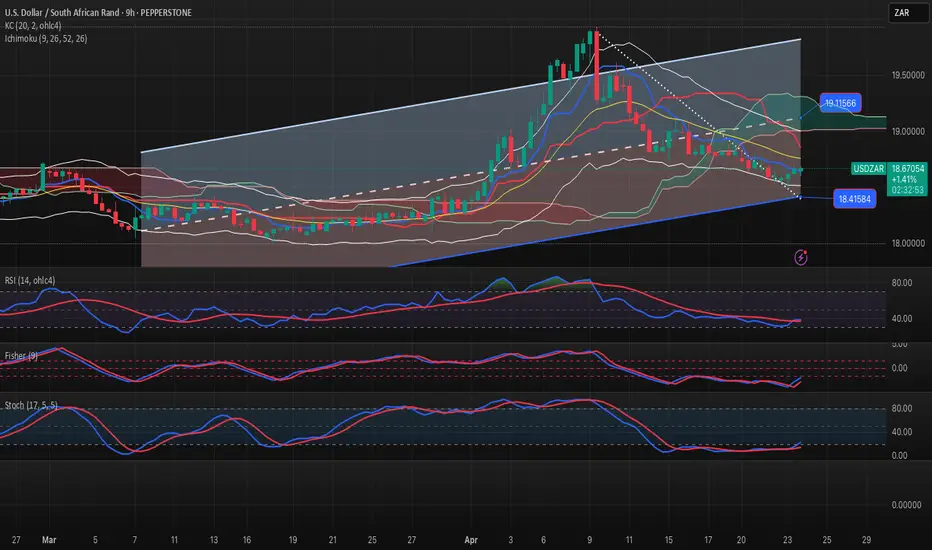
USDZAR-BUY strategy 9 hourly chart - Regression channelThe pair has moved a little lower yesterday, and has returned above 18.60s.
The pressure is slightly upwards, but its not completely confirmed, since we have are moving slowly and not a solid move so far.
Strategy BUY @ 18.6150-18.6550 and take profit near 18.8850 for now.
USDZAR Potential to 18.000 SHORTPrice below potential free range zone a indicated by chart
currently in the Trade will hold and wait

USDZAR-NEUTRAL BUY 90 Minute GANNIt feels we may be moving little higher. The volatility is low, making it more difficult to get the direction. However, stochastic is low and may turn, and for the rest slight pressure is seen.
Strategy BUY (if wished for) @ 18.6750-18.7250 and take profit near 18.8750 for now.

USDZAR-BUY strategy 9 horuly chart Regression channelThe pair has reached my preferred BUYING level and I feel due to USDX oversold status and also extremely overbought GOLD, this pair should benefit upwards strongly over time.
Strategy BUY @ 18.6150-18.6650 and take profit near 18.9575 for now.

USDZAR LONGLong Position.
Based on the uptrend that has been there, and the chart patterns, confirmed by H4 Candles today, and the correlation with GBPUSD, there is a potential long.
Scaling in as we observe is my strategy on this one.

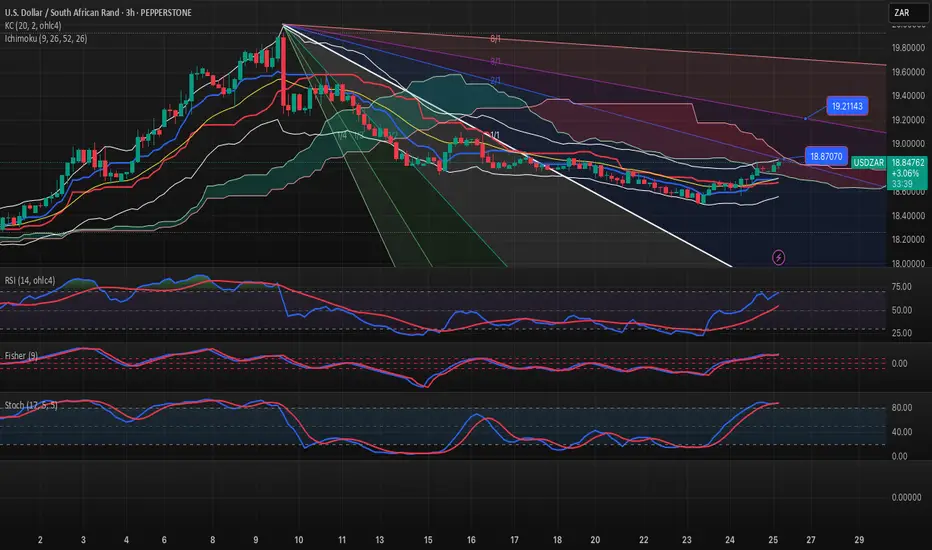
USDZAR-NEUTRAL SELL strategy 3 hourly chart GANNwe have moved higher from where I felt it would, and now we are starting to be overbought slightly. One should be careful as the pressure it still upwards, but SELL is the better way now, I feel.
Strategy SELL @ 18.8650 - 18.9150 and take profit near 18.6150-18.6350 area.
Bullish bounce?USD/ZAR is reacting off the pivot and could bounce to the 1st resistance.
Pivot: 18.71637
1st Support: 18.44436
1st Resistance: 19.07855
Risk Warning:
Trading Forex and CFDs carries a high level of risk to your capital and you should only trade with money you can afford to lose. Trading Forex and CFDs may not be suitable for all investors, so please ensure that you fully understand the risks involved and seek independent advice if necessary.
Disclaimer:
The above opinions given constitute general market commentary, and do not constitute the opinion or advice of IC Markets or any form of personal or investment advice.
Any opinions, news, research, analyses, prices, other information, or links to third-party sites contained on this website are provided on an "as-is" basis, are intended only to be informative, is not an advice nor a recommendation, nor research, or a record of our trading prices, or an offer of, or solicitation for a transaction in any financial instrument and thus should not be treated as such. The information provided does not involve any specific investment objectives, financial situation and needs of any specific person who may receive it. Please be aware, that past performance is not a reliable indicator of future performance and/or results. Past Performance or Forward-looking scenarios based upon the reasonable beliefs of the third-party provider are not a guarantee of future performance. Actual results may differ materially from those anticipated in forward-looking or past performance statements. IC Markets makes no representation or warranty and assumes no liability as to the accuracy or completeness of the information provided, nor any loss arising from any investment based on a recommendation, forecast or any information supplied by any third-party.

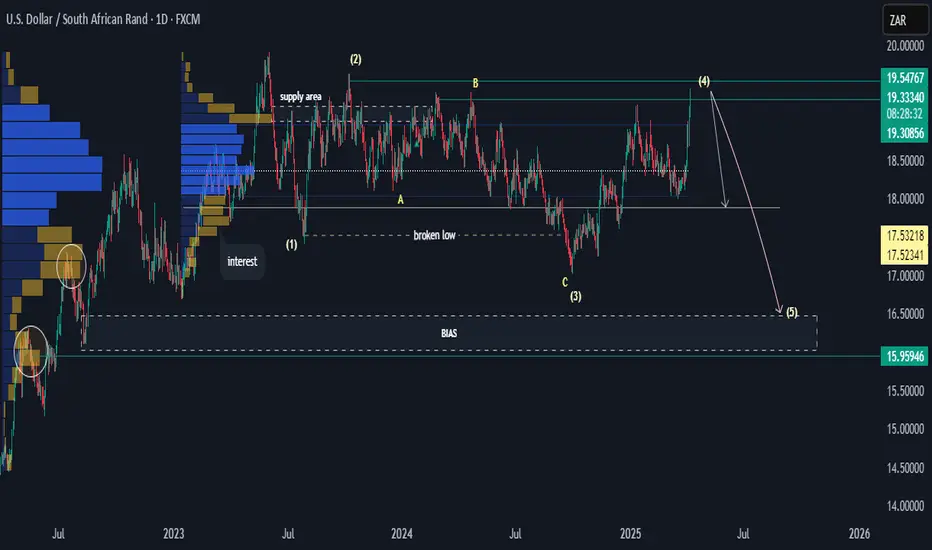
Is the USDZAR About to Crash? Elliott Wave Says Yes Technical Analysis (Elliott Wave View):
🌀 Wave Structure Overview (Elliott Wave):
Wave (1): Sharp rally up to 2008 (Global Financial Crisis peak).
Wave (2): Deep corrective wave ending around 2011.
Wave (3): Strongest and longest wave, peaking around 2016 (a textbook impulsive 3rd wave).
Wave (4): Sideways-to-down correction, consolidating the gains of Wave (3), ending 2018.
Wave (5): Final push higher, peaking around 2023–2024.
🧠 Note: Wave (5) looks like it may be ending or already ended, indicating a major corrective phase is due.
📉 Projected Correction:
The projected arrow suggests a retracement down to the 11.50 – 13.00 ZAR zone.
This level aligns with:
Previous Wave (1) top (2008),
Wave (4) low (2018),
Strong monthly demand zone (grey box).
💡 This supports the idea of a full cycle correction — possibly a Wave A-B-C retracement on a higher time frame.
🌍 Fundamental + Macro Drivers to Watch:
🇺🇸 U.S. Factors:
Interest rate cycle: If the Fed starts cutting rates post-2024, USD weakness can contribute to this bearish outlook.
Election year: Political uncertainty or a shift in administration could trigger capital flow changes.
🇿🇦 South African Factors:
BRICS expansion and de-dollarization: If BRICS continues pushing for reduced USD reliance, it might support ZAR strength long-term.
Commodity cycle: As a resource-rich economy, a commodities boom (e.g. gold, platinum) could strengthen ZAR.
Policy and infrastructure improvements in South Africa could also boost investor confidence and foreign inflows.
📊 Conclusion:
This is a major long-term top formation on USDZAR with:
Clear 5-wave completion,
Room for a deep correction (potentially 30–35% downside from current levels),
Strong technical confluence at the 11.50–13.00 range,
Fundamentals that could support ZAR strength over the next few years.

USD/ZAR Bullish Structure Holds, Waiting for PullbackUSD/ZAR is currently trading at 18.80, having recently rejected the key resistance level near 19.00, which has acted as a historical ceiling multiple times. Despite the rejection, the pair maintains a clear bullish structure and continues to trade above the Ichimoku cloud (Span A at 18.86 and Span B at 18.48), confirming the dominant upward trend.
The Trend Strength Index (TSI) shows:
TSI(10): 0.64 (approaching overbought)
TSI(20): 0.37
This suggests strong upward momentum in the medium term, though a temporary pullback is expected as short-term momentum cools.
The optimal scenario is a retracement toward the support zone between 17.59 and 16.68, where we could see a new TSI oversold signal, similar to previous bullish continuation setups. This would offer a high-probability entry aligned with the trend, targeting a move back toward the 19.91 swing high, or even further to 21.80, as suggested by the projected extension.
If price breaks below 16.68, the bullish structure would be invalidated, and the setup would no longer be valid.
Trade Setup Summary:
Buy Zone: 17.59 – 16.68 (support area)
Target: 19.91 (resistance)
Stop Loss: Below 16.68
Bias: Bullish while above 16.68
TSI Confirmation: Look for oversold reading at support for ideal entry
The US dollar remains firm on the back of relatively strong macroeconomic data and persistent inflation concerns, keeping rate cut expectations limited. In contrast, the South African rand is under pressure due to political uncertainty, slow growth, and structural fiscal issues. These macro conditions support continued USD strength over ZAR, aligning with the current technical uptrend. Any global risk-off move could further weaken the rand and accelerate bullish continuation on USD/ZAR.
Disclaimer: This content is for educational and informational purposes only. It does not represent financial advice or a recommendation to buy or sell any financial instrument. Trading involves risk, and you should only trade with money you can afford to lose.


USDZAR-NEUTRAL SELL strategy 6 hourly Regression channelThe pair has drifted lower as expected, but the volatility is low, hence we should not expect a very strong continuation of the move lower. Further, GOLD is overbought, and the pair could spike back easily when this correction commences.
Strategy SELL @ 18.7750-18.8150 and take profit near 18.5575 for now.

USDZAR Bearish Optimism.Hi there,
On USDZAR, it seems that we don't have much upward momentum left, do we? The price has reached the highs of the 19.31-19.55 area, and we might see a decline that could potentially mark the end of wave 4.
The Wave 5 is a bit tricky there; it may fall to the 18 area, which is a zone of interest, or it could potentially drop further down to 16.5.
Although prices may drop to 15.960 from the high of 17.174, my bias is in favour of 16.5, with two price targets at 18.5 and 18.0.
Happy trading and have a great week.
K.
Not trading advice.
USDZAR-BUY strategy 6 horuly chart GANN The pair has been undergoing some downward pressures, but my overall indicators seems still showing upside potential. I would be careful below 18.7500 though, as this may fill the gap 18.6000 and low again.
Strategy is for now BUY @ 18.8250 - 18.8650 and take profit near 19.0450. I am not committed, except the run upwards before.

USDZAR-NEUTRAL SELL strategy 9-hourly chart - GANNThe pair has not moved higher from mid 18.80s and we are near a strong bottom, which is also a neckline for much lower lower levels, when broken.
For now am considering SELL @ 18.7900-18.8400 and take profit near 18.5350 for now.

USDZAR-SELL strategy 12-hourly The pair does show longer-term the possibility of moving towards 17.75 based on the s/h/s pattern we have. The key is the neckline, and as long we remain above this level, we still can have another go higher before lower again.
Strategy SELL between 18.8200 - 19.0000 and take profit near 17.9350 for now.

USDZAR-BUY strategy 6 hourly chart Regression channelThe pair is in an complex frame, whereby part is move lower longer term, but shorter time frame it is buoyant in character. We should see higher levels near 19.4500 again I feel.
Strategy BUY @ 18.9575 - 19.0200 range and take profit near resistance 19.3300.

USDZAR | 15.04.2025BUY 18.8200 | STOP 18.6400 | TAKE 19.0600 | The price has approached an important support level and is consolidating. today we expect a slight rise to the level of 19.0600.

Bullish bounce?USD/ZAR is falling towards the pivot and could bounce to the 1st resistance.
Pivot: 18.71637
1st Support: 18.44436
1st Resistance: 19.26038
Risk Warning:
Trading Forex and CFDs carries a high level of risk to your capital and you should only trade with money you can afford to lose. Trading Forex and CFDs may not be suitable for all investors, so please ensure that you fully understand the risks involved and seek independent advice if necessary.
Disclaimer:
The above opinions given constitute general market commentary, and do not constitute the opinion or advice of IC Markets or any form of personal or investment advice.
Any opinions, news, research, analyses, prices, other information, or links to third-party sites contained on this website are provided on an "as-is" basis, are intended only to be informative, is not an advice nor a recommendation, nor research, or a record of our trading prices, or an offer of, or solicitation for a transaction in any financial instrument and thus should not be treated as such. The information provided does not involve any specific investment objectives, financial situation and needs of any specific person who may receive it. Please be aware, that past performance is not a reliable indicator of future performance and/or results. Past Performance or Forward-looking scenarios based upon the reasonable beliefs of the third-party provider are not a guarantee of future performance. Actual results may differ materially from those anticipated in forward-looking or past performance statements. IC Markets makes no representation or warranty and assumes no liability as to the accuracy or completeness of the information provided, nor any loss arising from any investment based on a recommendation, forecast or any information supplied by any third-party.

USDZAR-BUY strategy 3 hourly chart - regression channelI am not super convinced, and same as yesterday, am not committed to a trade in the pair at this moment in time. However, the pair looks a bit better BUY now, and I feel there is some potential for recovery from the current levels. Overall still pressure judging 12 hourly chart.
Strategy BUY @ 18.8000-18.8350 and take profit near 18.9850 for now.

USDZAR IS STILL BULLISHHello guys please check this video and learn how to analyze the market on big time frame.
We can see HHs&HLs so we still bullish, now it's retesting.
NB:NO REVERSALS NO ENTRY.

$USDZAR Potential bullish scenarioHere's how I'm looking at USDZAR for a potential long trade scenario.
Market has made the discount and we're expecting some extra impulsive move and although, Momentum is low we'd be taking buy positions and booking partial profits as we go, IF we go to the upside.
