AU200AUDAU200AUD look at the caption on the previous post.....same topic, but that video had no audio....this video has audio.
AUS200 trade ideas

AU200 Final chapter on COILS5.10.21 AU200 Final chapter on COILS: I look at patterns, overall market dynamics (admittedly a vague term), structure, and certain tools that I think of as algorithms of the market...and then I have to make a trade decision: buyer? seller? sit on my hands? I am a discretionary trader using market information ( maybe most of us are to various degrees ). Two different trades could use the same tools ( more or less ), trade the same market and make money: one as a buyer and the other as a seller. All the would need is a different trade location. There is a little more to this, but hopefully you get the idea. THIS IS A GOOD REVIEW OF COILS. I would like to add 2 more things to the video: 1) this was not an easy market to trade because it did NOT have good volatility...and that is why this was a laborious process complicated by lots of "work". In a volatile, I find it much easier to analyze and have a better sense of probability. 2) my explanation on this example is of a market that is expanding out of a coil...which means the market could evolve into an easier market to trade. Always think like a buyer AND a seller, and then decide where you have the edge. You cannot trade what you see if you do not know what you are looking at. You are trading in a market of buyers and sellers...and some of those traders are the "smart money" and some of them are the fast money.

Aussie 200 short term sell setupNeeds a 3rd corrective wave down to complete the flat before more upside. Excellent R:R from here. GL :)

AU200 - SHORT > LONGAny form of support is greatly appreciated and helps motivate to publish more ideas for the community.
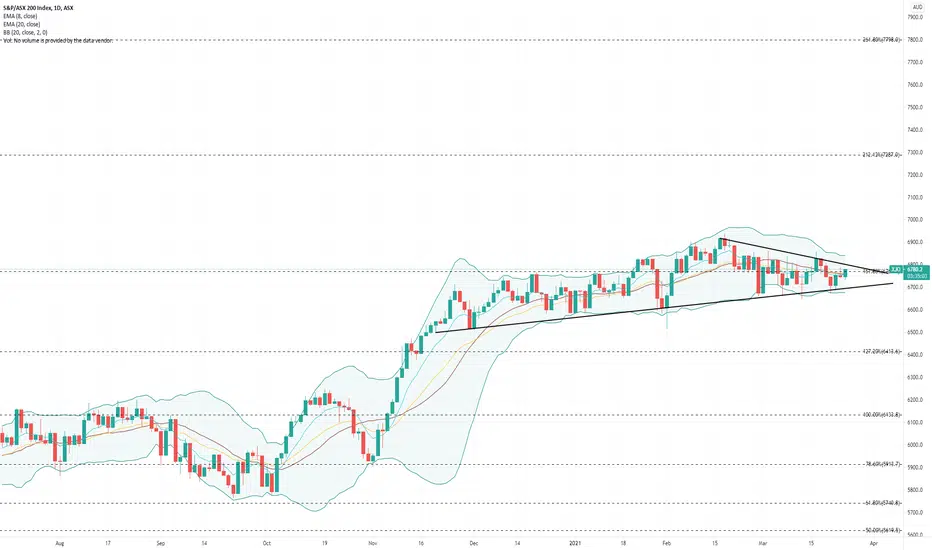
OANDA:AU200AUD
Important Price: 7040.6
We want to see price move away from this, confirming our move down to 7005.5 . After we see this move happen, purely from a price action perspective we're able to determine a further sell off or SHORT.
What do we need to keep an eye on?
Pay close attention between 7040.6 and 7005.5 as these prices will help us in staying in a short until Target #1 and Target #2.
Target #1 6918.8
Target #2 6818.9

AUS200, sellHow to use TP!
When the order price breaks down Tp1,
you wait for Tp2 and SL moves to Tp1,
so as to secure earnings.
So with Tp2 to Tp3.
When we publish the closing of a position, you close it.
When the order comes to SL, always
consult with us, do not close the order.
Follow your open positions!

Sell in MAY and go away? ASX 200Looking at this monthly chart the price of the ASX 200 INDEX shows we could have a drop in the market for a few months at least starting in May.
The supertrend monthly is down and the price will have to fight at as resistance if it wants to move higher. However historically it has been rejected and a drop lower occurred before it actually climbed over it.
I have circled the area of the 2008 crash as the comparison is similar. The drop happened and the climb was fast until it was near the supertrend and it tested it twice before the market went lower. It actually took 5 years before the market was higher. I believe we are in a similar boat now.


Aussie 200 one more push upPutting in a corrective structure for more upside. Should retest ~7200 (pre-covid ATH).


looks like its down from here As you can see the XJO index is in a rising wedge this is a bearish patten and looking to brake down target is 5800

ASX possible directionMy analysis suggests that we might have a somewhat bullish short term outlook and then short might become possible.

XJO Breakout and scale inMonths of consolidation on the 1d/4hr xjo breaking Apr 6. missed opportunity to go long and add. There was a lot of bearish talk recently but here you go the xjo is moving up for now. see if the weekly chart follows. interesting to note the US E-Mini broke roughly 5 days earlier on the daily. Stalking a few setups within the index so we'll see what happens

AUS200, sellHow to use TP!
When the order price breaks down Tp1,
you wait for Tp2 and SL moves to Tp1,
so as to secure earnings.
So with Tp2 to Tp3.
When we publish the closing of a position, you close it.
When the order comes to SL, always
consult with us, do not close the order.
Follow your open positions!


AUS200: Possible triple topThis one to watch. For new traders its a nice one to try out on a Tradingview paper trading account.
The possible triple top is into a zone of congestion. Price may go up or it may go down - only two directions here.
All you can do is take a controlled affordable loss (aka stoploss).
This is positional play for finding a trend south on a lower time frame.
Disclaimers : This is not advice or encouragement to trade securities on live accounts. Chart positions shown are not suggestions and not intended to assure you of an advantage. No predictions and no guarantees are supplied or implied. The author trades mostly trend following set ups which has a low win rate of approximately 40%. Heavy losses can be expected if trading live accounts. Any previous advantageous performance shown in other scenarios, is not indicative of future performance. If you make decisions based on opinion expressed here or on my profile and you lose your money, kindly sue yourself.

The ASX200 may be on the ropes if it can not push through resThe ASX200 is up at resistance that bulls will be desperate to break through and fend off further selling pressure. The key level for us is 6805 and then up to 6860. If the 685 level holds today then we may see a squeeze of recent buyers and push lower. The question for many now is whether the recent break of the longer term uptrend from March will lead to a deeper correction lower or not.
-------------------------------------------------------------
WE TRADE WHAT WE TEACH
Check out our recent Live Streams from our profile page!!
-------------------------------------------------------------
** If you enjoy our free content, please support and follow our profile, by hitting the Follow button to get further high quality ideas. **
** If you are following our ideas any comments and likes are most welcome and will be greatly appreciated **
** With quality alerts and correct Risk Management, you can learn consistency and grow your account **
** With quality portfolio management and defined risk levels to help your account grow and achieve steady profit targets while increasing your trading edge. **

$XJO coming up to the pointy end of the wedgeInteresting times on the XJO. Being naturally prolly more a pessimist I think it will break down. But who knows and who cares. Im at peace with whatever way it goes and will act accordingly.

The Aussies: Is this another one-candle situation?Well, it is one candle at the leading edge. We cannot know if it means anything until stuff happens. Those who look for predictions that foretell the future are in the wrong game.
In trend-following methodologies, one would ride an escalator down or up - on a smaller time frame that that shown here (to conserve losses).
When you zoom out of this chart, you see a market struggling to stay afloat. That's usually not a good sign. The 4H ATR line is above the recent batch of ranging candles. This means there is bearish pressure in this market (on this time frame only). The bulls have lots of work to do if they wanna get above the 4H (amber) line.
The trouble for the Aussies is that they are bounced around by a) the DJI b) the USTech100 and c) US Bond markets. That's why it looks so indecisive (at this time). They are normally most scared of the USTech indices. So watch USTech as well for a steer on probabilities on lower time frames.
