Cac 40 (Euronext) may fall to 7465.00 - 7520.00Pivot
7610.00
Our preference
Short positions below 7610.00 with targets at 7520.00 & 7465.00 in extension.
Alternative scenario
Above 7610.00 look for further upside with 7661.00 & 7710.00 as targets.
Comment
The upward potential is likely to be limited by the resistance at 7610.00.
Supports and resistances
7710.00
7661.00
7610.00
7576.00 Last
7520.00
7465.00
7415.00
Number of asterisks represents the strength of support and resistance levels.
FR40 trade ideas

FR40EUR EXPECTACTIONSFR40EUR expected to have the bullish move as an outcome of HCOB fundamentals, which is worse for EUR this cause XXXEUR to have bullish strike including FR40EUR
I expect to take long at the near most liquidity engineering

Paris Olympics OutcomeHere's a setup of the CAC40, France's top 40 stocks. I believe it is on a bullish ride as well as other indices. It has the best setup in my point of view.
DISCLAIMER NOTICE!
This is only my opinion and not a financial advice to set up a trade or invest. Trading or investing without knowledge is highly risky.

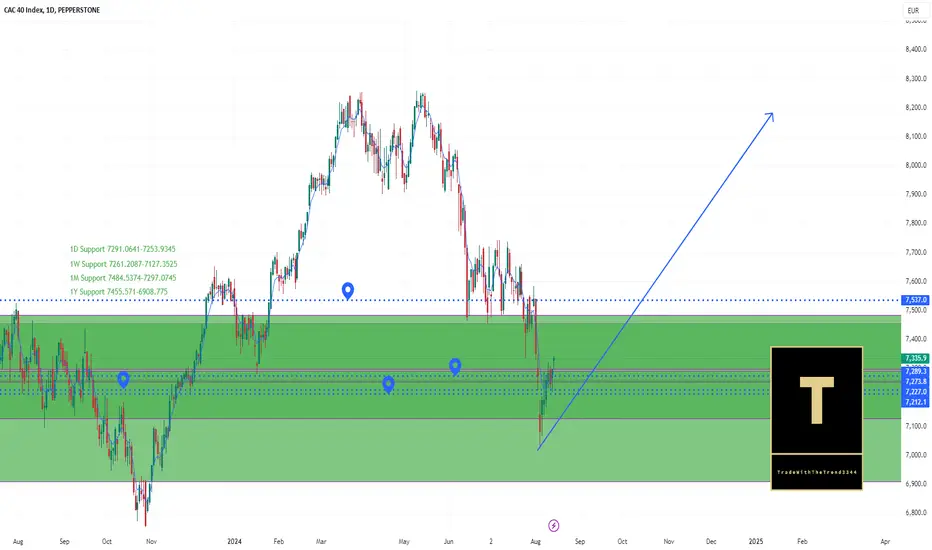
FRA40 Stabilizes at Key Support, Bullish Momentum BuildingHello Everyone,
The FRA40 recently reached a 6-month low at 7028.18, where it has found support. The 1-year, 1-week, and 1-day pivot points have also served as supports so far. While it has stabilized at this level, further support tests cannot be ruled out. Nevertheless, conditions are gradually aligning for a potential bullish movement!
TradeWithTheTrend3344
France 30 Stock Price & AnalysisWithin a 100K Account Balance the split on Trade & Risk Management = 1/10% - 1/20% margin as an Execution Range, to set up an Order Entry and select a per Trade on Average, to avoid any drawdown hit regarding to Stop Loss & to execute Risk on Management Specifics. Trail Stop efforts are a Focus of Attention to the set up in general when Volatile-Price-Action is involved, mainly because of the usage of an Intraday-Scalp-Position tool on behalf on the Trade Plan in general
Key indicators on Trade Set Up in general;
1. Push Set Up
2. Range Set Up
3. Break & Retest Set Up
Active Sessions on Relevant Range & Elemented Probabilities;
* Asian(Ranging) - London(Upwards) - NYC(Downwards)
* Weekend Crypto Session
Statistics
Market Capitalization (EUR)
Full 2,428
Free float 1,694
Annualized (%)
2 Year 12.37% 3.17
3 Years 4.75%
5 Years 6.19%
Since Base Date 31-12-1987 5.67%
Components (full) (EUR)
Average 60.6
Median 32.9
Largest 356.9
Smallest 5.9
Conclusion | Trade Plan Execution & Risk Management on Demand;
Anglo American PLC Stock Price & Analysis: Overall Consensus | Neutral

Predicting next pattern I expect this pattern on CAC40 in the next weeks.
Range :
: resistance level
: Major support level

F40 to Break 7000Yesterday was quite turbulent for all equity markets. In this market, the F40 , Buyers defended just above the 7000 level. Surely this is cheap and a great time to buy.
There is a significant area of Daily Support at 7070. It has on many occasions in the past.
Volume yesterday was Ultra High , reflecting the fight between the sell and buy side.
No real clear winner.
Look at today on very little volume, price again ebbs lower.
The real Demand area lies at 6800.
It is possible for the buy side to be consumed and present support to break , and expose
the Demand below. This is the near- term Target.

CAC40 setting Support to Continue Climbing Regardless of low earnings that have been reported this month investors’ sentiment on future rate cut is still high.
The index is retesting support level and have reached the 13% gap needed to start forming a reverse trend and becoming weeks.
This is strictly not a financial advice, but rather an idea. You should always make your own financial decisions before investing or taking any financial decision.


FRA 40 builds one of the most potent trading patternThe French Stock Market Index is currently trading sideways between 7457 and 7750, forming a rectangle pattern, a reliable chart pattern for traders. A break above the upper limit at 7750 suggests a potential price increase of about 3.73%, reaching 8042. This target is calculated by taking the difference between the rectangle's minimum and high points. Conversely, a break below the lower end of this range could see the index dip to 7159.
It's important to note that the overall market is in a bullish trend, with the January 2024 low around 7284 providing additional support. While a bearish break could drive the market lower, influenced by recent corrections in US stock market indices, the prevailing bullish bias means investors are generally inclined to buy rather than aggressively short on bearish breakouts, unless recession fears loom.
As always, do your own research and proceed with caution. This content is not directed to residents of the EU or UK.
Any opinions, news, research, analyses, prices or other information contained on this website is provided as general market commentary and does not constitute investment advice. ThinkMarkets will not accept liability for any loss or damage including, without limitation, to any loss of profit which may arise directly or indirectly from use of or reliance on such information.

FRA40 Short Setup: Key Levels Near 7732/49 on 4-Hour Chart
Monthly TF: Last month's ICMARKETS:F40 price action showed a strong bearish continuation bar, suggesting downward potential despite the overall bullish monthly trend. We're currently in a phase 2 pullback, which means short positions can be considered until the downside move concludes.
Weekly TF: The weekly chart presents a more complex picture, with over four weeks of bearish sideways ranging bars. There have been rejections from the bottom, hinting the monthly downward move might be nearing its end. However, the last two weeks' price action, despite being low tests, hasn't really achieved anything that might suggest or confirm the downward move has come to an end.
Daily TF: On the daily chart, FRA40 has been ranging for the past few weeks. By combining the monthly (down/pullback) and weekly (bearish sideways) biases, it seems prudent to take a short position from the top of the range towards the bottom.
For the 4-hour chart, we will enter a short position with a Sell Limit around 7732.64/7749.48 . We'll place our Stop Loss above 7760.00 to manage risk, and our Take Profit will be the range's low around 7498.00 .

High-Risk, High-Reward Setup for CAC 40 Ahead of French ElectionFear is spreading, and while uncertainty is problematic, the most likely scenario involves a hung French parliament leading to less aggressive fiscal spending, as the EU will likely step in and impose sanctions on France. Additionally, the market is already offloading French government bonds, and France could face the market's wrath, similar to the UK during Liz Truss's brief tenure.
If normality returns, then the CAC 40 should soar, provided it trades above the January low of 7279.
This content is not directed to residents of the EU or UK. Any opinions, news, research, analyses, prices or other information contained on this website is provided as general market commentary and does not constitute investment advice. ThinkMarkets will not accept liability for any loss or damage including, without limitation, to any loss of profit which may arise directly or indirectly from use of or reliance on such information.

Simple but efficient analysisWe are bellow (but near) 7700$ ; which is the 200 day EMA.
It is difficult to predict the direction at this price level as 2 scenarios are presented :
- If the market breaks this level with high volume , big green candle , and closes above it : positivity is imminent.
- Otherwsie : selling pressure will continue. If 7500$ broken , the negativity can be very harsh as the major support monthly level will be broken.

CAC40 : BEARISH DOUBLE TOP- The market has been trading inside a bullish channel from November 2023 to May 2024, taking prices 6750pts to 8260pts ; the long-term trend was then bullish.
- As we approach the end of the trading season (Sell in May and go away), the market, which was already trading at an all-time high, started to consolidate inside a lateral rectangle.
This configuration can be seen as the sign that investors were rebalancing their portfolios and assessing their risk exposure ahead of the summer season.
But quickly the situation turned sour when surprising results from far-right movements in EU parliament elections triggered political havoc in France where president Macron chose to dissolve the National Assembly.
This led to new legislative elections in France where voters had to choose their new MPs.
With such rising political uncertainty in the second Economy of the Eurozone, investors choose to significantly reduce their exposure to stocks, which led the CAC40 index into correction territory.
The reversal double top chart pattern has been validated and the market registered a new market bottom, the first one since November.
The DMI indicator shows a clearly bearish environment while both moving averages are in bearish configuration too.
More recently, the market has consolidated above the 50% Fibonacci level, in a technical price action.
- This is seen as a bearish configuration. The double top pattern is a trend reversal configuration where a 100% correction can generally be legitimately expected.
The results of the FR elections have led to a hung parliament, which isn't the worst outcome for investors, but also doesn't provide much more political visibility in the region.
And with the lack of good reasons to buy, fear trading will likely dominate for the next few weeks.
The next targets can be located around 7,330pts (61.8%), 7,075pts (78.6%) and even lower.
Pierre Veyret, Technical Analyst at ActivTrades
The information provided does not constitute investment research. The material has no been prepared in accordance with the legal requirements designed to promote the independence of investment research and such is to be considered to be a marketing communication.
All information has been prepared by ActivTrades ("AT"). The information does not contain a record of AT's prices, or an offer of or solicitation for a transaction in any financial instrument. No representation or warranty is given as to the accuracy or completeness of this information.
Any material provided does not have regard to the specific investment objective and financial situation of any person who may receive it. Past performance is not reliable indicator of future performance. AT provides an execution-only service. Consequently, any person acing on the information provided does so at their own risk.

CAC 40 Offering Bearish Cues!The CAC 40 – a major stock market index covering 40 of the largest companies by market capitalisation listed on the Euronext Paris – recently formed a double-bottom pattern off lows at 7,464. The neckline, taken from the high of 7,725, has also recently been challenged, yet price has failed to establish a close above the barrier to complete the pattern. Therefore, for now, the pattern is still unvalidated. You may also see current price action suggests buyers are unlikely to follow through here. Note that on Friday, a bearish engulfing candle formed. Monday’s action is also on track to offer up a bearish outside day formation (unlike the engulfing pattern, which only takes into account the real bodies, a two-candle outside day considers only the upper and lower shadows).
Regarding the Ichimoku Indicator, price action recently crossed above the Conversion Line (blue – 7,601) but remains below the Base Line (red – 7,764). However, with the Conversion Line now below the Base Line, this is considered a bearish signal. Similarly, we can see that the Leading Span A (light green – 7,682) is now below the Leading Span B (orange – 7,857), which is another bearish cue and provides traders with a resistance zone to work with, commonly referred to as a Kumo Cloud or Ichimoku Cloud.
Price Direction?
Because of the current candle action at the underside of the double-bottom pattern’s neckline, and this market is clearly in an early downtrend since forming the double-top pattern off all-time highs of 8,259, bears could soon make a show and challenge the pattern’s lows of 7,464 and try for support at 7,352. However, If we do see price action close above the double-bottom pattern’s neckline, buyers may soon find resistance from the Kumo Cloud.

FR40 to find sellers at current resistance?FRA40 - 24h expiry
Indecisive price action has resulted in sideways congestion on the intraday chart.
Pivot resistance is at 7700.
We expect a reversal in this move.
Risk/Reward would be poor to call a sell from current levels.
A move through 7625 will confirm the bearish momentum.
We look to Sell at 7700 (stop at 7772)
Our profit targets will be 7520 and 7485
Resistance: 7700 / 7750 / 7775
Support: 7600 / 7550 / 7525
Risk Disclaimer
The trade ideas beyond this page are for informational purposes only and do not constitute investment advice or a solicitation to trade. This information is provided by Signal Centre, a third-party unaffiliated with OANDA, and is intended for general circulation only. OANDA does not guarantee the accuracy of this information and assumes no responsibilities for the information provided by the third party. The information does not take into account the specific investment objectives, financial situation, or particular needs of any particular person. You should take into account your specific investment objectives, financial situation, and particular needs before making a commitment to trade, including seeking advice from an independent financial adviser regarding the suitability of the investment, under a separate engagement, as you deem fit.
You accept that you assume all risks in independently viewing the contents and selecting a chosen strategy.
Where the research is distributed in Singapore to a person who is not an Accredited Investor, Expert Investor or an Institutional Investor, Oanda Asia Pacific Pte Ltd (“OAP“) accepts legal responsibility for the contents of the report to such persons only to the extent required by law. Singapore customers should contact OAP at 6579 8289 for matters arising from, or in connection with, the information/research distributed.

Buying CAC40I think the market is overreacting and overestimating the impact of french election. Therefore I think the current levels in CAC40 look quite atractive.

CAC40 Enters Seasonal Growth Phase: A Promising Buy OpportunityThe CAC40 index is entering a period where its price historically tends to grow exponentially until the end of August. This seasonal trend presents a significant opportunity for investors. Our analysis has identified a potential Demand area where the price has already shown a rebound, indicating strong support at this level.
This Demand area is particularly compelling as it aligns with the 78% Fibonacci retracement level, a key indicator in technical analysis that often signals strong price reversals. Additionally, we have observed multiple technical indicator divergences in this region, further strengthening the case for a bullish outlook.
Given these favorable conditions, coupled with the historical seasonality trend, we see a strong opportunity for a Buy order. The setup is not only supported by robust technical signals but also by the expected seasonal increase in price. This combination of factors enhances the probability of a successful trade.
Moreover, with a reward potential of 2X, this setup offers an attractive risk-to-reward ratio, making it a compelling buy opportunity for investors. By entering a Buy order at the identified Demand area, traders can position themselves to capitalize on the expected upward movement in the CAC40 index during this period.
In summary, the convergence of the 78% Fibonacci level, technical indicator divergences, and the historical seasonality trend presents a promising opportunity for a Buy order in the CAC40. This well-rounded analysis supports a favorable risk-to-reward ratio, making it a highly attractive investment opportunity as we approach the end of August.
✅ Please share your thoughts about CAC40 in the comments section below and HIT LIKE if you appreciate my analysis. Don't forget to FOLLOW ME; you will help us a lot with this small contribution.

CAC40 Vulnerable Amidst French TurmoilThesis: A confluence of internal political divisions, social unrest, and external economic pressures creates a compelling shorting opportunity in the CAC40 index.
Key Points:
Domestic Disarray: Recent elections have strengthened the far-right in France, weakening President Macron's centrist hold on power. This political fragmentation leads to policy gridlock and hampers economic stability.
Social Unrest: Macron's economic policies have alienated segments of the population, triggering protests and strikes that disrupt business activity.
Global Headwinds: Rising populism across Europe and the ongoing war in Ukraine create a volatile global economic environment. This uncertainty further strains the French economic outlook through inflationary pressures and supply chain disruptions.
Bearish Outlook for CAC40: The aforementioned factors are likely to negatively impact the performance of companies listed on the CAC40. Investor sentiment is already shifting, as evidenced by recent hedge fund activity in European stocks.

Cac40 France ideaHey Guys,
Yearly is bullish - but only above 7660.
Q Chart is Bearish - Bearish Engulfment.
Monthly as Well. Quarterly Stochastic is turning down.
3 Zones to watch: 8100 7650 7373
Monthly candle is testing Bullish Trendline… Bounce expected to form a lower igh below the Double Bottom. -> Bearish Chartpattern
I will look for an Entry on the Hourly Chart.
Thanks for reading

French stocks subdued ahead of electionsAhead of French elections on Sunday, European markets, led by France, underperform a tech-driven Wall Street. Here, the S&P 500 (+0.65%) has just hit a fresh record high, and was on course to end up for the fourth consecutive week. Month- and quarter-end flows in high-flying tech keeps US equities supported as we head to the second half of the year.
Meanwhile, French stocks remained under pressure ahead of the weekend, with the benchmark CAC testing its lowest levels since January at the time of writing. Investors are not taking any chances heading into the Sunday's snap elections.
But at current levels of around 7460, the index is at a major support. Let's see if dop-buyers re-emerge next week and drive the market higher. However, if the outcome of the elections reveal even more support for the far right wing RN party, then we could see a wobble at the open next week.
By Fawad Razaqzada, market analyst at FOREX.com

