Dow Jones Potential DownsidesHey Traders, in the coming week we are monitoring US30 for a selling opportunity around 39700 zone, Dow Jones is trading in a downtrend and currently is in a correction phase in which it is approaching the trend at 39700 support and resistance area.
Trade safe, Joe.
US30 trade ideas

US30: Potential Bullish BreakoutUS30: Potential Bullish Breakout
US30 hit a low of 36,500 on April 7th. Since then, the price has been climbing steadily, forming a triangle pattern.
While a breakout could happen in either direction, I’m focusing on the bullish potential.
If US30 breaks above the triangle pattern, a strong upward wave could follow, possibly pushing the price toward 44,000.
You may find more details in the chart!
Thank you and Good Luck!
❤️PS: Please support with a like or comment if you find this analysis useful for your trading day❤️

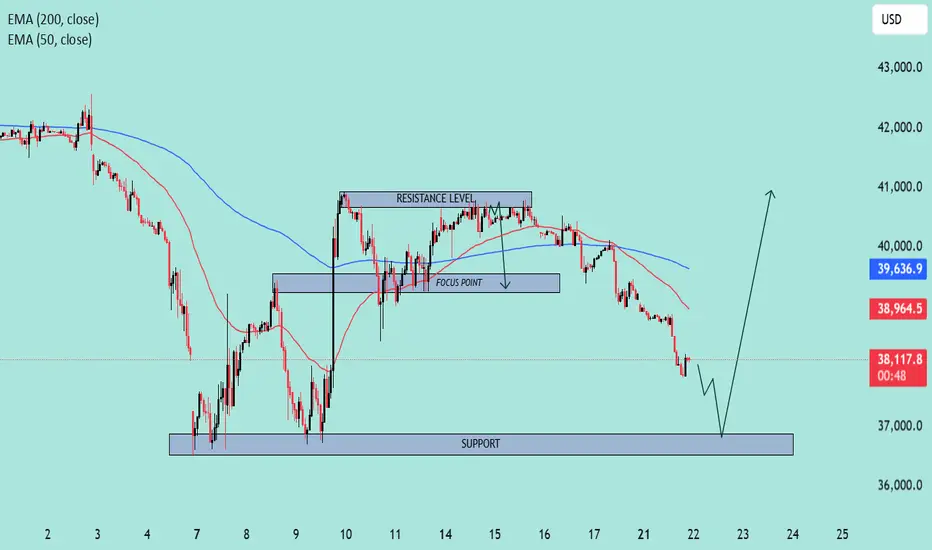
US30 Approaching Key Support Zone – Potential Reversal Ahead?📊 Chart Overview:
Timeframe: Looks like an intraday (maybe 1H or 2H).
Indicators:
EMA 50 (Red): 38,964.7
EMA 200 (Blue): 39,637.0
🔍 Key Levels & Structure:
🔵 Support Zone (Highlighted):
Around 36,800 – 37,200 range.
This is a well-tested support level where price previously bounced.
Current price action is approaching this zone again, which increases the chance of a potential bullish reaction.
🟣 Resistance Level:
Defined around 40,500 area.
Price has rejected multiple times from this zone.
Previously served as a consolidation/decision area.
📍 Focus Point (Previous Support Turned Resistance):
Near 38,700 – 39,000.
This level may act as a reaction point on the way back up.
📉 Current Price Action:
Strong downward momentum heading into the support zone.
Price is under both EMAs, suggesting short-term bearish trend.
However, the drawn arrow suggests a potential reversal bounce from the support.
🧠 Interpretation & Scenario Plan:
🅰️ Bullish Scenario:
Price touches or sweeps the support zone.
Bullish structure or reversal candle forms (e.g., hammer, bullish engulfing).
Break back above EMA 50 & Focus Point could confirm the shift.
Target: Revisit Resistance Zone (above 40,000).
🅱️ Bearish Scenario:
Support fails to hold.
Clean break below 36,800 with volume could lead to accelerated sell-off.
Watch for breakdown retests of support turned resistance.
🔔 Takeaway:
⚠️ Current move is bearish, but price is approaching a key demand zone. Bulls might step in if the zone holds. Confirmation is key before going long. Reclaiming EMAs would strengthen bullish bias.
US30 sellI believe US30 is heading lower for numerous reasons:
- It is really hard to deduce anything from price action on the 3 month and monthly timeframe.
- However, price on the weekly did hit a major liquidity level at 37,250 and rejected it with a lot of bullish orders.
- 40,750 is a liquidity level that has price has failed to close above in two consecutive weeks.
- Moreover, the two previous weeks, price has rejected 40,750 by forming a lower low the next week, which indicates that price is bearish.
- Last week, we saw a bearish candlestick closure on the weekly, which indicates that there is not enough momentum/buy orders for price to go higher.
- Hence, the weekly timeframe is bearish
- The daily timeframe confirms the weekly bias with a number of confluences.
- First of all, we see that price took a lot of buy orders at 37,250 and formed a double bottom.
- Price peaked at 40,750 and the level has been rejected twice with a double top.
-What confirms my bearish bias is that price is that we saw a candlestick closure below 39,560 (this is a region where we see a daily body closure).
- On the daily, price is hence bearish and the next liquidity points are at 38,250 and at 37,500.
- I believe that price is headed to those regions
- On the 4 hour timeframe, we see that price has already formed a textbook sell setup.
- Price collected sell orders at 40,000 on Thursday.
- Price then retraced from the 39,000 level and collected more sell orders at 39,400.
- My 4H take profit is at 38,650.
- Until then, my job is to monitor whether price will fail to reach that target and collect more sell orders at 39,400 or at 39,000.

DOW JONES New long-term bottom being formed on the 1W MA200.Dow Jones (DJI) hasn't yet broken above its 1D MA50 (blue trend-line) following the April 07 Low, but is nonetheless consolidating and holding the 1W MA200 (red trend-line), which hasn't broken as Support since October 17 2022.
That was a few days after the bottom of the 2022 Inflation Crisis was formed and the current Channel Up started. In fact, the rallies that started on both Channel Up bottoms since, have been almost identical in range (+22.60% and +23.80% respectively) so technically we should be expecting at least 44800 (+22.60% from April's Low) on the medium-term.
-------------------------------------------------------------------------------
** Please LIKE 👍, FOLLOW ✅, SHARE 🙌 and COMMENT ✍ if you enjoy this idea! Also share your ideas and charts in the comments section below! This is best way to keep it relevant, support us, keep the content here free and allow the idea to reach as many people as possible. **
-------------------------------------------------------------------------------
Disclosure: I am part of Trade Nation's Influencer program and receive a monthly fee for using their TradingView charts in my analysis.
💸💸💸💸💸💸
👇 👇 👇 👇 👇 👇

US30 | 1H | BUYHey There;
SIGNAL ALERT
BUY US30 / 38,689,19
🟢TP1: 39,258,56
🟢TP2: 39,910,75
🟢TP3: 41,287,59
🔴SL: 37,415,50
RR / 2,00
Please don't forget to like 🙏🏻
Thanks to everyone who supports my analysis with likes. 💙💙💙

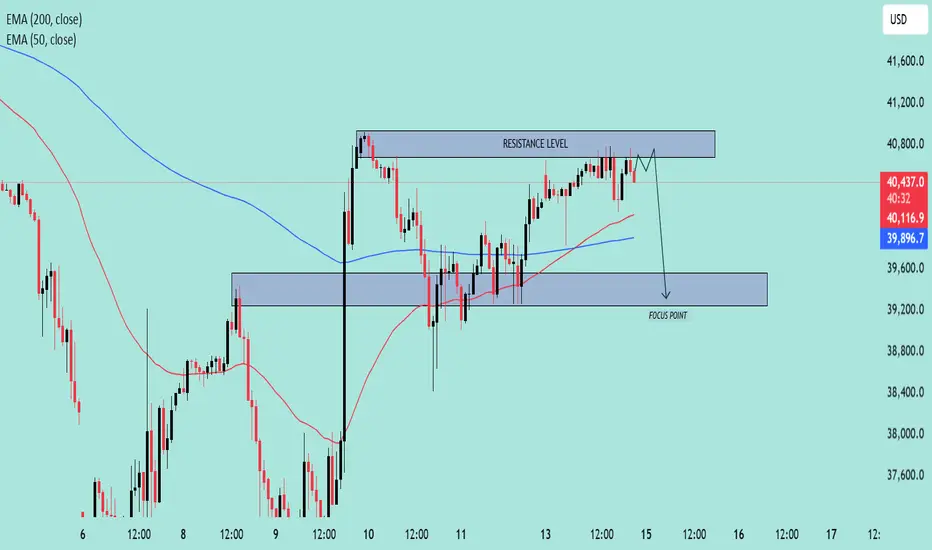
US30 Approaching Key Resistance–Potential Reversal Setup in Play🧠 Chart Overview
Asset: US30 (likely the Dow Jones Industrial Average)
Timeframe: Appears to be 1H or 2H
Indicators:
EMA 50 (Red): 40,119.5
EMA 200 (Blue): 39,897.3
Price at time of chart: Around 40,503
🔍 Key Technical Levels
🔴 Resistance Zone
Range: ~40,750 to 40,850
Price has tested this level multiple times and is currently hovering near it.
The resistance is holding, and no strong breakout has occurred.
🟦 Support / Focus Zone
Range: ~39,200 to 39,600
Marked as the “FOCUS POINT” – likely the expected target on a breakdown.
EMAs Insight:
Price is above both the 50 EMA and 200 EMA, suggesting short-term bullishness.
However, since it’s stalling at resistance, it could flip bearish on rejection.
🧭 Price Action Narrative
The chart suggests a potential fakeout above resistance, followed by a sharp rejection.
The path drawn shows a short-term dip, targeting the FOCUS POINT (support zone).
Rejection at resistance aligns with typical distribution behavior.
📌 Trade Idea (Bearish Bias)
Entry Idea: Short near or just above the resistance level (~40,800)
Target: 39,400 zone
Stop-Loss: Above the resistance level (~40,900+)
Risk/Reward: Favorable if price fails to break above resistance convincingly
📉 Bias: Bearish Reversal
Unless price breaks and closes above resistance with strong momentum, the chart favors a pullback scenario.

DJI Long....A simple Supply Demand Logic trade. The price is well over Supply zone and is still holding the potential to move further up ahead.....
TP 40520
SL 39899

Us30 Upward or downward?In the 5-minute timeframe, you can sell at the top of the trading range and buy at the bottom of the trading range (by observing reversal candles and patterns).
Alternatively, you can wait for a breakout and enter in the direction of the breakout.
Be mindful of fake breakouts


Could the price bounce from here?Dow Jones (US30) is falling towards the pivot which is an overlaps upport and could bounce to the 1st resistance which acts as a pullback resistance.
Pivot: 39,318.40
1st Support: 37,848.26
1st Resistance: 40,824.20
Risk Warning:
Trading Forex and CFDs carries a high level of risk to your capital and you should only trade with money you can afford to lose. Trading Forex and CFDs may not be suitable for all investors, so please ensure that you fully understand the risks involved and seek independent advice if necessary.
Disclaimer:
The above opinions given constitute general market commentary, and do not constitute the opinion or advice of IC Markets or any form of personal or investment advice.
Any opinions, news, research, analyses, prices, other information, or links to third-party sites contained on this website are provided on an "as-is" basis, are intended only to be informative, is not an advice nor a recommendation, nor research, or a record of our trading prices, or an offer of, or solicitation for a transaction in any financial instrument and thus should not be treated as such. The information provided does not involve any specific investment objectives, financial situation and needs of any specific person who may receive it. Please be aware, that past performance is not a reliable indicator of future performance and/or results. Past Performance or Forward-looking scenarios based upon the reasonable beliefs of the third-party provider are not a guarantee of future performance. Actual results may differ materially from those anticipated in forward-looking or past performance statements. IC Markets makes no representation or warranty and assumes no liability as to the accuracy or completeness of the information provided, nor any loss arising from any investment based on a recommendation, forecast or any information supplied by any third-party.

DOW JONES INDEX (US30): Another Gap to Watch
US30 is on its way to fill the gap up that was formed 2 days ago.
It looks like the market will reach a gap opening level soon.
I expect a bearish movement at least to 39285
❤️Please, support my work with like, thank you!❤️
I am part of Trade Nation's Influencer program and receive a monthly fee for using their TradingView charts in my analysis.

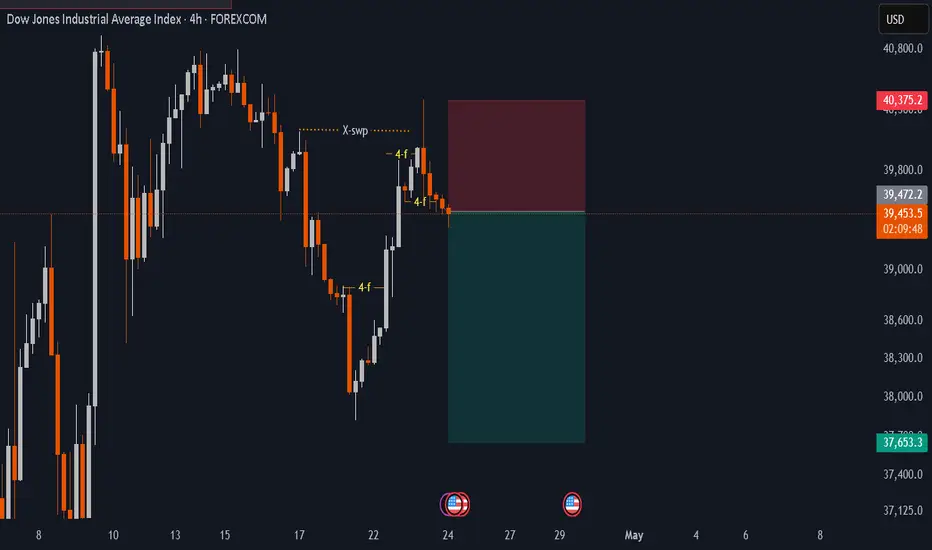
US30idea about the trade is very clear.
1d swing is bearish.
1d fractals is bearish.
4h price movementum gone up takan-out liquidity ,now gave 4h fractals shift towards downside . I m in a sell.
US30 STILL KEEPING 1800+ BEARISH PIPSWhatever the fundamentals linked to this bleeding of DJI but i am still looking for retest SELL before any form of LONG that may last till the kingdom come

possibility of uptrendGiven the behavior of the index in the current resistance range, possible scenarios have been identified.
The index is expected to consolidate above the resistance range and the resistance trend line, then the continuation of the upward trend will take place.

US30 Potential Strong Demand And Reinforced Supply Zones ID Thoughts of this potential trade? I think we have a potential Long from a demand zone followed by a short from a reinforced supply zone... Would love to hear thoughts on this potential play.

Another Rally To Sell?The Dow rallied on higher volume and has gapped up on futures to the trend line, notice each rally is lower highs, is this one different?
We went short on a reversal last week and then closed our short mid session with an update...now we short again. The falls this week were on lower volume, a sign of minor wave two up which should be an ABC, the C rally part underway.
Gold has very likely topped for now, we said it was possible to $3400-500...now in correction mode before the next powerful wave five up to come.
Appreciate a thumbs up, good trading and God Bless you all!

US30 – Descending Channel intact after False BreakoutFX:US30 is currently trading within a clearly defined descending channel, with price action continuously being restricted by the upper trendline. The recent decline indicates that sellers are in control, suggesting the possibility of continuation.
Price has recently broken through a key support area and may come back to retest it. If this level holds as support, it will reinforce the bearish structure and increase the likelihood of a move toward the 34,100 target, which aligns with the boundary of the channel.
As long as price remains below this support area, the bearish outlook remains intact. A false breakout may occur to "trap" buyers, so it is necessary to wait for clear reversal candle confirmation before entering a trade.
Remember, always confirm your setup and use appropriate risk management.

US30 - SHORTPrice continued to push to the downside last week after a brief push to the upside. I expect price to continue selling momentum throughout this week after a price action confirmation at this current level on the 4 hour or 1 hour time frame.
TP set at 36975.

US30 bearish play setting upThe hourly chart is in a downtrend, and we are at that trend line.
On the 15m chart, the momentum of buyers has slowed down to the point where sellers hit it hard as shown by the black arrow.
We want to see the "Last strong buyer" failing to make a new high (or creating a fake high), retesting the horizontal and price falling out of bed.
Waiting for the retest is best but price might not retest before dropping.

US30 Bullish Setup: Buy the Dip Opportunity
The market recently broke structure to the upside, creating a higher high. Price is now retracing towards a key demand zone between 38,750 - 39,000, which aligns with previous structure and demand confluence.
I’m watching for bullish confirmations within this zone to enter long, targeting the upper imbalance/zone around 41,500 - 42,000.
Bias: Bullish
Entry Zone: 38,750 - 39,000
Target: 41,500+
Invalidation: Clean break and close below 38,750
This setup presents a potential “buy the dip” opportunity, assuming bullish momentum holds after the retest.

US30 Trade Update – 21/04/2025 🚨 US30 Trade Update – 21/04/2025 🚨
📉 US30 Continues Downtrend!
The Dow Jones remains under heavy pressure after rejecting 40,701 resistance last week. Price is now grinding below EMAs with a bearish structure and eyeing the next support at 38,400.
🔍 Key Observations:
❌ Strong rejection from 40,701
📉 EMA 8/21 crossover remains bearish
🔻 Price consolidating near 38,800
⚠️ If 38,400 breaks → eyes on 36,743 next major support
🎯 Trade Plan:
🔻 Short below 38,400 → Target 36,743
🔹 Long only if price flips 39,800 and holds
🧨 Bearish bias intact unless bulls reclaim trend control
📌 No signs of reversal yet. Trend favors sellers — watch 38,400 for breakout or bounce.
