US30 trade ideas
Update to Dow Jones Industrials Time At Mode Back in 2015 I had published a chart with annual data for the Dow Jones Industrials. I will provide a link at the bottom.
The research for this patterning is something I did myself by hand using pencil and paper back in the 1980's. These patterns show up in all time frames.
There is plenty of room to enhance the research on this technique and a group of us gather in the chat rooms here at TradingView to discuss new trades that set up and point out when trades expire.
Notice how these two grey boxes (which are both 50% drops in price) that expand wider in time from the 1960's to the 1980's and the 2000-2010's had a multi-year trend, followed by a monster crash (1987 was 40% and 2000 was 37%) and then just two+ years later there was a secondary bear market of 20% in 1990 and 22% in 2022. Keep in mind this is just for the DJ:DJI and not the Nasdaq Composite or S&P500 which were greater corrections.
The 11-year time frame of the 1999-2011 pattern allows for an 11-year rally from 2012 (which was year 1 of the 11-year rally) shows that time expired. As you can see from the 1943-1962 trend, a smaller 5-year mode formed at the end of the 20 year trend and then the market peaked in 1972-1973 when time expired for the second, smaller mode.
I had to reconstruct this chart after the data for the previous chart changed symbol. See the link below to see the original.
I look forward to your additional research onto this pattern and its implications to the idea that we are in a similar period to 1993-1994 with rally years of 1996, 1997, 1998, 1999 and 2000 ahead of us.
All the best,
Tim
October 19, 2024 3:31PM EST

The Federal Reserve continues to tackle inflation🧠 Fundamental Analysis:
The Dow Jones (US30) experienced significant volatility in Q1 2025, with a slight decline due to economic challenges.
Major companies like Coca-Cola and Goldman Sachs are expected to report Q1 earnings this week, and these reports could have a big impact on the index’s movement.
The Federal Reserve continues to tackle inflation, which supports expectations for potential rate cuts later in the year, helping to support the markets.
However, high inflation and ongoing geopolitical tensions may put pressure on economic growth.
💬 Sentiment Analysis:
Market sentiment is currently mixed; there are concerns about a possible recession, but the market is also looking forward to potential monetary easing by the Fed.
Despite the economic pressures, there is limited optimism that the markets may see a recovery as Q2 2025 begins.
The market may experience volatility due to increasing concerns about inflation and corporate earnings, but overall, there is sentimental support in anticipation of clearer economic data.

US30We can attempt to buy US30 from specified level as it make HL , also there is no bearish divergence occur indicate that it moves upward.

Bearish drop?Dow Jones (US30) is reacting off the pivot nd could drop to the 1st support that lines up with the 61.8% Fibonacci extension.
Pivot: 39,291.00
1st Support: 37,024.36
1st Resistance: 40,624.32
Risk Warning:
Trading Forex and CFDs carries a high level of risk to your capital and you should only trade with money you can afford to lose. Trading Forex and CFDs may not be suitable for all investors, so please ensure that you fully understand the risks involved and seek independent advice if necessary.
Disclaimer:
The above opinions given constitute general market commentary, and do not constitute the opinion or advice of IC Markets or any form of personal or investment advice.
Any opinions, news, research, analyses, prices, other information, or links to third-party sites contained on this website are provided on an "as-is" basis, are intended only to be informative, is not an advice nor a recommendation, nor research, or a record of our trading prices, or an offer of, or solicitation for a transaction in any financial instrument and thus should not be treated as such. The information provided does not involve any specific investment objectives, financial situation and needs of any specific person who may receive it. Please be aware, that past performance is not a reliable indicator of future performance and/or results. Past Performance or Forward-looking scenarios based upon the reasonable beliefs of the third-party provider are not a guarantee of future performance. Actual results may differ materially from those anticipated in forward-looking or past performance statements. IC Markets makes no representation or warranty and assumes no liability as to the accuracy or completeness of the information provided, nor any loss arising from any investment based on a recommendation, forecast or any information supplied by any third-party.

Drop followed followed by long.Dow Jones is currently attempting to continue its bullish resurgence, but has failed to do so by failing to stabilise above 40,883. As long as price action is under the 40k mark, the points may likely retest the previous support barriers, situated between 39,500 and 38,750, as likely bullish catalysts for a long opportunity. However, by failing to go down, breaking, and stabilising above 40,883, the price may continue going up, targeting 42,600 and 42,000.

check the trendIt is expected that a trend change will form within the current support range and we will witness the start of an uptrend. Then, given the behavior of the indicator in the resistance range, the continuation of the movement trend will be determined.

US30selling us30
sl 40.736
tp 39.929
1% risk
like an follow
i will be posing more us30 trades,
short on us30

DOW JONES / US30There is a possibility of price correction from the range of 38903.71 towards 39915 and it can be entered as a trade.

Bullish ideaUS30 may rise if it remains above 36,000 as it is a halfway mark of the previous bull run.
As long as price is above 36,400 and 37,000, the indice may try to reach 39,000 and 40,500.
Price action is oscillating between 42,500 and 36,400.

Fool Me Once, Fool Me Twice!What a week, our last idea had a neutral stance and correctly so, volatility was extreme. We did know a bottom of sort was in the making or at least temporarily...now the bounce and where to?
If you have not already realised, any ideas other than Trump caused the recent world mayhem, then you are in denial. Any little respect for this Trump quickly evaporated this week as he reversed his lunacy for 90 days pause..make no mistake, the writing is on the wall now, the markets have shown their hands.
He is merely an actor, it's all a theatre and by design...some well informed individuals made a killing on puts and calls the past two weeks at the mass expense of everyone else.
This rally is a rally to sell, expect a push up to 41700-41900 area, no doubt the game has changed, markets topped with a double top back in January, we have only had the first minor wave 1 down and wave 2 up is in progress and to be followed by a severe wave 3 down...rallies are now sold.
Expect a recession declaration in 3-6 months, expect mass fiat printing to come as a wrecking ball takes apart a market that was priced for perfection...what took a few years to build can be taken out completely in a few short weeks, we were there in 2008.
Gold and especially silver were hammered last week, gold quickly shrugged off the fall and a quick minor wave 4 down has been left for dust in a powerful wave 5 up...this wave, very strong, I expect another week or so of rally before topping out, perhaps U.S $3400-500...silver is an economic precious metal and tied to the coming collapse...but it will bottom out and outperform gold in the end.
Summing up: expect a further rally in the Dow to conclude later next week, Gold to soar and top out also...Gold will have a big correction looming, wave 4 down which could last months, thereafter a rally of historic proportions which will align with QE and systemic failures.
Don't be on the wrong side of whats coming, ignore the mainstream media mouth pieces and trust nothing, especially politicians and banks.
Appreciate a thumbs up, God Bless you all and good trading!

The Dow Jones is in a downtrendIf the price breaks and holds below the psychological level of 39,000 — which is also a weekly resistance — we may see the 37,000 and 36,000 levels. However, it depends on the next weekly candle

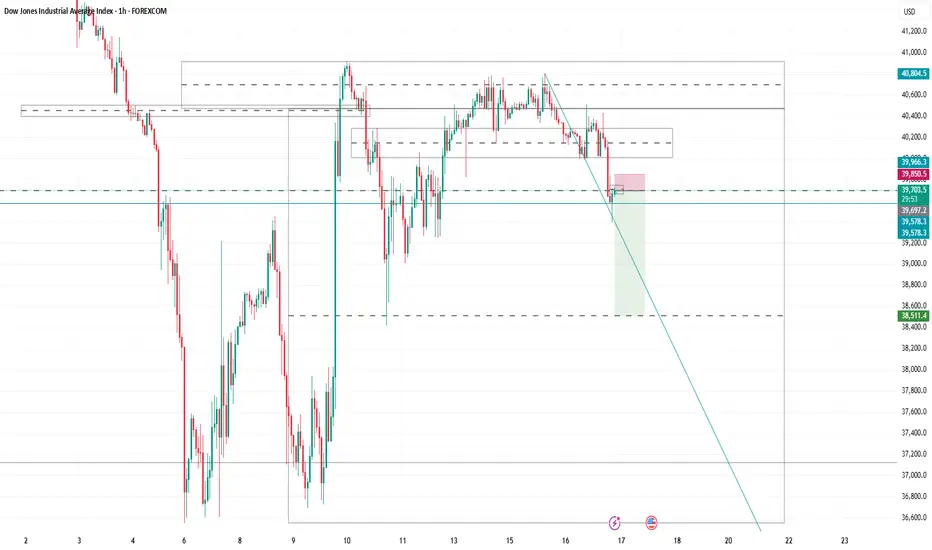
Potential bearish drop?DJ30 is reacting off the support level which is an overlap support and could drop from this level to our take profit.
Entry: 39,332.63
Why we like it:
There is an overlap support level.
Stop loss: 40,743.45
Why we like it:
There is an overlap resistance level.
Take profit: 37,047.85
Why we like it:
There is a pullback support level that is slightly below the 61.8% Fibonacci projection.
Enjoying your TradingView experience? Review us!
Please be advised that the information presented on TradingView is provided to Vantage (‘Vantage Global Limited’, ‘we’) by a third-party provider (‘Everest Fortune Group’). Please be reminded that you are solely responsible for the trading decisions on your account. There is a very high degree of risk involved in trading. Any information and/or content is intended entirely for research, educational and informational purposes only and does not constitute investment or consultation advice or investment strategy. The information is not tailored to the investment needs of any specific person and therefore does not involve a consideration of any of the investment objectives, financial situation or needs of any viewer that may receive it. Kindly also note that past performance is not a reliable indicator of future results. Actual results may differ materially from those anticipated in forward-looking or past performance statements. We assume no liability as to the accuracy or completeness of any of the information and/or content provided herein and the Company cannot be held responsible for any omission, mistake nor for any loss or damage including without limitation to any loss of profit which may arise from reliance on any information supplied by Everest Fortune Group.


DOW/US30Team, time to go long DOW/US30
yesterday the market disappointed on the FED decision,
i just cant believe the FED compare the inflation in 2020-2021 that is where the COVID and lock down. And compare to 2024. he should have cut the interest rate to ease the market.
Given the fact the market is dropping 1000 points, i expect we should have some recover at least 200-300 points medium
Target 1 at 39225
Target 2 at 39335-39420
Target 3 at 39560-39670
We should see the market pump in 2-3 hour time frame or recover.

US30 Gearing Up for a Monster Move – Bulls or Bears?🔍 Price is stalling just below the 40,770.00 resistance, showing signs of exhaustion after a strong bullish push. Momentum is slowing down.
📌 Marked Zones:
• Resistance: 40,770.00 ❌ | 41,552.00 🔼 | 42,540.00 🔼
• Support: 39,270.00 ⚠ | 36,800.00 🛡
📈 Scenarios:
• Bullish Bias: A clean break and retest above 40,770.00 could open the door for a continuation to 41,552.00.
• Bearish Bias: Rejection from 40,770.00 or failure to break higher could trigger a retracement to 39,270.00 or lower.
⚠ Stay patient and watch price behavior around the zone — no breakout, no buy.
📘 This is not financial advice. Always trade your plan.

time to sell DOW again!!!in my idea we r in wave 4 and its almost ended here...so we will sell it to catch wave 5 down...use SL and TP for u r trades so be careful about u r money

Us30What I have realized is price is ranging in between HOD and LOD using inside multiple rejection zones to confuse me,so for now I want to see if it will buy till the HOd since I spotted a ranging market

DOW?
Hi,
Abit over the top with all the negative news..
But..
I have a strong believe that something is cooking. I am bullish bias till 90 days.. hahaha
I will not think that person had learned his lesson.. that tariff / policies will impact financial market.
I hope it will fly. reason:- bad apples had been removed.. squeeze some juice time
Choose your best entry setup.
Not your guru,


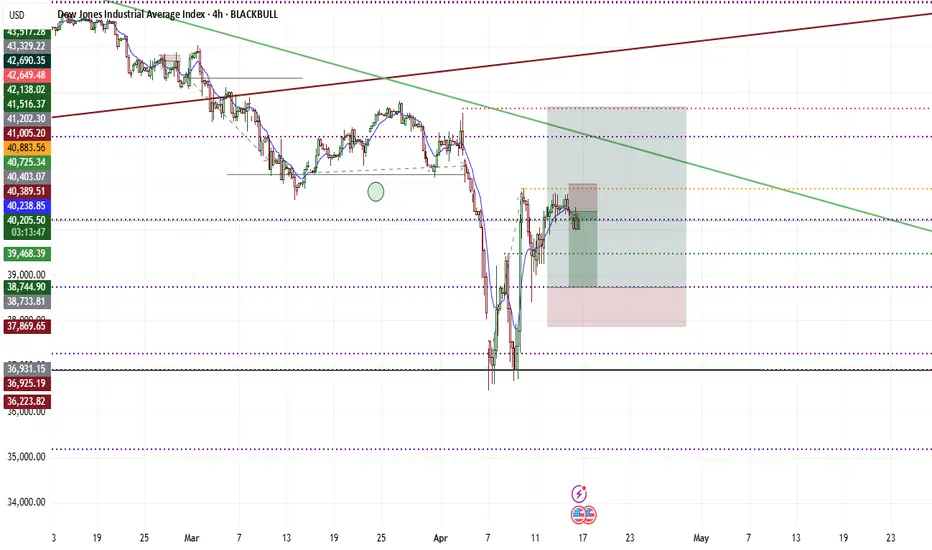
Dow Jones Wave Analysis – 17 April 2025
- Dow Jones reversed from the resistance zone
- Likely to fall to support level 38500.00
Dow Jones index recently reversed down from the resistance zone between the resistance level 40815,00 (former strong support from the start of March), 20-day moving average and the 61.8% Fibonacci correction of the downward impulse from last month.
The downward reversal from this resistance zone stopped the previous minor correction (iv) from the start of April.
Given the clear daily downtrend, Dow Jones index can be expected to fall to the next support level 38500.00.
