Sellers for us30 Strong breakout of my initial support zone. Now with the bears in full force I believe the market will retrace back up to the 50-66% fib zones before having another bear run to wedge channel support.
US30 trade ideas


Dow Jones INTRADAY capped at 40954Key Support and Resistance Levels
Resistance Level 1: 40954
Resistance Level 2: 41510
Resistance Level 3: 42216
Support Level 1: 39600
Support Level 2: 38534
Support Level 3: 37832
This communication is for informational purposes only and should not be viewed as any form of recommendation as to a particular course of action or as investment advice. It is not intended as an offer or solicitation for the purchase or sale of any financial instrument or as an official confirmation of any transaction. Opinions, estimates and assumptions expressed herein are made as of the date of this communication and are subject to change without notice. This communication has been prepared based upon information, including market prices, data and other information, believed to be reliable; however, Trade Nation does not warrant its completeness or accuracy. All market prices and market data contained in or attached to this communication are indicative and subject to change without notice.


US30 Bullish Setup: Buy the Dip Opportunity
The market recently broke structure to the upside, creating a higher high. Price is now retracing towards a key demand zone between 38,750 - 39,000, which aligns with previous structure and demand confluence.
I’m watching for bullish confirmations within this zone to enter long, targeting the upper imbalance/zone around 41,500 - 42,000.
Bias: Bullish
Entry Zone: 38,750 - 39,000
Target: 41,500+
Invalidation: Clean break and close below 38,750
This setup presents a potential “buy the dip” opportunity, assuming bullish momentum holds after the retest.

Trade Idea: US30 Long ( BUY LIMIT )Technical Analysis Summary:
Daily Chart:
• The US30 is bouncing off a recent sharp correction with a bullish engulfing candle forming at support (around 37,675).
• RSI is recovering from oversold territory, now at 46.14 – momentum is shifting.
• MACD still bearish but histogram is shrinking, indicating weakening downward momentum.
15-Minute Chart:
• Strong recovery after a double-bottom near 38,200.
• RSI at 74.55 shows near overbought but still trending up – strong momentum.
• MACD showing a strong bullish crossover and rising histogram – confirmation of intraday trend.
3-Minute Chart:
• Strong breakout to the upside with consolidation at highs.
• RSI around 58 – room to move higher.
• MACD bullish, histogram expanding – short-term continuation likely.
⸻
Fundamental Context (as of April 2025):
• Recent correction in US indices is likely a pullback within a broader bull market (based on Q1 earnings optimism and easing inflation expectations).
• No major Fed tightening signals – bullish for equities.
• Dow Jones (US30) often rebounds strongly after panic drops, especially when technicals align with macro calm.
⸻
Trade Setup (Buy):
• Entry: 39,700 (current consolidation after breakout)
• Stop Loss (SL): 39,150 (below last minor pullback structure and below 3M EMA support)
• Take Profit (TP): 40,800 (near previous structure on the Daily and round number psychological level) FUSIONMARKETS:US30


Drop followed followed by long.Dow Jones is currently attempting to continue its bullish resurgence, but has failed to do so by failing to stabilise above 40,883. As long as price action is under the 40k mark, the points may likely retest the previous support barriers, situated between 39,500 and 38,750, as likely bullish catalysts for a long opportunity. However, by failing to go down, breaking, and stabilising above 40,883, the price may continue going up, targeting 42,600 and 42,000.
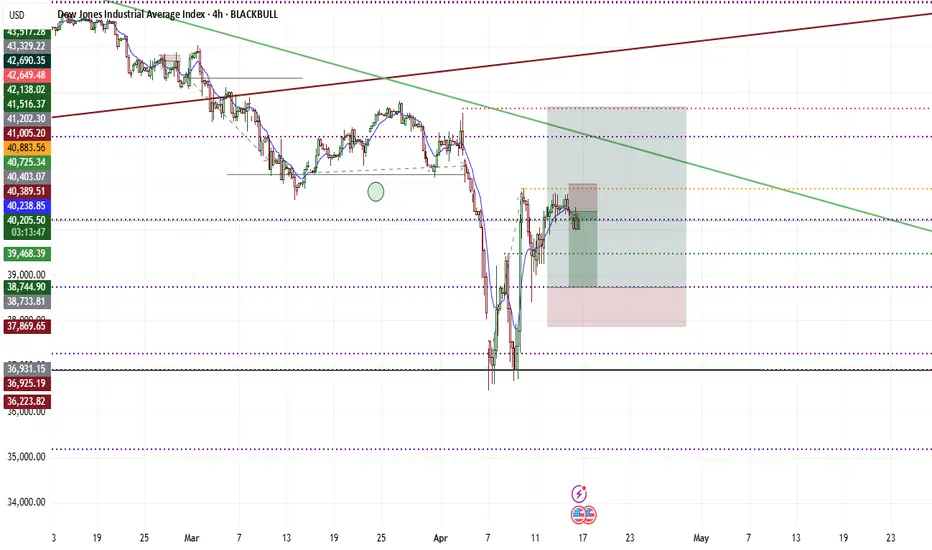


Short-Term Opportunity in Dow Jones: Limited UpsideCurrently, I estimate that under the best-case scenario (black label), the Dow Jones is forming wave of wave B. This implies that the upside movement is likely to remain limited, with a potential retest of the 39,310–39,649 area.
Caution is advised for a possible reversal, especially if the Dow Jones fails to break above the 40,791 resistance level.

US30 – Descending Channel intact after False BreakoutFX:US30 is currently trading within a clearly defined descending channel, with price action continuously being restricted by the upper trendline. The recent decline indicates that sellers are in control, suggesting the possibility of continuation.
Price has recently broken through a key support area and may come back to retest it. If this level holds as support, it will reinforce the bearish structure and increase the likelihood of a move toward the 34,100 target, which aligns with the boundary of the channel.
As long as price remains below this support area, the bearish outlook remains intact. A false breakout may occur to "trap" buyers, so it is necessary to wait for clear reversal candle confirmation before entering a trade.
Remember, always confirm your setup and use appropriate risk management.

US30 - medium to long term opportunity setting upHello,
The US30 futures are forming a bullish pattern, signaling potential upside. The MACD and moving averages align, presenting a compelling opportunity for buyers.
Investors should note President Trump's aggressive push for Federal Reserve Chair Powell to cut interest rates, including threats to dismiss him if he resists. While this rhetoric could unsettle markets, we believe Trump is unlikely to follow through, as markets have likely found a bottom and he would avoid actions that could trigger a downturn.
Technical analysis supports early entry for bold investors, with a stop-loss placed below the recent low. Proceed with caution and good luck.
Disclosure: I am part of Trade Nation's Influencer program and receive a monthly fee for using their TradingView charts in my analysis.

US30 bearish play setting upThe hourly chart is in a downtrend, and we are at that trend line.
On the 15m chart, the momentum of buyers has slowed down to the point where sellers hit it hard as shown by the black arrow.
We want to see the "Last strong buyer" failing to make a new high (or creating a fake high), retesting the horizontal and price falling out of bed.
Waiting for the retest is best but price might not retest before dropping.


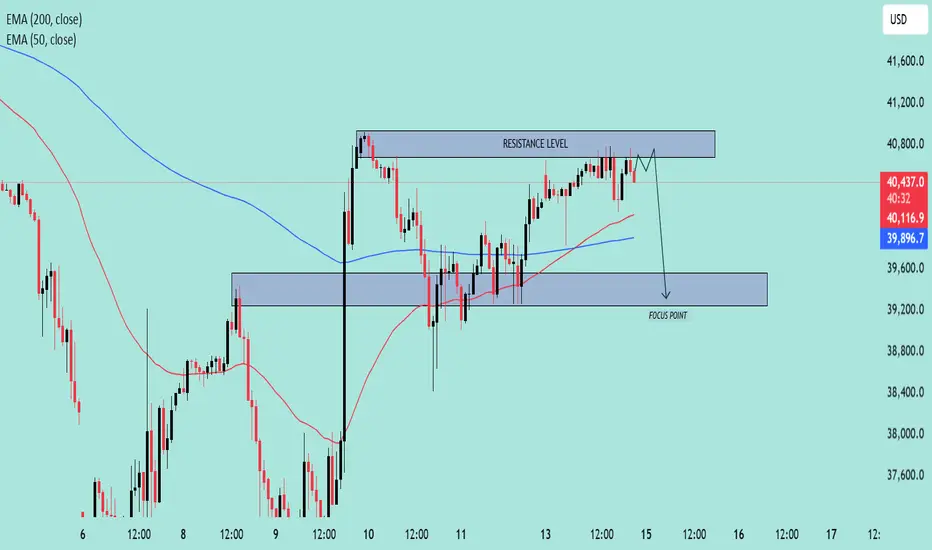
US30 Approaching Key Resistance–Potential Reversal Setup in Play🧠 Chart Overview
Asset: US30 (likely the Dow Jones Industrial Average)
Timeframe: Appears to be 1H or 2H
Indicators:
EMA 50 (Red): 40,119.5
EMA 200 (Blue): 39,897.3
Price at time of chart: Around 40,503
🔍 Key Technical Levels
🔴 Resistance Zone
Range: ~40,750 to 40,850
Price has tested this level multiple times and is currently hovering near it.
The resistance is holding, and no strong breakout has occurred.
🟦 Support / Focus Zone
Range: ~39,200 to 39,600
Marked as the “FOCUS POINT” – likely the expected target on a breakdown.
EMAs Insight:
Price is above both the 50 EMA and 200 EMA, suggesting short-term bullishness.
However, since it’s stalling at resistance, it could flip bearish on rejection.
🧭 Price Action Narrative
The chart suggests a potential fakeout above resistance, followed by a sharp rejection.
The path drawn shows a short-term dip, targeting the FOCUS POINT (support zone).
Rejection at resistance aligns with typical distribution behavior.
📌 Trade Idea (Bearish Bias)
Entry Idea: Short near or just above the resistance level (~40,800)
Target: 39,400 zone
Stop-Loss: Above the resistance level (~40,900+)
Risk/Reward: Favorable if price fails to break above resistance convincingly
📉 Bias: Bearish Reversal
Unless price breaks and closes above resistance with strong momentum, the chart favors a pullback scenario.
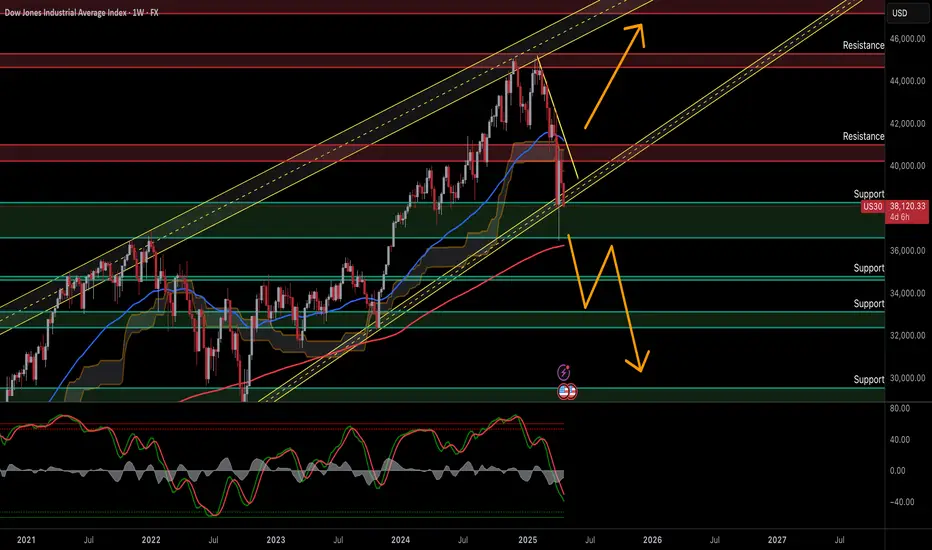
US30 Weekly: Support Under Threat - Prepare for More Downside?US30 Weekly Analysis - Potential Trading Setup
Technical Outlook — 21 April 2025
Current Market Condition:
US30 on the weekly timeframe is trading within a long-term ascending channel. Price recently experienced a sharp correction, breaking below the middle of the channel and is now testing a key support zone.
Potential Trading Setup:
Potential Reversal/Long Setup (Primary Scenario):
Entry: Look for strong bullish reversal signals within the current support zone (around 37,500 - 38,500). This could include bullish candlestick patterns on the weekly or daily timeframe, coupled with the Stochastic indicator showing a bullish divergence or crossing up from oversold territory.
Stop Loss: Place a stop loss below the low of the reversal signal or below the lower boundary of the support zone (below 37,500).
Take Profit Targets:
TP1: The middle of the ascending channel (around 40,500 - 41,000).
TP2: The upper trendline of the ascending channel (currently around 44,000 - 45,000, and rising over time).
Bearish Continuation Setup (Secondary Scenario):
Entry: If bullish reversal signals fail to materialize and the price breaks decisively below the current support zone (below 37,500), look for short entry opportunities. The Stochastic indicator confirming downward momentum would add confluence to this setup.
Stop Loss: Place a stop loss above the high of the breakdown candle or above the broken support zone.
Take Profit Targets:
TP1: The next significant support level around 34,000 - 35,000.
TP2: The lower boundary of the ascending channel (currently around 32,000 - 33,000, and rising over time).
Important Considerations:
Weekly Timeframe Significance: Trading setups on the weekly chart require patience and can take time to play out.
Confirmation is Crucial: Wait for clear confirmation signals, including price action and signals from the Stochastic indicator, before entering any trades.
Channel Dynamics: The ascending channel trendlines are dynamic and will change over time.
Risk Management: Employ appropriate position sizing and always use stop-loss orders.
If you found this analysis valuable, kindly consider boosting and following for more updates.
Disclaimer: This content is intended for educational purposes only and does not constitute financial advice.

US30 sellI believe US30 is heading lower for numerous reasons:
- It is really hard to deduce anything from price action on the 3 month and monthly timeframe.
- However, price on the weekly did hit a major liquidity level at 37,250 and rejected it with a lot of bullish orders.
- 40,750 is a liquidity level that has price has failed to close above in two consecutive weeks.
- Moreover, the two previous weeks, price has rejected 40,750 by forming a lower low the next week, which indicates that price is bearish.
- Last week, we saw a bearish candlestick closure on the weekly, which indicates that there is not enough momentum/buy orders for price to go higher.
- Hence, the weekly timeframe is bearish
- The daily timeframe confirms the weekly bias with a number of confluences.
- First of all, we see that price took a lot of buy orders at 37,250 and formed a double bottom.
- Price peaked at 40,750 and the level has been rejected twice with a double top.
-What confirms my bearish bias is that price is that we saw a candlestick closure below 39,560 (this is a region where we see a daily body closure).
- On the daily, price is hence bearish and the next liquidity points are at 38,250 and at 37,500.
- I believe that price is headed to those regions
- On the 4 hour timeframe, we see that price has already formed a textbook sell setup.
- Price collected sell orders at 40,000 on Thursday.
- Price then retraced from the 39,000 level and collected more sell orders at 39,400.
- My 4H take profit is at 38,650.
- Until then, my job is to monitor whether price will fail to reach that target and collect more sell orders at 39,400 or at 39,000.


US30 – Monthly Market Structure Analysis (April 2025) – OLHC BUY
As we analyze the monthly structure of the US30 index for April 2025, several key technical developments and strategic insights are worth noting:
1. Monthly Low Established:
The price action for this month has thus far established a significant low, indicating a potential bottoming pattern that may signal the beginning of a bullish move.
2. Key Support Level and First Rejection:
A strong bullish rejection was observed at the 37,000 level, which has proven to be a substantial support zone. This level held firmly, suggesting strong buyer interest and institutional accumulation.
3.Target Projection:
My primary take-profit target for this upward move is projected at **41,834.42** , which aligns with higher timeframe resistance and Fibonacci extension levels. This offers a favorable risk-to-reward scenario for long entries.
4. Waiting for Confirmation:
At present, I am closely monitoring price behavior near a **minor support zone**, where I anticipate another rejection that could provide the ideal entry signal for initiating buy positions. Patience remains key as we await further confirmation.
5. Strategic Considerations:
- Risk Management: Traders are advised to apply proper risk management protocols. Avoid over-leveraging, and ensure your trade size is appropriate to your account equity.
- Discipline: Do not rush into trades. Wait for solid confirmation signals, such as bullish candlestick patterns or momentum shifts, before committing capital.
- Market Conditions: Be aware of upcoming economic events or fundamental news that may impact US indices, and adjust your strategy accordingly.
6. Community Engagement:
If you found this analysis insightful and aligned with your trading view, feel free to like, share, and follow for more structured market updates and trading ideas.
Let’s trade smart, stay patient, and manage risk with precision. All the best this month!


US30What is US30?
The US30, also known as the Dow Jones Industrial Average (DJIA) or simply the Dow 30, is a widely followed stock market index that tracks the performance of 30 large, publicly traded U.S. companies. These companies are considered some of the most important and influential in the U.S. economy, representing a diverse range of sectors such as technology, healthcare, finance, consumer goods, and industrials.
The index is price-weighted, meaning that stocks with higher share prices have a greater impact on the index’s value than those with lower prices. The DJIA is calculated by adding the prices of all 30 component stocks and dividing by a divisor that adjusts for stock splits and other corporate actions.
The US30 acts as a barometer of the U.S. stock market and overall economic health, though it only includes 30 companies and is not weighted by market capitalization like the S&P 500.
Companies That Make Up the US30 (As of 2025)
The 30 companies in the US30 include some of the largest and most influential U.S. corporations:
Apple Inc. (AAPL) – Technology
Microsoft Corporation (MSFT) – Technology
Nvidia Corporation (NVDA) – Technology
Visa Inc. (V) – Financial Services
Johnson & Johnson (JNJ) – Healthcare
Procter & Gamble Company (PG) – Consumer Goods
Walmart Inc. (WMT) – Retail
JPMorgan Chase & Co. (JPM) – Financial Services
The Coca-Cola Company (KO) – Consumer Goods
The Home Depot, Inc. (HD) – Retail
McDonald's Corporation (MCD) – Consumer Services
UnitedHealth Group Incorporated (UNH) – Healthcare
The Travelers Companies, Inc. (TRV) – Insurance
The Boeing Company (BA) – Aerospace & Defense
Amgen Inc. (AMGN) – Biotechnology
Goldman Sachs Group, Inc. (GS) – Financial Services
Caterpillar Inc. (CAT) – Machinery
Merck & Co., Inc. (MRK) – Pharmaceuticals
Salesforce, Inc. (CRM) – Technology
Chevron Corporation (CVX) – Energy
IBM Corporation (IBM) – Technology
Honeywell International Inc. (HON) – Industrials
Cisco Systems, Inc. (CSCO) – Technology
The Walt Disney Company (DIS) – Media & Entertainment
Nie, Inc. (NKE) – Consumer Goods
Verizon Communications Inc. (VZ) – Telecommunications
American Express Company (AXP) – Financial Services
3M Company (MMM) – Conglomerates
Walgreens Boots Alliance, Inc. (WBA) – Retail
Dow Inc. (DOW) – Chemicals
How Bond Yields and the US Dollar (DXY) Affect US30 Price Movement
Bond Yields Impact
Rising bond yields (especially U.S. Treasury yields) generally increase borrowing costs for companies, which can dampen corporate profits and weigh on stock prices, including those in the US30.
Higher yields can also make bonds more attractive relative to stocks, causing some investors to shift capital out of equities and into fixed income, putting downward pressure on the US30.
Conversely, falling bond yields reduce borrowing costs and can boost stock valuations, supporting gains in the US30.
US Dollar Index (DXY) Impact
The US Dollar Index (DXY) measures the strength of the dollar against a basket of major currencies.
A stronger dollar can hurt multinational companies in the US30 by making their exports more expensive and reducing the value of overseas earnings when converted back to USD, often leading to downward pressure on the index.
A weaker dollar tends to support US30 companies with significant international sales, potentially boosting the index.
Additionally, dollar strength often reflects risk-off sentiment, which can coincide with stock market declines, while dollar weakness often aligns with risk-on sentiment and rising equities.
Summary
Factor Effect on US30 Price Movement
Rising Bond Yields Negative: Higher borrowing costs, shift to bonds
Falling Bond Yields Positive: Lower borrowing costs, stocks more attractive
Stronger US Dollar Negative: Exporters hurt, overseas earnings worth less
Weaker US Dollar Positive: Boosts multinational earnings, supports stocks
In essence, the US30 reflects the performance of 30 major U.S. companies weighted by stock price. Its price movements are influenced by macroeconomic factors such as bond yields and the US dollar, which affect corporate profitability and investor risk appetite.
