Trade Idea: US30 Short ( SELL LIMIT )Technical Overview:
Daily Chart:
• Clear downtrend with price sharply rejecting from recent highs (~42890).
• MACD shows strong bearish momentum with a widening histogram.
• RSI is below 50 at ~45, confirming downside pressure.
• Price has broken below a key support level near 40200, now acting as resistance.
15-Min Chart:
• Recent lower highs and lower lows.
• MACD negative, with RSI nearing oversold (33), suggesting bearish bias but short-term exhaustion.
3-Min Chart:
• Sideways chop after a sharp down move, showing bear flag/consolidation pattern.
• MACD still negative, RSI around 49—no clear bounce signal.
⸻
Fundamental Overview:
• Recent macro uncertainty (possibly due to inflation/Fed comments or geopolitical tensions) likely weighs on risk sentiment.
• Bond yields are likely pressuring equities, and the US30 tends to be rate-sensitive.
⸻
Trade Setup: SHORT
• Entry: 40250 (if price pulls back slightly into minor resistance zone)
• Stop Loss: 40500 (above recent local high on intraday chart)
• Take Profit: 39600 (next strong daily support level)
FUSIONMARKETS:US30
US30 trade ideas

key levelsdon't you just like looking at key levels
when I don't know but it could be scary but if it does, I mean we have to make the year 2025 become invaded due to years of no real growth other than speculation and hype to not see a nasty move down
I would really love to see next quarter show something of stabilize growth if not well then, I'm beating that the us will fall


US30 Trade Update – 16/04/2025 🚨 US30 Trade Update – 16/04/2025 🚨
📉 Bearish Shift Underway!
US30 has failed to break above the key 40,701 resistance and is now rolling over. Price is losing momentum with a clean rejection and EMA crossover suggesting downside pressure building.
🔍 Key Observations:
❌ Rejection at 40,701 resistance
🔻 Price now trading below EMA 8 & 21
⚠️ 40,060 is the immediate support to watch
🧨 Clean break below → downside opens toward 39,279
🎯 Trade Plan:
🔻 Short below 40,060 → Target 39,279
🔹 Long only above 40,701 → Target 41,200+
🕵️ Wait for volume confirmation before entry
📌 Structure is weakening — bulls must act fast, or bears will take full control.

US30 (H4)US30 has formed a potential Double M (double top) pattern, indicating a possible bearish reversal. Price has tested the resistance zone twice and failed to break higher, suggesting weakening bullish momentum. If neckline support breaks with volume confirmation, this could present a shorting opportunity targeting lower support levels.

US30: The Market Is Looking Down! Short!
My dear friends,
Today we will analyse US30together☺️
The market is at an inflection zone and price has now reached an area around 40,580.88 where previous reversals or breakouts have occurred.And a price reaction that we are seeing on multiple timeframes here could signal the next move down so we can enter on confirmation, and target the next key level of 40,403.97..Stop-loss is recommended beyond the inflection zone.
❤️Sending you lots of Love and Hugs❤️

Daily Price Action: Dow Jones DJI Tuesday 4/15/2025In this video, we are looking into the potential daily price action of DJI.

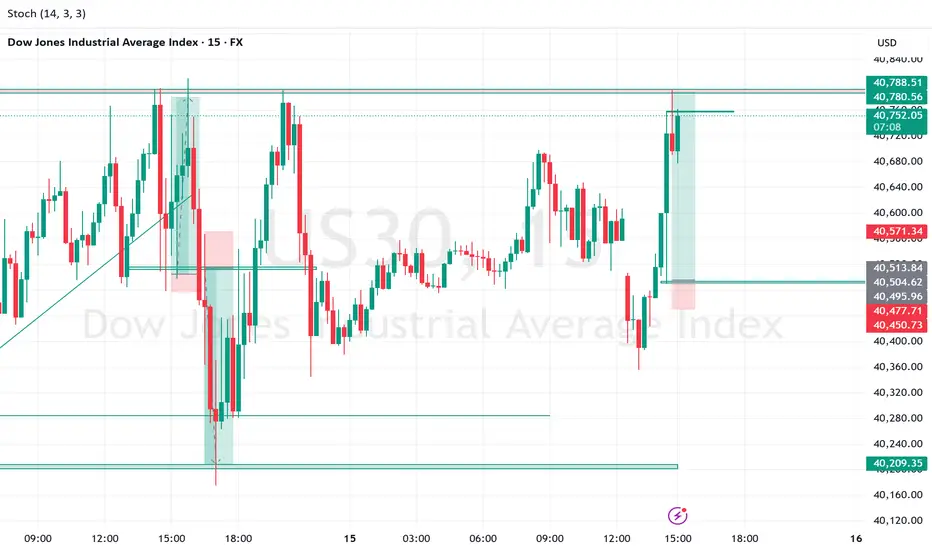
us30 longKey Observations:
Strong Bullish Momentum (Preceding the current candle):
There was a significant bullish move leading up to 15:00, with large green candles pushing price from around 40,570 to 40,770.
This sharp upward move could be news-driven or reacting to a key level.
Current Candle Showing Rejection:
The latest 5-minute candle (red) shows a possible rejection at resistance around 40,780–40,790, where price has wicked to the upside but closed lower.
Indicates possible profit-taking or short-term reversal.
Overbought on Stochastic:
Stochastic Oscillator (14, 3, 3) is at 86.07 and 90.67 — in the overbought zone.
Suggests potential for pullback or sideways movement unless momentum continues.
Resistance & Support Levels:
Resistance Zone: ~40,780–40,788 (previous highs + possible supply zone).
Support Zone: ~40,571 (previous consolidation area and marked SL level).
If price breaks below ~40,690 with volume, watch for a dip toward 40,570 or 40,513.
Trade Idea: US30 Long ( BUY LIMIT ) Technical Analysis Summary
Daily Chart:
• Trend: Recent strong rejection from the 36893 zone followed by a sharp V-reversal; currently recovering, but still under prior highs.
• MACD: Deeply negative but showing signs of reversal (momentum slowing).
• RSI: At 46.22 — mid-range, suggesting room to go higher.
• Bias: Recovery from oversold — bullish short-term momentum within a larger corrective phase.
15-Minute Chart:
• Trend: Strong impulse move up from 37092 area to 40395.
• MACD: Positive cross and momentum flattening — indicating potential short-term consolidation or continuation.
• RSI: 45.36 — still not overbought. Room to push higher.
• Bias: Bullish continuation with potential pullback entries.
3-Minute Chart:
• Trend: Recent micro consolidation with minor pullbacks.
• MACD: Near zero but ticking up, signaling possible small continuation wave.
• RSI: 45.87 — similar mid-range, no bearish divergence.
• Bias: Short-term bullish scalp opportunity.
⸻
Fundamental Outlook (Macro Context)
• Recent Fed tone remains data-dependent, but no immediate rate hike expectations.
• Inflation cooling and market anticipating a potential rate cut later this year supports equities.
• US earnings season began; early sentiment is optimistic.
• Risk-on sentiment may support indices like US30 to grind higher short-term.
⸻
Trade Idea: Long Position
Entry:
Buy Limit @ 40220
• Just below current price, near recent minor support and EMA bounce zone (15M + 3M confluence).
Stop Loss:
SL @ 39870
• Below minor support & key structure zone on 15M chart.
Take Profit:
TP @ 40990
• Next resistance based on Daily chart supply zone and prior rejection area.
FUSIONMARKETS:US30

Dow Jones INTRADAY resistance at 41333Key Support and Resistance Levels
Resistance Level 1: 41333
Resistance Level 2: 42000
Resistance Level 3: 42800
Support Level 1: 39220
Support Level 2: 37554
Support Level 3: 36620
This communication is for informational purposes only and should not be viewed as any form of recommendation as to a particular course of action or as investment advice. It is not intended as an offer or solicitation for the purchase or sale of any financial instrument or as an official confirmation of any transaction. Opinions, estimates and assumptions expressed herein are made as of the date of this communication and are subject to change without notice. This communication has been prepared based upon information, including market prices, data and other information, believed to be reliable; however, Trade Nation does not warrant its completeness or accuracy. All market prices and market data contained in or attached to this communication are indicative and subject to change without notice.

US30 Trade Update – 15/04/2025🚨 US30 Trade Update – 15/04/2025 🚨
📊 US30 Testing Key Resistance!
The Dow is stalling just under 40,702, a critical resistance zone that has capped price multiple times. A breakout could spark continuation toward 41,500, but rejection here could drag price back toward 39,900 or even lower.
🔍 Key Observations:
✅ Strong recovery from 36,743 low
✅ Price consolidating just under resistance
🔺 Breakout above 40,702 opens path to 41,500
🔻 Support zone: 40,060 → 39,900
🎯 Trade Plan:
🔹 Long above 40,702 → Target 41,500
🔻 Short below 40,060 → Target 39,900
🔹 Range traders can fade the zone until breakout confirms
⚠️ Patience is key — this squeeze could go either way. Let price tip its hand.

US30 I Bearish Drop Based on the H4 chart analysis, we can see that the price has just reacted off our sell entry at 40693.92, which is an overlap resistance.
Our take profit will be at 39359.24, an overlap support level.
The stop loss will be placed at 42215.43, which is a swing high resistance level.
High Risk Investment Warning
Trading Forex/CFDs on margin carries a high level of risk and may not be suitable for all investors. Leverage can work against you.
Stratos Markets Limited (tradu.com):
CFDs are complex instruments and come with a high risk of losing money rapidly due to leverage. 63% of retail investor accounts lose money when trading CFDs with this provider. You should consider whether you understand how CFDs work and whether you can afford to take the high risk of losing your money.
Stratos Europe Ltd (tradu.com):
CFDs are complex instruments and come with a high risk of losing money rapidly due to leverage. 63% of retail investor accounts lose money when trading CFDs with this provider. You should consider whether you understand how CFDs work and whether you can afford to take the high risk of losing your money.
Stratos Global LLC (tradu.com):
Losses can exceed deposits.
Please be advised that the information presented on TradingView is provided to Tradu (‘Company’, ‘we’) by a third-party provider (‘TFA Global Pte Ltd’). Please be reminded that you are solely responsible for the trading decisions on your account. There is a very high degree of risk involved in trading. Any information and/or content is intended entirely for research, educational and informational purposes only and does not constitute investment or consultation advice or investment strategy. The information is not tailored to the investment needs of any specific person and therefore does not involve a consideration of any of the investment objectives, financial situation or needs of any viewer that may receive it. Kindly also note that past performance is not a reliable indicator of future results. Actual results may differ materially from those anticipated in forward-looking or past performance statements. We assume no liability as to the accuracy or completeness of any of the information and/or content provided herein and the Company cannot be held responsible for any omission, mistake nor for any loss or damage including without limitation to any loss of profit which may arise from reliance on any information supplied by TFA Global Pte Ltd.
The speaker(s) is neither an employee, agent nor representative of Tradu and is therefore acting independently. The opinions given are their own, constitute general market commentary, and do not constitute the opinion or advice of Tradu or any form of personal or investment advice. Tradu neither endorses nor guarantees offerings of third-party speakers, nor is Tradu responsible for the content, veracity or opinions of third-party speakers, presenters or participants.

US30 pullback the overall bearish trend still in play. However, we are in a pullback to the upside where I will expect a reversal at the rejection block identified in the chart.
The idea is for educational purposes and should not be construed as an investment advice.

us30 bullishI'm back again with nice setup for us30 bullish movement up we go no looking back, break and retest support level.

Long Term Market PredictionThis is based on 5 different indicators along with a deep analysis using AI. Based on repeating patterns. We see a 50% gain before dropping down to a 25-50% retracement of the total span, then a 100% gain from initial starting point at intervals. Looking at bar length:
From 1,400 up to 11,700 is +10,300
From 1,200 up to 6,400 is +5,200 (about half of 10,300)
From 2,600 up to 5,400 is +2,800 (about half of 5,200)
Seeing that these upward moves appear to be roughly halving each time, the next “up” might be around half of 2,800, i.e. about +1,400. Adding 1,400 to the most recent term (5,400) gives
5,400
+
1,400
=
6,800.
5,400+1,400=6,800.
So a plausible next term (if we follow that decreasing-up-jump idea) is around 6,800 bars. This concludes how we will get to the next increase - though much slower than the previous 2.

Price Action: Dow Jones Index DJI Monday 4/14/2025In this video, we will be looking at the Daily Chart for the Dow Jones Index (DJI) and its potential price action forecast for Monday 4/14/2025.

US30 Trade Update – 14/04/2025🚨 US30 Trade Update – 14/04/2025 🚨
📈 Dow Jones Back in Bull Mode!
US30 has surged back above 40,600 and is now approaching the key resistance at 40,860. Bulls are pressing higher, but price is now near a critical decision point.
🔍 Key Observations:
✅ Strong recovery from 36,743 support
✅ Higher highs + bullish EMA crossover
🔺 Resistance ahead at 40,860 → 41,200
🎯 Trade Plan:
🔹 Long above 40,860 → Target 41,200
🔻 Short only if price rejects 40,860 & drops below 40,450
🔹 Wait for breakout confirmation — no rush!
⚠️ Momentum favors bulls, but 40,860 is the gatekeeper. Let price prove itself.

Beyond the Noise: US30 Analysis and Actionable Trade Ideas.Technical Analysis: US30 (Dow Jones)
📊 The US30 index is currently displaying a bearish trend on the weekly timeframe. We're observing a strong rally followed by a pullback into equilibrium when measured against the previous price swing range.
🔍 At present, the index sits in a premium zone, creating conditions where short positions may be accumulating for potential downside movement. However, market sentiment remains highly susceptible to external factors, particularly political statements and social media activity from key figures like Donald Trump.
⚠️ Given this unpredictability, a more prudent approach involves shifting focus to lower timeframes and following price action signals directly. The 30-minute chart presents a defined range that offers potential trade opportunities.
💡 Trade Idea: Monitor the current range on the 30-minute timeframe. A decisive break above the range could signal a long entry opportunity, while a break below may indicate a short entry position.
📈 This range-breakout strategy allows traders to adapt to market conditions rather than attempting to predict overall market direction, which has proven increasingly challenging in the current economic and political climate.
Not financial advice.

US 30 - Ranges overview Let's see what the charts are telling us on US 30.
Similarly to US 100 we are currently redistributing after a clean retracement towards the HTF sellside.
Pretty easy plan as always.
IF we hold 36970 expect us to aggressively trade towards 42500. From a LTF perspective - the current price action is ideal for scalpers. So don't hesitate to play the LTF ranges BASED ON THE HTF ranges.
IF deviate and hold below 36970 we will revisit 35597. We have a LTF inverted FVG sitting between 37620 and 36970 so keep an eye on it.
Stay safe and never risk more than 1-5% of your capital per trade. The following analysis is merely a price action based analysis and does not constitute financial advice in any form.

Weekly Forex Outlook Sun.April.13.2025 - Fri.April.18.2025Like and Comments would be appreciated :D Not Financial Advice, Just my outlook/opinion

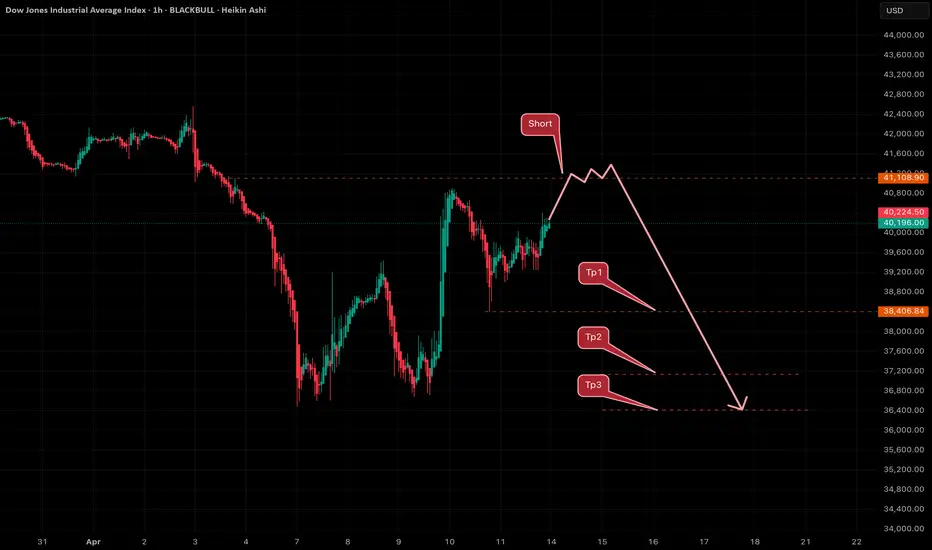
Close to the short entry zone.BLACKBULL:US30 Following a potential move above the 41,108 resistance level, we anticipate short-selling opportunities. The initial downside target is identified at 38,406. Should bearish pressure persist, a secondary target lies below 36,470. Upon reaching this key support zone, we will closely monitor price action for signs of a possible bullish reversal and the emergence of new long setups.