Nasdaq Pending Short: Completion of Wave 1 of CLike I mentioned in the video, we have completed a 5-wave structure for wave 1 of C. We are currently in wave 2 of C. And while this is a long-then-short idea, I feel that the risk to go long at this point of my posting is too risky, so it's better to wait for a short opportunity.
USTEC trade ideas

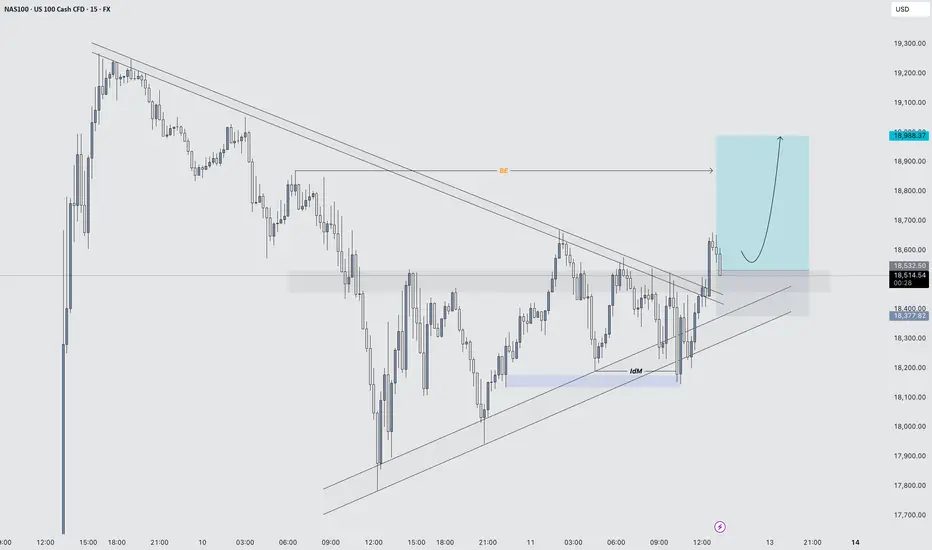
THOUGHTS ON NAS100NASDAQ 1W - As you can see above this is my higher timeframe outlook on this pair, I want to see price correct itself now trading us up and into the area of Supply I have marked out above.
In doing so we ought to see strength in the USD. This will only be temporary just to clear any remaining orders that may be left before we can have a larger move to the downside.
Once price does eventually trade us higher up and into the Supply Zone above, this is when we can begin looking to take this market short. Using this as an area to enter in from.
We want to see price trade in, clear orders and then begin showing signs of a distribution, this is removing those buy orders and introducing sell orders, giving us the S&D flip we want.

Likelihood the top is behind.Nasdaq and the stock market.
My guess is we just completed the very first leg of the bear market.
Likelihood the top is behind.
Only with hindsight will we know how this actually plays out.

Nasdaq what to expect next?The Nasdaq has declined approximately 23% from its all-time high, positioning us near a notable discount on a global timeframe. In my professional assessment, this presents a compelling opportunity to begin constructing a diversified portfolio. However, I anticipate further downward movement in the near term, so I recommend a measured approach—allocate capital gradually rather than deploying all available cash at once. Consider initiating positions through Contracts for Difference (CFDs) or Exchange-Traded Funds (ETFs), focusing on high-quality, blue-chip equities such as Microsoft (MSFT), Apple (AAPL), NVIDIA (NVDA), Nike (NIKE), and Walmart (WMT), among others.
That said, I advise against overcommitting capital at this juncture. The potential for an economic recession remains, and the market could trade sideways for an extended period—potentially one to two years. Prudence is warranted.
Additionally, the Fear and Greed Index for U.S. stocks currently stands at 6, a level strikingly close to the 5 recorded during the COVID-19 market crash. Those familiar with market history will recall the significant rebound that followed. This historical parallel suggests a potential inflection point.
Personally, I am actively participating in this market, incrementally rebuilding long-term positions within my investment account. Opportunities of this magnitude are infrequent, occurring perhaps once every few years. However, this does not preclude further declines—markets can always test lower levels. From a statistical perspective, though, the current environment supports initiating long-term investment positions with a disciplined strategy.
Let me know if you’d like a deeper analysis of specific assets or portfolio allocation tactics!
NOT FA!

a bullish setup on the NAS100currently price has hit previous a point of interest, a previous support on Day and weekly candles

Hanzo | Nas100 15 min Breaks – Will Confirm the Next Move🆚 Nas100
The Path of Precision – Hanzo’s Market Strike
🔥 Key Levels & Breakout Strategy – 15M TF
🔥 Deep market insight – no random moves, only calculated execution.
☄️ Bullish Setup After Break Out – 17000 Zone
Price must break liquidity with high volume to confirm the move.
🩸 15M Time Frame Confluence
————
CHoCH & Liquidity Grab @ 16880
Key Level / Equal lows Formation - 16350
Strong Rejection from 16350 – The Ultimate Pivot
Strong Rejection from 16890 – The Ultimate Pivot
🔥 1H Time Frame Confirmation
Twin Wicks @ 16890 – Liquidity Engineered
Twin Wicks @ 17000 – Liquidity Engineered
☄️ 4H Historical Market Memory
——
💯 18 jan 2024 – Bearish Retest 16900
💯 11 jan 2024 – Bearish Retest 16900
💯 18 jan 2024 – Bullish Run After Break That level
👌 The Market Has Spoken – Are You Ready to Strike?

NASDAQ Might Recover From Massive LossesWohooo... These days are wild!
Now let's take a look at how the day can develop, because... the market, at least the NASDAQ, doesn't look that bad anymore.
We are seeing the first signs of a bottom. However, it can be assumed that the market will dip again at the opening.
There is a bullish order block in the area shown, which coincides pretty much exactly with the POC of the last recovery attempt.
An excellent RRR for long trades could be taken here.

Hanzo | Nas100 15 min Breaks – Will Confirm the Next Move🆚 Nas100
The Path of Precision – Hanzo’s Market Strike
🔥 Key Levels & Breakout Strategy – 15M TF
🔥 Deep market insight – no random moves, only calculated execution.
☄️ Bullish Breakout Watch – 17300 Zone
→ Must break with clear volume injection to validate the setup.
☄️ Bearish Setup After Break Out – 16550 Zone
Price must break liquidity with high volume to confirm the move.
🩸 15M Time Frame Confluence
————
CHoCH & Liquidity Grab @ 16880
Key Level / Equal lows Formation - 16350
Strong Rejection from 16350 – The Ultimate Pivot
Strong Rejection from 16890 – The Ultimate Pivot
🔥 1H Time Frame Confirmation
Twin Wicks @ 16890 – Liquidity Engineered
Twin Wicks @ 17000 – Liquidity Engineered
☄️ 4H Historical Market Memory
——
💯 18 jan 2024 – Bearish Retest 16900
💯 11 jan 2024 – Bearish Retest 16900
💯 18 jan 2024 – Bullish Run After Break That level
👌 The Market Has Spoken – Are You Ready to Strike?

NASDAQ 100: Is a Reversal Coming?Learn why the NASDAQ 100 might face strong resistance near 19,000 and what key levels to watch for a potential rollover. We also explore how crypto weakness could signal downside risk for equities.
This content is not directed to residents of the EU or UK. Any opinions, news, research, analyses, prices or other information contained on this website is provided as general market commentary and does not constitute investment advice. ThinkMarkets will not accept liability for any loss or damage including, without limitation, to any loss of profit which may arise directly or indirectly from use of or reliance on such information

Nasdaq 100 drops to its lowest level since January 2024Nasdaq 100 drops to its lowest level since January 2024
According to the chart of the Nasdaq 100 (US Tech 100 mini on FXOpen), the index opened this week around the 16,500 mark – a price level last seen in early 2024.
This suggests that the sharp sell-off in equities seen last Thursday and Friday may well continue today.
Stock indices respond to Trump’s tariffs
Treasury Secretary Scott Bessent said on NBC News’ Meet the Press that there is “no reason” to expect a recession.
However, equity charts reflect market sentiment described by CNN Business’s Fear & Greed Index as “extreme fear”. This wave of negativity followed President Trump’s announcement on 2 April of harsher-than-expected international trade tariffs. In response, China and other nations announced retaliatory measures.
As a result, the Nasdaq 100 (US Tech 100 mini on FXOpen) now trades roughly 25% below its 2025 peak – officially entering bear market territory.
Technical analysis of the Nasdaq 100 (US Tech 100 mini on FXOpen)
Back on 28 February, we drew an ascending trendline (line A). Bulls attempted a rebound from this support (as shown by the arrow), but their efforts were overwhelmed by the White House’s latest policy decisions.
Given the updated price action, we can now treat line A as the median of an ascending channel. From this perspective, the index is currently near the lower boundary of the channel.
Technically, this could indicate potential support. However, as long as the price remains below the bearish gap – which includes the key psychological level of 17,000 – talk of a meaningful recovery may be premature.
This article represents the opinion of the Companies operating under the FXOpen brand only. It is not to be construed as an offer, solicitation, or recommendation with respect to products and services provided by the Companies operating under the FXOpen brand, nor is it to be considered financial advice.

NAS100 SELL 30 MINUTE TIME FRAMESupply Zone
Price could potentially break previous support zones
5:1 Risk Reward, Let's see!

NAS100The NAS100, also known as the Nasdaq 100, is a stock market index that includes 100 of the largest non-financial companies listed on the Nasdaq Stock Market. It primarily represents technology and innovation-driven companies, such as those in sectors like technology, healthcare, consumer services, and industrials. The index is often used to gauge the performance of the tech-heavy part of the stock market. It reflects how well these companies are performing overall, but unlike other indexes, it excludes financial companies like banks and insurance firms. Investors and analysts often look at the NAS100 to track trends in the tech sector and its influence on the broader economy.

Trade war impact on Nasdaq 100Trade wars are escalating, and this time the United States is in conflict with nearly every major economy. In this video, I explain why this shift could have a massive impact on global markets and what it means for traders right now.
I walk through the historical parallels from 95 years ago, when similar tariffs deepened the Great Depression and led to an 80 percent drop in the Dow Jones. A decade later, World War II followed. While no one wants to see that repeated, economic tension is clearly building.
We take a closer look at the Nasdaq 100, which is now trading below its 200-day moving average. I explain why the technical setup suggests further downside and how traders might look to short into rallies rather than chase the current move.
This content is not directed to residents of the EU or UK. Any opinions, news, research, analyses, prices or other information contained on this website is provided as general market commentary and does not constitute investment advice. ThinkMarkets will not accept liability for any loss or damage including, without limitation, to any loss of profit which may arise directly or indirectly from use of or reliance on such information

Nasdaq Short: wave 3 of 3Hi all, as I am super busy with work, I will only be posting this as reference. All the equity markets should be going into wave 3 of 3 also. Stop above wave 2 of 3 high.
Sorry for not responding for the rest of the week.
Good luck!

NAS100 (15min) – Bullish Entry Activated1. Symmetrical Triangle Formation
Price was compressing inside a symmetrical triangle, with a series of lower highs and higher lows, indicating indecision and buildup of pressure.
2. Downside Fake-out (False Breakout)
Price briefly broke below the lower trendline, suggesting a potential bearish breakout.
However, there was no strong follow-through; instead, price quickly reclaimed the trendline and pushed back inside the structure.
This is a classic fake-out, often trapping late sellers and providing liquidity for buyers.
The rejection from the lows resulted in a long wick, signalling strong buying interest and failure to break down.
3. Aggressive Bullish Reaction
After reclaiming the triangle support, price moved rapidly back to the top of the triangle.
The next key move was a strong breakout above the upper trendline, confirming bullish intent.
4. Break and Retest
Price action followed through with a clean breakout above resistance, followed by a minor pullback and retest of the broken trendline, which held as support.
This retest offered a textbook entry point based on price action principles.
5. Bullish Structure Confirmation
Post breakout, price formed a higher low and continued to make a higher high, confirming a trend shift.
This structural change strengthens the bullish outlook.
92% Win Rate Strategy Using Gann’s Planetary LongitudeHave you ever wondered how some traders seem to anticipate market reversals with uncanny precision, almost as if they can see into the future?
Well, what if I told you that the secret doesn’t lie in guesswork or traditional retail indicators, but in the heavens themselves?
Let me walk you through one of the most powerful forecasting tools in Gann's arsenal—the Planetary Longitude Method and how I used it to identify the exact price level from which the market reversed.
The Power of Planetary Time Cycles in Trading
This technique isn’t based on patterns, trendlines, or lagging indicators. It’s rooted in precise planetary time cycles, the same natural laws that govern the movement of celestial bodies.
Gann believed the markets were not chaotic but deeply connected to universal rhythm and planetary motion. According to his planetary longitude method, each planet holds a specific degree of longitude at any given time. These degrees can be directly mapped onto price charts, turning astronomical data into actionable trade setups.
When price meets planetary longitude, something extraordinary happens. These degrees act as invisible support and resistance levels—ones that retail traders never see. They are silent yet powerful markers of change, and because they are rooted in cosmic cycles, they give you a strategic edge in timing your trades.
Why These Degrees Matter
As a trader, what you’re truly looking for is reaction zones, areas where price is likely to pause, reverse, or accelerate. When planetary time and market price converge at a particular degree, it creates what Gann called a "vibrational point", a moment of energetic alignment. These are high-probability zones where you can anticipate market turning points with accuracy.
By tracking the longitudes of key planets, such as the Sun, Moon, Mars, Jupiter, or Saturn—you can identify these critical junctures. Each planet brings its own cycle, its own tempo. For deeper, longer-term reversals, I often rely on the slower-moving planets like Pluto, while for short-term setups, I look at the faster ones like the Moon or Mars.
How I Forecasted the US100 Reversal from 19,384.6
Now, let’s get practical.
In this recent example, I was closely watching the US100 index, where I anticipated a potential reversal around the level of 19,384.6. Was this just another support/resistance zone? Absolutely not.
Here’s how I arrived at this precise level using Gann’s Planetary Longitude Technique:
First, I took the price level of 19,384.6 and converted it into degrees. To do this, I simply subtracted 360 repeatedly from the price until I arrived at a number less than 360. This process is based on the 360° circle of the zodiac—once the price cycles through the full circle multiple times, what's left is the vibrational degree associated with that price. In this case, the price level of 19,384.6 converted to approximately 304.6°.
Then, I checked the planetary position of Pluto which was 303.55° in longitude.
This created a near-perfect alignment between Pluto’s time cycle and the vibrational price degree. When planetary time meets price, it forms a cosmic convergence zone—a point of natural balance where the market is highly likely to react. So, I wasn’t just guessing—I was waiting for that moment of planetary resonance.
And as the chart clearly shows, the market reacted sharply the moment it touched 19,384.6, confirming the sensitivity of this degree. It wasn’t random. It was a harmonic response, echoing the laws of cosmic vibration that Gann so strongly emphasized.
This is a real-time example of how combining planetary time with price geometry can give you a decisive trading edge, especially in forecasting major turning points.
Why This Method Works
The market respects these planetary degrees not because of mysticism, but because it moves in cycles—natural cycles that repeat. The alignment of price with planetary longitude often marks pivot points in the market.
And this method doesn’t just help with identifying reversals. It also enhances your entry and exit timing, allowing you to trade with confidence, knowing you're aligned with the larger cosmic structure that influences all things—including financial markets.
Final Thoughts
This is just one example of how planetary geometry, when applied correctly, can lead to powerful trade setups. While Pluto offers long-term signals, don’t underestimate the value of the Moon, Mars, or Jupiter for shorter timeframes. The market dances to their rhythm too.
And once you learn to listen to that rhythm, you'll never look at price the same way again.

US100 (4H): Short Position OpportunityHello Traders.
You may find more details in the chart!
Good Luck!
TP1: 18250
TP2: 17500
TP3: 16550
Please support with a like or comment if you find this analysis useful.❤️

NSDQ100 China to Hike Tariffs on All US Goods – Market MixedChina to Hike Tariffs on All US Goods – Market Reaction Mixed
China announced it will raise tariffs on all US imports from 84% to 125%, effective April 12. The move follows Washington’s decision to increase levies on Chinese goods to 145% earlier this year.
However, Beijing signaled it will no longer respond to future US tariff increases, calling the back-and-forth “a joke,” suggesting a shift in tone from retaliation to dismissal.
Market Reaction:
USD: The dollar weakened further following the announcement, reflecting rising trade tensions and risk-off sentiment.
Equities: US futures turned lower as traders priced in the potential economic drag from escalating tariffs.
Gold: Continued to rise, reinforcing its role as a preferred safe-haven amid geopolitical uncertainty.
US Treasuries: Traditionally seen as a safe-haven, Treasuries underperformed, suggesting investor confidence in them may be weakening under mounting fiscal and trade concerns.
Analysis:
Markets are increasingly pricing in the fallout from an intensifying US-China trade standoff. The rise in gold and the dip in Treasuries suggest a shift in investor preference toward alternative safe-haven assets. If trade tensions continue to escalate, further downside in risk assets and USD strength reversal are possible.
Key Support and Resistance Levels
Resistance Level 1: 19000
Resistance Level 2: 19552
Resistance Level 3: 19873
Support Level 1: 17254
Support Level 2: 16773
Support Level 3: 16400
This communication is for informational purposes only and should not be viewed as any form of recommendation as to a particular course of action or as investment advice. It is not intended as an offer or solicitation for the purchase or sale of any financial instrument or as an official confirmation of any transaction. Opinions, estimates and assumptions expressed herein are made as of the date of this communication and are subject to change without notice. This communication has been prepared based upon information, including market prices, data and other information, believed to be reliable; however, Trade Nation does not warrant its completeness or accuracy. All market prices and market data contained in or attached to this communication are indicative and subject to change without notice.


Nasdaq 100 to 17000On the above 3-day chart price action has corrected 33% since late December. A number of reasons now exist to be bullish, including:
1) The ‘incredible buy’ signal has printed. Look left.
2) The buy signal is coming in at 81% probability. The previous were 75%, 72@, & 72% percent, respectively. Look at the strength of if a 75% recovery, what do you think a 81% will be like? This can only be the result of a massive short squeeze, in my opinion.
3) Price action has just printed a ‘double bottom’ (orange line) on past support / resistance - look left!
4) Most recently price action has broken out of a bullish falling wedge formation with back test confirmation, see below.
Is it possible price action falls further? For sure.
Is it probable? No.
Good luck!
Ww
A little closer

NO TRADE DAYWhen the day is like this, I believe scalpers had their meat, but coming home at the time that this post is sent, I cannot even scalp this, my pyschology is all over the room and seeing a chart that wants me to over analyze it to avoid ruining my strategy, I am not in. Happy Trading


Nasdaq High Impact Analysis (Stock Market Crash)we are looking at a stock market crash.
high valuations of tech companys (nvidia, apple, microsoft, tesla etc)
a synthetic covid scenario, same news, same playouts, same situations playing out.
1995 - 2001 dot.com bubble playing out
we projecting a bottoming of 10 000
we projecting a high of 30 000
the whole scenario is re balancing the tech sector
alot more downward pressure before we see a bottom / buy the dip kind of playout.
