Early Morning Prediction for Nas100This is my pre-open prediction for the day. I expect a very bullish market slow and steady to the 19k or at least to April 9-10's high. and possibly set up for a breakout of good place to make money on the retracement afterwards.
USTEC trade ideas

NASDAQ Long Wave 5 Targeting Supply Zone, Then Looking to ShortI’m currently holding long positions from the end of Wave 2 (entry around 16,849). I took partial profits after Wave 3 (around 19,000–19,200) and now waiting for 4H TF Wave 4 to pull back and give a re-entry.
Once Wave 4H TF Wave 4 completes, I plan to scale back in and target the 19,500–19,900 zone.
If price reaches that zone and shows rejection, I’ll look to switch bias and short as I believe that will begin a daily Wave 2 correction to the downside.
Key levels I’m watching:
• Wave 2 support: 16,849
• Wave 3 resistance zone / TP1: 19,000 area
• Wave 5 supply zone / Final TP: 19,500–19,900
• Sell zone if confirmed reversal: 19,500–20,000
• Next short target (after confirmation): TBD once Wave 5 completes
Will update this idea as Wave 4 forms and price action confirms the next leg.

Market on Edge: Tariffs, Tension, and Market Turmoil(The following is for informational purposes only and reflects personal opinions, not investment advice. Please exercise your own judgment before making any financial decisions.)
In the coming weeks, the U.S. stock market is likely to remain driven by news flow, with investors closely watching the Trump administration’s policies on tariffs.
Last week, market sentiment remained extreme fearful as the impact of the tariff measures continued to ripple through the markets. The U.S. bond market sell-off prompted President Trump to announce on Wednesday a 90-day delay on tariff implementation for countries other than China. This announcement triggered a sharp market rebound that forced many short sellers to cover their positions. However, as the tariff delay did not fundamentally resolve the underlying uncertainty surrounding trade policies, the market failed to sustain its gains on Thursday and Friday.
At present, U.S.-China trade tensions continue to escalate, and no successful trade agreement has been announced yet. The market is seeking more concrete positive developments—such as tax cuts from the Trump administration, or the signing of trade agreements with major economies that include tariff reductions—before uncertainty can be lifted and a meaningful rebound achieved.
For now, it is better to remain patient and let the news develop, with minimal trading activity. Market direction will largely depend on future actions from the Trump administration and the Federal Reserve, making it difficult to rely on technical analysis alone to determine the market trend.
Currently, the 19,988–20,382 range serves as a critical resistance zone. A breakout above 20,382, sustained over time, would indicate that bulls are gaining control. Conversely, if the price stays consistently below 20,275, it suggests that bears remain dominant.
Until clear, favorable news emerges, further downside in the market is possible. However, shorting at these levels also carries significant risk, as any policy shift or positive announcement from Trump could trigger another sharp rebound—similar to what occurred last Wednesday.

NASDAQ 19200 POTENTIAL BREAKOUTKey important level holding 18k after important catalyst 90 days tariffs pause.
Looking this levels, for a major move in next weeks

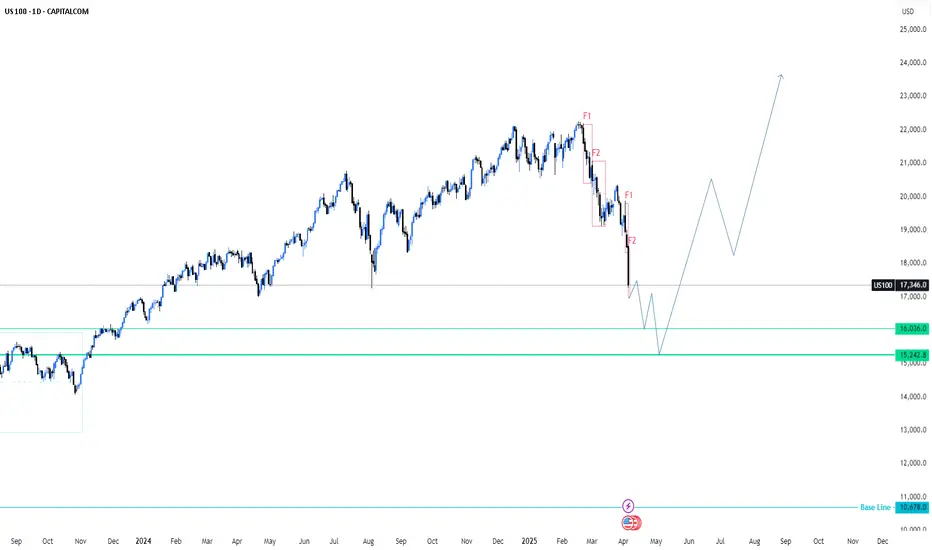
US100 (NASDAQ) Trade Idea 📊 US100 (NASDAQ) Trade Idea: Critical Support Test & Potential Reversal Setup
🔍 Key Levels & Context:
The US100 is currently testing a significant support zone between 16,000–17,000, which has historically acted as a springboard for rallies (see 2023 bounce). A breakdown below 16,000 would suggest a deeper correction toward 15,242 (next support) or even 14,000, while holding above 17,000 could keep the bullish structure intact.
🎯 Profit Targets (If Bullish Reversal Confirmed):
Initial Target: 19,000 (Previous resistance → now potential support-turned-resistance)
Secondary Target: 20,000–21,000 (Psychological level & measured move from consolidation)
Stretch Target: 23,000–24,000 (All-time high retest, Fibonacci extension confluence)
📉 Bearish Scenario (If Support Fails):
A close under 16,000 opens the door to 15,242 (2023 swing low)
Short-term rallies into 17,500–18,000 could then become sell opportunities.
So I think the US100 pursues the following projection, and I'd be happy if you share your thoughts 🫡
#Trading #NASDAQ #US100
NASDAQ Elliott Wave Analysis – Wave 4 Pullback in PlayNASDAQ is currently reacting to a major support zone, aligning with the Elliott Wave structure. Based on this analysis, we are in the midst of a Wave 4 pullback, which is expected to complete soon. Once Wave 4 finds its base, we anticipate a strong impulsive move to the upside—Wave 5—pushing us toward a new all-time high (AHT).
📉 Watching for confirmation of support holding before entering long.
📈 Targeting a continuation toward new highs following the completion of this corrective phase.

Long NQ FuturesLooking for a 50% retracement back to roughly the 19300 level. Will likely be a bumpy ride up, with the first test of resistance at 18300 (minor wave A), back down to the bottom of the gap at 16900 (minor wave B), and then back up to 19300 (minor wave C).
Expecting to reverse short once 19300 is reached, but will evaluate further if and when target is reached.

"NAS100/US100" Index Market Money Heist Plan (Day / Scalping)🌟Hi! Hola! Ola! Bonjour! Hallo! Marhaba!🌟
Dear Money Makers & Robbers, 🤑💰✈️
Based on 🔥Thief Trading style technical and fundamental analysis🔥, here is our master plan to heist the "NAS100/US100" Index CFD Market. Please adhere to the strategy I've outlined in the chart, which emphasizes short entry. Our aim is the high-risk Green MA Zone. Risky level, oversold market, consolidation, trend reversal, trap at the level where traders and bullish robbers are stronger. 🏆💸"Take profit and treat yourself, traders. You deserve it!💪🏆🎉
Entry 📈 : "The heist is on! Wait for the MA breakout then make your move at (16400) - Bearish profits await!"
however I advise to Place sell stop orders above the Moving average (or) after the Support level Place sell limit orders within a 15 or 30 minute timeframe most NEAREST (or) SWING low or high level.
📌I strongly advise you to set an "alert (Alarm)" on your chart so you can see when the breakout entry occurs.
Stop Loss 🛑: "🔊 Yo, listen up! 🗣️ If you're lookin' to get in on a sell stop order, don't even think about settin' that stop loss till after the breakout 🚀. You feel me? Now, if you're smart, you'll place that stop loss where I told you to 📍, but if you're a rebel, you can put it wherever you like 🤪 - just don't say I didn't warn you ⚠️. You're playin' with fire 🔥, and it's your risk, not mine 👊."
📌Thief SL placed at the nearest/swing High or Low level Using the 4H timeframe (17300) Day/Scalping trade basis.
📌SL is based on your risk of the trade, lot size and how many multiple orders you have to take.
Target 🎯: 15300 (or) Escape Before the Target
"NAS100/US100" Index CFD Market Heist Plan (Scalping / Day Trade) is currently experiencing a Bearish trend.., driven by several key factors.👇👇👇
📰🗞️Get & Read the Fundamental, Macro, COT Report, Geopolitical and News Analysis, Sentimental Outlook, Intermarket Analysis, Index-Specific Analysis, Positioning and future trend targets... go ahead to check 👉👉👉🔗🔗
Detailed Explanation 📝
Fundamentals: Growth stalls 📉, valuations adjust—bearish shift 🐻.
Macro: Cooling economy 🌍, sticky inflation 🔥—downward pressure.
COT: Speculators flee 📉, hedgers dig in—bearish signal 🐻.
Index: Correction deepens 📉, support tests near—technical bear 🐻.
Intermarket: Yields/USD crush risk assets 💪—bearish tide.
Geopolitical: Trade wars ⚔️, regulation 🔍—negative catalysts pile up.
Sentiment: Fear takes hold 😟—bearish consensus builds.
Trends: Near/medium-term declines 📉, long-term hinges on recovery ⚖️.
Outlook: Moderately bearish 🌩️—tough sledding ahead.
⚠️Trading Alert : News Releases and Position Management 📰 🗞️ 🚫🚏
As a reminder, news releases can have a significant impact on market prices and volatility. To minimize potential losses and protect your running positions,
we recommend the following:
Avoid taking new trades during news releases
Use trailing stop-loss orders to protect your running positions and lock in profits
💖Supporting our robbery plan 💥Hit the Boost Button💥 will enable us to effortlessly make and steal money 💰💵. Boost the strength of our robbery team. Every day in this market make money with ease by using the Thief Trading Style.🏆💪🤝❤️🎉🚀
I'll see you soon with another heist plan, so stay tuned 🤑🐱👤🤗🤩

short in this week hi guys the target is the line blue I'm already holding my trade to the target if u want to look for other trade today be patience wait confirmation and good luck i just show u the target of this week maybe today maybe tomorrow but we must hit the target
any Q feel free

Possible move for nasdaqI had to redraw my channels from my last view. Sometimes we really have to zoom out to get the bigger picture.....I believe we may have entered a bear phase for the market. I have noted the important levels on the chart. I have outlined the possible path the market might take...There are plenty of untested levels below where massive buy orders are sitting. Of course it will not get there in a day or 2. But it is very clear where bears are sitting. Bear market bull rallies are also quite strong and might give an impression that we will go to ATH. But there is a reason why channels work most of the time at least from a long term perspective. This is merely a conjecture, but if you view the larger time frame as a 5 min chart, you know what moves might take place. I'm not advocating a full blown market crash, but we might get to see lower highs and lower lows over the next few months.....I could be completely wrong on this....For investors these are the best levels to enter big, for day traders...well...vix is still elevated and we trade the day whether it is bullish or bearish...So keep your position size smaller than usual as you will need a wider SL. Trade small, trade safe....Investors can start accumulating good stocks bit by bit and average out with every 10-15% dip, of course in smaller amounts....As we don't know when a bottom will happen...

US NAS100Preferably suitable for scalping and accurate as long as you watch carefully the price action with the drawn areas.
With your likes and comments, you give me enough energy to provide the best analysis on an ongoing basis.
And if you needed any analysis that was not on the page, you can ask me with a comment or a personal message..
Enjoy Trading... ;)

us100tariffs there, think there should be a retest, if support broke then all the way to near tp.
US market opening soon.


Understand Trump tariff war, Assess if market rebound is likelyIf you want to better understand Trump’s strategy for the tariff war and the underlying intentions—especially to assess whether a rapid market rebound is likely—you may refer to a paper by Trump’s economic advisor Stephen Miran, titled “A User’s Guide to Restructuring the Global Trading System.”
Here’s a brief summary of the key points from the paper regarding the trade war:
1. Market Volatility Is Anticipated
The paper acknowledges that sharply raising tariffs may trigger financial market turbulence, increase uncertainty, lead to rising inflation, potential interest rate hikes, and a stronger U.S. dollar—all of which could cause broader ripple effects. (In other words, the Trump administration is aware that such moves will shake the markets.)
2. Second Term: Focus Shifts to Legacy
While Trump and his team prioritized stock market performance during the first term, in a second term—when re-election is no longer a concern—he may focus more on leaving a political legacy. This includes reshoring manufacturing, tax reform, reducing national debt, and shrinking the trade deficit.
3. Tariffs as a Strategic and Fiscal Tool
This new round of tariffs serves not only as a pressure tactic , but also as a potential revenue source to fund Trump’s desired tax cuts. As such, the Trump administration may not rush to finalize new trade deals. Instead, tariff reductions would likely occur gradually, and only after securing substantial economic benefits.
4. Trade and Security Will Be Linked
Future trade negotiations will likely tie economic cooperation to national security. The U.S. could use a dual standard—“tariffs + security”—to compel other nations to follow U.S.-defined trade and geopolitical rules.
For example: Countries might be forced to join a tariff alliance against China. In exchange for market access, they would either have to tax Chinese goods or accept high U.S. tariffs and reduced security cooperation. For the EU, if it does not meet U.S. demands, tariffs would become a key revenue stream for the U.S., while freeing up American resources to focus on China’s rise rather than spending time and money on European security.
5. Big Picture Strategy: Build a Global “Tariff Wall”
This paper lays out a grand strategy to use tariff warfare to pressure countries into forming a global “tariff wall” encircling China, aimed at constraining China’s economic influence.
Strategic Implications
Based on this approach, the U.S. goal in trade negotiations is not merely tariff reductions or market access, but achieving:
1. Market access for U.S. goods via lowered barriers abroad.
2. Adoption of U.S.-led trade and geopolitical rules, including encircling China and sidelining nations like Iran and Russia.
3. Increased U.S. government revenue— meaning tariffs might persist throughout Trump’s term and not be eliminated outright!
Market Outlook
If the U.S. follows this roadmap, it’s unlikely that a consensus with China or other China-dependent economies (like the EU) will be reached quickly. This suggests that market volatility could persist for some time if these strategies are enacted.
Given the current asset declines showing signs of a liquidity crunch, without a clear positive catalyst (e.g., successful trade deals, tax cuts, or rate cuts), it may be difficult for equities, crypto, or even gold to see a meaningful rebound in the short term.
As markets remain highly sensitive to news, it’s crucial to focus on risk control in trading and consider reducing position sizes when needed.
Let’s keep the discussion going—what do you think about the future direction of U.S. trade policy under Trump?

Bottom Fishing In Tariff Waterfall!A quick visual guide for NASDAQ.
This analysis is based on Alan H. Andrews action reaction method.
thanks for watching.

Nasdaq Short: Adjustment in Primary Wave CountsI've made changes to my original wave count where wave A has ended on a short 5th wave. However, the strength of the rally today made me revisit the counts itself and I realised that it is actually more appropriate for the 5th wave to extend.
I studied if there is a relationship if I moved the original 5th wave down 1 degree to become a 1st of 5th and I was truly taken aback when the relationship was crystal clear and staring at me but I was too blind to see it (actually, I was too busy at work to study the charts again which is why I only publish this 2 days later).
Now that Wave A has completed, the strong rally these 2 days can be easily accepted. Are we going into a wave C crash? I believe so. So sit tight and enjoy the ride!
Remember to keep your risk tight. I can be wrong (as I often do).
Good luck!

NDX CURRENT STATUSAnother index insight on a monthly chart. Elliott Wave patterns clear as day. QQE Signals a free indicator that does an amazing job for confluence.

$SPX $NAS100 FILL THE GAP = "LEARNED BEHAVIOR" IN PLAY🏒🏒🏒🏒🏒FILL THE GAP! FILL THE GAP! FILL THE GAP!
Hopefully, institutions want to reach 7,000 from here, as the majority of them wrote in public New Year resolutions.
A great example of learned behavior.
Let’s watch.
FILL THE GAP! FILL THE GAP! FILL THE GAP!🏒🏒🏒🏒🏒

Market outlook on NasdaqI think the Nasdaq will retest the recent low and it is likely to break and get to fib extension 14500-15000

To new ATHs?After a sharp drop, the price has been rejected at 16300. In my opinion, the fall has nothing to do with the presidency of the United State, rather a perfect opportunity for the investors to buy the dip. The last two HLs on monthly time frame were printed in March 2020 ( Worldwide Pandemic) and Oct 2022. Since then, Nasdaq has been going up steadily and making HHs and HLs on daily and weekly. Now, in April 2025 another HL has been printed on monthly and I think that market might be on it's way to make new ATHs in coming weeks and months and even years.

ABC Correction on nas100!Trading plan
SL:20,448.6
TP:17,000 / floating
Trading set up
(ABC) correction
A-Wave: Initial sharp decline with increasing volume, breaking short-term support.
B-Wave: Temporary recovery (typically 50-61.8% retracement) with lower volume.
C-Wave: Final decline, typically final capitulation, targeting major support and weekly moving averages or 1,618 fib level around 17,000 level as target price for correction
reasoning:
Trade war, trump tariff ,geopolitical issue and stocks has been overpriced for the last couple of months.

Nasdaq trading insights: 08-APRIL-2025Nasdaq trading insights: Not signals, but informative zones to aid your decision-making. Please note: These zones are not trading advice. Use them as a starting point for your own analysis.

monday long opportunity for nasdaq1. From the daily chart perspective, I believe a short-term bottom has already formed, but the stop-loss level is too far for a long position, so it’s better to seek a low-entry buy. Last Friday, it reached a support level, but I wasn’t firm enough so i didn't enter. BUtT, we can PATIENTLY wait for a lower point to buy here.
monday plan:
On the 1-hour timeframe, resistance is at 19100-19300 (which is also the 4-hour resistance), and support is at 18200-17800.
Look for buying opportunities on Monday, with real-time updates afterward, stop-loss at 17600.
TARGET IS 19100-19300.
If price goes up directly, i will wait 19100-19300 for a short opportunity instead.
