NDX CURRENT STATUSAnother index insight on a monthly chart. Elliott Wave patterns clear as day. QQE Signals a free indicator that does an amazing job for confluence.
USTEC trade ideas

$SPX $NAS100 FILL THE GAP = "LEARNED BEHAVIOR" IN PLAY🏒🏒🏒🏒🏒FILL THE GAP! FILL THE GAP! FILL THE GAP!
Hopefully, institutions want to reach 7,000 from here, as the majority of them wrote in public New Year resolutions.
A great example of learned behavior.
Let’s watch.
FILL THE GAP! FILL THE GAP! FILL THE GAP!🏒🏒🏒🏒🏒

NASDAQ: Wave Analysis & Forecast for April-MayHello, traders! Let’s analyze the current wave structure of the NASDAQ index.
At the moment, there is a high probability that the index is forming wave C of a correction. Most likely, this is a horizontal expanded correction.
✅ Sub-wave 1 of wave C has already formed.
✅ Sub-wave 2 is also likely completed.
On Friday, the index showed a strong decline and closed at the day’s lows, indicating a high probability of further downside movement next week.
What’s next?
We expect the formation of the third sub-wave within wave C. Most likely:
🔻 The index will continue to decline toward 17,700, where the 38% Fibonacci level is located.
🔻 The key support zone is 17,300.
🔻 After a short correction, the decline may extend to 16,300.
🔻 In a deeper scenario – down to 15,700-15,000.
Technical factors
⚡ The price failed to break above the 200-day moving average, bounced off it, and started declining.
⚡ The next major support is the 200-week moving average, around 16,200.
⚡ Throughout April – May, the market is likely to remain in a correction phase.
Once key levels are reached, we expect a potential reversal and new highs in the second half of 2025.
Stay tuned and share your thoughts in the comments!

Nasdaq trading insights: 08-APRIL-2025Nasdaq trading insights: Not signals, but informative zones to aid your decision-making. Please note: These zones are not trading advice. Use them as a starting point for your own analysis.

NQ: Upcoming Weekly Analysis!FA Analysis:
ST/MT/LT Outlook: Sell
1- Tariffs came into effect on April 2nd and market reacted badly to it. This was completely expected.
2- NFP data came green but market ignored it and continued the sell-off. This tells you the fundamental change in market expectations vis-a-vis US market! So bad data will be bad for equities and good data will be also bad.
3- This week, we've CPI, PPI and Consumer sentiment as major key data. They'll be fuel to the current fire.
4- The FED was tacit and still data related. The FED is running a risk of a late intervention!
5- Additional retaliations from the rest of the world are also expected. USA is isolating itself from the world economy; the damage is here to stay even if Trump cancel those tariffs or deregulate or cut taxes.
TA Analysis:
Weekly TF:
We got a strong bearish weekly close. A gap down should be added to the weekly candle.
A continuation down is expected.
Daily TF:
NQ provided one of the largest daily candle. Market was down until the last minute Friday! There is no interest to buy the dip at all!
A gap down is expected.
In the case of a gap, price might close the gap and continue down.
Hope we get some retrace to join the sell side during NY session.
Happy week with a lot of green pips!

Nasdaq insights: 10-APRIL-2025Rise and shine, traders! Start your day with actionable Nasdaq insights. Let's grow your skills together, one chart at a time.

Nasdaq market analysis: 09-APRIL-2025Good morning, traders! Welcome to today's Nasdaq market analysis. Compare my price action insights with your own charts and enhance your trading skills.

NAS100 short setup alert!Hello traders,
I've identified a prime shorting opportunity on NAS100! As noted in my previous analysis, the index remains under bearish pressure, driven by Apple’s stock decline.
On March 28, 2025, NAS100 broke below 19,100 support zone, confirming strong downside momentum. It then retraced to 19,500, filling an imbalance before facing a rejection.
📉 Trade Setup:
🔻 Sell Zone: 19,200 – 19,350
🎯 Target 1: 18,800
🎯 Target 2: 18,297
🛑 Stop Loss: 19,564
Stay disciplined, trade smart, and secure those profits! 🚀📊

US 100 supply demand areas short termOn the news, we entered short term supply around 19000-19300 with demand bellow at around 17000. Possible swing.

US100 - Weekend Gap Filled, What’s Next?The US100 1-hour chart shows that the weekend gap has been completely filled, and price is now approaching a critical Fair Value Gap (FVG) zone. This level could act as a strong resistance or a point of continuation for the current bullish momentum.
Here are two possible scenarios:
✅ Scenario 1: If price consolidates above the FVG and finds support, we could see a continuation towards the 0.618-0.65 Fibonacci retracement level, pushing towards 19,800+.
❌ Scenario 2: A rejection at the FVG zone could signal a bearish reversal, leading to a move back down towards 19,200 or even lower.
Which scenario do you think will play out? Let’s discuss! 🚀📉

NAS100: Buyers Stepping InSeems like the bearish move is over, market showing signs of a potential shift. Rising volume and buyer activity suggest a possible bullish move or relief rally

Death Cross forming now on NDX weekly chartHi Renny here back with a chart for you guys to check out.
50 dma can be seen to be crossing below the 200 dma.
Look what happened after the last time that happened in 2022...
You would have done well to take money off the table the last time the 50 dma crossed below the 200 dma.
What's your take? Is there more downside from here?

NASDAQ Long H1- Divergence on H1
- Long on breakout of LH
- Volatility gone high and now it will reverse.
- If candlestick pattern forms strong bullish we can take trade as without leverage.

"NAS100/US100" Index Market Money Heist Plan (Day / Scalping)🌟Hi! Hola! Ola! Bonjour! Hallo! Marhaba!🌟
Dear Money Makers & Robbers, 🤑💰✈️
Based on 🔥Thief Trading style technical and fundamental analysis🔥, here is our master plan to heist the "NAS100/US100" Index CFD Market. Please adhere to the strategy I've outlined in the chart, which emphasizes short entry. Our aim is the high-risk Green MA Zone. Risky level, oversold market, consolidation, trend reversal, trap at the level where traders and bullish robbers are stronger. 🏆💸"Take profit and treat yourself, traders. You deserve it!💪🏆🎉
Entry 📈 : "The heist is on! Wait for the MA breakout then make your move at (16400) - Bearish profits await!"
however I advise to Place sell stop orders above the Moving average (or) after the Support level Place sell limit orders within a 15 or 30 minute timeframe most NEAREST (or) SWING low or high level.
📌I strongly advise you to set an "alert (Alarm)" on your chart so you can see when the breakout entry occurs.
Stop Loss 🛑: "🔊 Yo, listen up! 🗣️ If you're lookin' to get in on a sell stop order, don't even think about settin' that stop loss till after the breakout 🚀. You feel me? Now, if you're smart, you'll place that stop loss where I told you to 📍, but if you're a rebel, you can put it wherever you like 🤪 - just don't say I didn't warn you ⚠️. You're playin' with fire 🔥, and it's your risk, not mine 👊."
📌Thief SL placed at the nearest/swing High or Low level Using the 4H timeframe (17300) Day/Scalping trade basis.
📌SL is based on your risk of the trade, lot size and how many multiple orders you have to take.
Target 🎯: 15300 (or) Escape Before the Target
"NAS100/US100" Index CFD Market Heist Plan (Scalping / Day Trade) is currently experiencing a Bearish trend.., driven by several key factors.👇👇👇
📰🗞️Get & Read the Fundamental, Macro, COT Report, Geopolitical and News Analysis, Sentimental Outlook, Intermarket Analysis, Index-Specific Analysis, Positioning and future trend targets... go ahead to check 👉👉👉🔗🔗
Detailed Explanation 📝
Fundamentals: Growth stalls 📉, valuations adjust—bearish shift 🐻.
Macro: Cooling economy 🌍, sticky inflation 🔥—downward pressure.
COT: Speculators flee 📉, hedgers dig in—bearish signal 🐻.
Index: Correction deepens 📉, support tests near—technical bear 🐻.
Intermarket: Yields/USD crush risk assets 💪—bearish tide.
Geopolitical: Trade wars ⚔️, regulation 🔍—negative catalysts pile up.
Sentiment: Fear takes hold 😟—bearish consensus builds.
Trends: Near/medium-term declines 📉, long-term hinges on recovery ⚖️.
Outlook: Moderately bearish 🌩️—tough sledding ahead.
⚠️Trading Alert : News Releases and Position Management 📰 🗞️ 🚫🚏
As a reminder, news releases can have a significant impact on market prices and volatility. To minimize potential losses and protect your running positions,
we recommend the following:
Avoid taking new trades during news releases
Use trailing stop-loss orders to protect your running positions and lock in profits
💖Supporting our robbery plan 💥Hit the Boost Button💥 will enable us to effortlessly make and steal money 💰💵. Boost the strength of our robbery team. Every day in this market make money with ease by using the Thief Trading Style.🏆💪🤝❤️🎉🚀
I'll see you soon with another heist plan, so stay tuned 🤑🐱👤🤗🤩

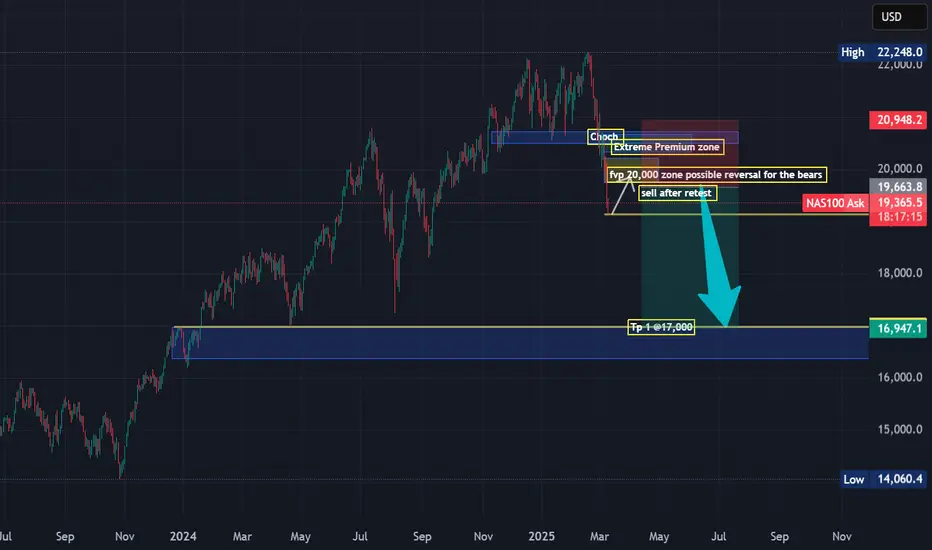
@Nas Bears seeks The 17,000 handle as Recession fears spark sellfor Mexico, Canada, and the U.S. due to the turbulent rollout of Trump tariffs, which has created significant uncertainty for businesses and policymakers.
Concerns over inflation in the U.S., which were already growing, have intensified, making it more likely that the Federal Reserve will hold off on policy changes for the foreseeable future. Meanwhile, the risk of recession is increasing across all three countries, and that was witnessed On Monday as wallstreet painted its boards with Red arrows which was not a good sign that being said am anticipating that the Bearish rally will continue till we mitigate @17,000 handle.
waiting for Retest @20,000 Before the bears come in
Tp.17,000 which will be some days to come from today.
NasqaqAll our World busy on Tarrif but after many weeks Nasdaq now at Attractive zone .
Plz don't add new sell position here .
Grab this Opportunity

NQ: Uncertainty after the bloodbath!Good day!
Yesterday close was irrelevant: Uncertainty, indecision and inside the previous huge candle. Until clear direction, we've today Trump's ultimatum to China with additional 50% tariffs if China does not step back with its retaliation of 34%. China has additional tools: sell US Treasuries which trigger a crise worldwide and particularly in USA.
Along this, we've some cracks within Trump billionaires, including E. Musk, who start showing frustration with tariffs.

NSDQ100 INTRADAY oversold bounce backDonald Trump’s new reciprocal tariffs are now in place, adding pressure to the global economy as he aims to reshape international trade. Unlike past moves, China hasn’t responded immediately, marking a shift from its usual quick retaliation.
European and Japanese stocks fell on rising trade tensions, while U.S. futures remain steady ahead of the open. According to Goldman Sachs’s John Flood, the S&P 500 has dropped to a level where long-term investors are beginning to step in.
Key Support and Resistance Levels
Resistance Level 1: 18130
Resistance Level 2: 18520
Resistance Level 3: 19000
Support Level 1: 16387
Support Level 2: 16000
Support Level 3: 15490
This communication is for informational purposes only and should not be viewed as any form of recommendation as to a particular course of action or as investment advice. It is not intended as an offer or solicitation for the purchase or sale of any financial instrument or as an official confirmation of any transaction. Opinions, estimates and assumptions expressed herein are made as of the date of this communication and are subject to change without notice. This communication has been prepared based upon information, including market prices, data and other information, believed to be reliable; however, Trade Nation does not warrant its completeness or accuracy. All market prices and market data contained in or attached to this communication are indicative and subject to change without notice.
Russell 2000 INTRADAY oversold bounce back
Key Support and Resistance Levels
Resistance Level 1: 1889
Resistance Level 2: 1920
Resistance Level 3: 2000
Support Level 1: 1700
Support Level 2: 1640
Support Level 3: 1590
This communication is for informational purposes only and should not be viewed as any form of recommendation as to a particular course of action or as investment advice. It is not intended as an offer or solicitation for the purchase or sale of any financial instrument or as an official confirmation of any transaction. Opinions, estimates and assumptions expressed herein are made as of the date of this communication and are subject to change without notice. This communication has been prepared based upon information, including market prices, data and other information, believed to be reliable; however, Trade Nation does not warrant its completeness or accuracy. All market prices and market data contained in or attached to this communication are indicative and subject to change without notice.

"NAS100 / US100" Index CFD Market Heist Plan (Day or Swing)🌟Hi! Hola! Ola! Bonjour! Hallo! Marhaba!🌟
Dear Money Makers & Robbers, 🤑 💰💸✈️
Based on 🔥Thief Trading style technical and fundamental analysis🔥, here is our master plan to heist the "NAS100 / US100" Index CFD Market. Please adhere to the strategy I've outlined in the chart, which emphasizes long entry. Our aim is the high-risk Red Zone. Risky level, overbought market, consolidation, trend reversal, trap at the level where traders and bearish robbers are stronger. 🏆💸"Take profit and treat yourself, traders. You deserve it!💪🏆🎉
Entry 📈 : "The heist is on! Wait for the MA breakout (20000) then make your move - Bullish profits await!"
however I advise to Place Buy stop orders above the Moving average (or) Place buy limit orders within a 15 or 30 minute timeframe most recent or swing, low or high level.
📌I strongly advise you to set an alert on your chart so you can see when the breakout entry occurs.
Stop Loss 🛑:
Thief SL placed at the recent/swing low level Using the 1H timeframe (19400) swing trade basis.
SL is based on your risk of the trade, lot size and how many multiple orders you have to take.
🏴☠️Target 🎯: 20800 (or) Escape Before the Target
🧲Scalpers, take note 👀 : only scalp on the Long side. If you have a lot of money, you can go straight away; if not, you can join swing traders and carry out the robbery plan. Use trailing SL to safeguard your money 💰.
"NAS100 / US100" Index CFD Market Heist Plan (Swing/Day) is currently experiencing a bullishness,., driven by several key factors.
📰🗞️Get & Read the Fundamental, Macro, COT Report, Geopolitical and News Analysis, Sentimental Outlook, Intermarket Analysis, Index-Specific Analysis, Positioning and future trend targets.. go ahead to check 👉👉👉
📌Keep in mind that these factors can change rapidly, and it's essential to stay up-to-date with market developments and adjust your analysis accordingly.
⚠️Trading Alert : News Releases and Position Management 📰 🗞️ 🚫🚏
As a reminder, news releases can have a significant impact on market prices and volatility. To minimize potential losses and protect your running positions,
we recommend the following:
Avoid taking new trades during news releases
Use trailing stop-loss orders to protect your running positions and lock in profits
💖Supporting our robbery plan 💥Hit the Boost Button💥 will enable us to effortlessly make and steal money 💰💵. Boost the strength of our robbery team. Every day in this market make money with ease by using the Thief Trading Style.🏆💪🤝❤️🎉🚀
I'll see you soon with another heist plan, so stay tuned 🤑🐱👤🤗🤩


NQ: ST consolidation is expectedGood day!
After the 90-day pause of the tariffs, NQ should consolidate in the ST (2-3 days) before resuming the fundamental downtrend.
The effect of CPI and PPI will be very limited whatsoever the data. However Consumer data will trigger the downtrend if this data is undershoot. Otherwise, consolidation will prevail.
The blue box should delimitate the consolidation area.

US Technology Companies at Great Risk #NDX US Technology Companies at Great Risk
Let's take a look from a fundamental and technical perspective;
If the protests against Trump, who has been in the presidential seat for 3 months, gain strength and reach a level that disrupts economic activity, uncertainty pricing increases in the markets .
Technology-weighted indices such as NASDAQ sell faster in such periods of uncertainty because they are in the ‘risky asset’ class.
The FED's interest rate cut expectations were first postponed, and now the possibility of cancellation is on the table. This creates negative pressure for technology stocks.
2025 Q1 balance sheets have not yet been fully announced. However, growth rates are slowing in many major technology companies, which means an extra threat to NASDAQ.
Let's take a look at the scenarios that could happen this week;
🔴 Protests increase, if the security problem grows:
NDX may fall below 16,700 again.
If panic sales come into play, there may be a decline to around 15,000.
🟢 If protests are quickly brought under control:
Buying comes from 17,000 level, reaction rise starts.
18.500 - 19.000 band can be retested.
🔸This week there was a very sharp decline of -9.77
🔸It is currently at 17.397 , which corresponds to the middle band of the logarithmic channel (black dashed line).
🔸 16,764 - Persistence below this level may lead to sharper selling.
🔸If the price closes weekly below 17,000 , stronger support around 15,000 may be tested.
🔸This decline may also cause large investors to switch to ‘risk off’ mode.

NAS100 15M BREAKOUT PLAYMarket is currently trading with in a horizontal channel. We must wait for proper breakout before placing a trade.
