$nq (nasdaq)1k points drop ahead of fomcSEED_ALEXDRAYM_SHORTINTEREST2:NQ is about to drop by a thousand points ,buyers are being trapped and early sellers are getting taken out of the market. $16139
USTEC trade ideas

NASDAQ New Week Gap will tell you everything you need to knowIf you watched my idea update from Friday, I was saying that the sellside monthly lows as well as the 2023 yearly high are being targeted.
Low and behold, we hit all targets on the weekly gap drop. Let's see how price approaches the new week opening gap mid level (dashed white). It will definitely hit that level before the end of the week.
If it does not, that means we have super easy sellside targets to hit after a clear rejection back below tested highs as always.
Share this with someone needing easy targets 🎯

Us100 updateHi traders what is your opinion this week a sell or a buy,according to the strategy n my view,the target is 168 which is likely to hit n am expecting bull run to take over from this 2023 highs soo note that am positioning my self for big move,first thing this market is n uptrend market with weird n normal pull back this one was abnormal do to trade war which it's still going on,soo guys this all sell off is not a threat it is giving you a chance to ride long trades what you have to do is to generate liquidity into position n make sure you hold your trades for big rewards,before you overthink I identify the trend n find the really trend beside pull back understand what is moving n why I am going to buy,note that we are 6% away to recession do me favour invest in knowledge soo that you can be in high level of thinking and seeing things n not overthinking everything knowledge is power,I wish you all profitable week ahead.

NASDAQ tanks below key levels amid new Trump tariffs!The market free-falls as Trump's new tariffs send shockwaves through global sentiment.
Sellers are piling in — but it's the fear of economic fallout that's truly fuelling this drop.
The NAS100 has broken through major support zones with strong bearish momentum.
Sellers are clearly in control, and price action shows little sign of slowing down.
Structure around 18,324 failed to hold. Next major support zone: 16,968.5.
Will the bleeding stop there?
⚠️ Reminder:
No one can predict what will happen next.
Markets react to collective psychology, news flow, and big players—not forecasts.
✅ Focus on:
-Key Levels 🔎
-Market Structure 📐
-Risk Management 🛡️
❌ Don’t trade based on emotion or prediction.
🎯 Trade based on probability, not certainty.
👉 Let price confirm your bias — watch for clear breakouts, retests, or rejections before jumping in.
Stay patient, stay disciplined. 📈📉

NASDAQ 100 SIMILARITIES WITH THE 2008 MARKET CRASH (2008 MARKET CRASH CHART )
As shown in the chart, we may now see a relief rally in equities in case Trump decides to take a step back regarding tariffs, while at the same time, the FED decides to give markets a break by messaging possibly more rate cuts this year. Although I think a relief rally is coming after this correction, we may end up in a similar technical pattern to 2008. By summer ( June-July ), equities may have a final push before breaking further below.

Actionable Nasdaq insights: 11-APRIL-2025Rise and shine, traders! Start your day with actionable Nasdaq insights. Let's grow your skills together, one chart at a time.


NASDAQ100 - Trade Idea 10 April 2025📌 Key Points on the Chart:
Bullish Engulfing Daily (Orange Circle)
This is a candlestick pattern that suggests a possible trend reversal from downtrend to uptrend.
A big green candle fully engulfs the previous red candle → a strong sign that buyers are taking control.
Strong Low & Swing Low (Lowest Points)
These areas are considered strong support zones.
Price previously dropped to this level and quickly bounced back up → seen as a “cheap” price by Smart Money.
High Volume Spike
Notice the high volume bar when the bullish candle formed – this shows strong buying interest.
Likely that big players (institutions) are stepping in to buy.
Projected Price Movement (White Zigzag Path)
The chart suggests price may continue to rise (possibly toward the 20,000+ zone).
But first, there may be a slight pullback (cooling off) before continuing upward.
FVG (Fair Value Gap)
This is a price gap that hasn't been filled yet – price often returns to fill these gaps.
In ICT, FVG is treated as a discount or premium zone for potential entries.
50% Level (Fibonacci Retracement)
This line shows the midpoint between a previous swing high and swing low.
It often acts as a reaction zone for price – either support or resistance.
🔍 Simple Summary:
The chart is showing a potential bullish reversal.
A bullish engulfing pattern + high volume = signs of institutional buying.
Expectation: price may pull back slightly, then continue rising.
Strategy: traders might wait for a pullback into the FVG or 50% zone to look for buy entry opportunities.

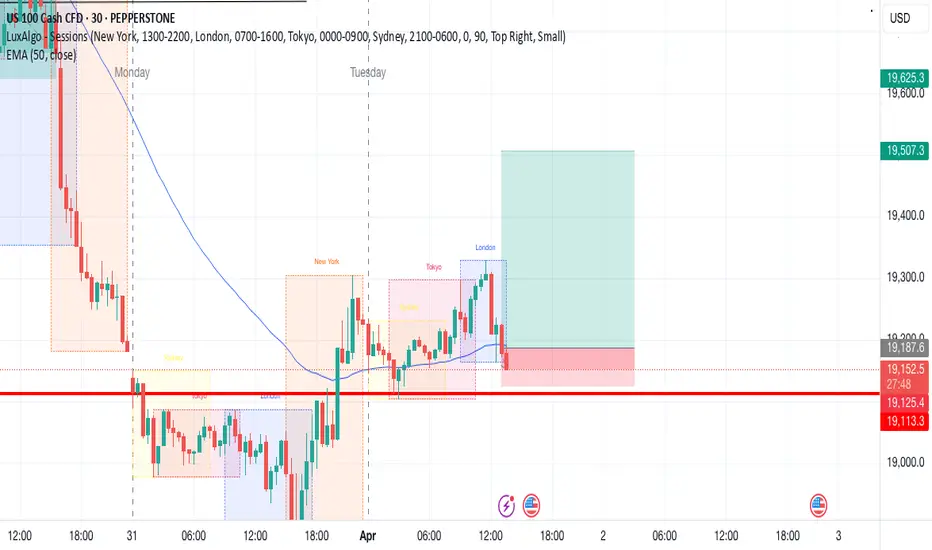
NAS100 Weekly Gap: Prime Short Setup or a Trap in Disguise?The weekly gap on NAS100 is lining up as a textbook short target—but will it hold or get steamrolled? While stops beyond the gap offer safer trade placement, downside momentum suggests any pullback may be short-lived. With 16,000 in sight as the next major low, bears have a reason to stay aggressive. Just don’t get caught on the wrong side of a gap fill gone rogue.

NASDAQ LEADERSHIPNASDAQ Correction 21% what happen?
if this too late, making another asset distractions, volatility.

US100 Bullish SideUS100 show clear bullish momentum and many indicators shows that US100 in uptrend which are given below:
RSI daily timeframe bullish divergence
Descending parallel channel which show that US100 in a strong uptrend
Strong support zone
All these indicator indicators shows us that US100 in a clear bullish momentum

Nasdaq-100 Wave Analysis – 3 April 2025
- Nasdaq-100 index broke support level 18820.00
- Likely to fall to support level 18295.00
Nasdaq-100 index recently broke the key support level 18820.00 (the previous monthly low from the end of March).
The breakout of this support level 18820.00 accelerated the minor impulse wave 1 of the intermediate impulse wave (C) from February.
Nasdaq-100 index can be expected to fall to the next support level 18295.00 (former monthly low from September) – the breakout of which can lead to further losses to 18000.00.

NAS100 selling pressure continues due to Apple stock declineHello traders,
As I highlighted in my previous NAS100 analysis, I expected a move to the downside. Technically, the index formed a double top, which was confirmed by a neckline break. Additionally, it has fallen below the rising support trendline from November 2024 and successfully retested it. This week, I anticipate further downside continuation. For an optimal selling opportunity, keep an eye on price action during the New York AM session. Ideally, I’d like to see a minor pullback to 19,200 before considering short positions, with the index potentially targeting liquidity at 18,297 and possibly extending to the 17,235 low from August 2024.
From a fundamental perspective, several factors are reinforcing our bearish outlook on NAS100:
Trade Tariff Concerns – New U.S. tariff measures are fueling trade war fears, weighing on tech stocks.
Inflation & Fed Policy – Higher inflation raises concerns about prolonged high interest rates.
Tech Sector Weakness – Leading NAS100 stocks like Apple and Nvidia are experiencing declines.
Stay cautious and trade wisely! 🚀

NAS100 Short Daily Chart
Trend is downwards
Moving average: blue below red
Pattern: Impulse correction
Fib retracement: 38.2

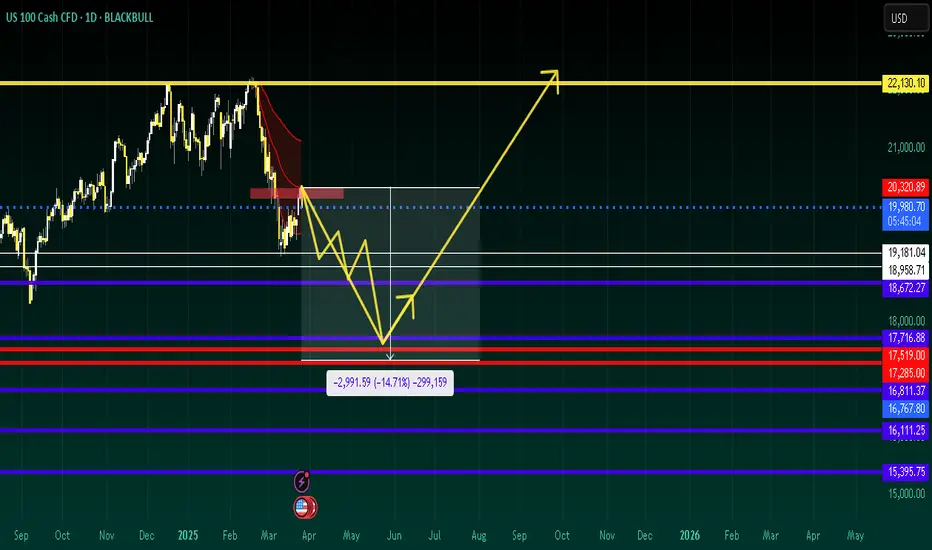
BUY EVERY BIG TECH, BUY AND HOLD UNTIL OCTOBERBuy the pivot level. hold for the last 7-month bull run until October 2025.
Price and time cycles suggest that price will peak in October 2025 and a second swing high in March 2026 for the midcycle correction. We would look for the top at 26k
Buy every big tech, buy the major stocks, buy, buy......
The 7-month cycle from March to October 2025 will be the second largest swing within the 5-year bull run from 2020 crash low
Trade safe, good luck.

Came like a thief in the night: TRUMPCESSIONBearish continuation to my last post
Donny triggered it
that said im expecting price to drive lower from my red zone and to resist at the levels i think around the red price levels will it all be over
Bulls shouldnt fight this fallI have explained everything on the chart....can't be bullish for the time being, except for some rallies in a downfall....Whales will step where JPow said the famous words, Inflation is no longer transitory....Honestly the sooner we get here, the better....but it could take a few weeks or by the middle of this year.....if the market goes again back up for a double top, the fall will be even more painful.....but markets are all about creating maximum pain for bulls and bears....

NASDAQ Will the disappointing PCE today form a Double Bottom?Nasdaq is on a strong 3 day correction that has almost erased the recovery attempt since the March 11th low.
That was a higher Low inside the 8 month Channel Up and the current correction may be a bottom formation attempt like September 6th 2024.
Trading Plan:
1. Buy before the closing market price.
Targets:
1. 23350 (the 1.382 Fibonacci extension).
Tips:
1. The RSI (1d) illustrates the similarities with July-September 2024 in a much better way. Strong indication that the Channel Up is attempting to price a bottom.
Please like, follow and comment!!

NASDAQ 1D IdeaPotential for a bearish pullback on the NASDAQ 1D which could lead to a price movement towards the support level at 18300. SELL levels from 19400

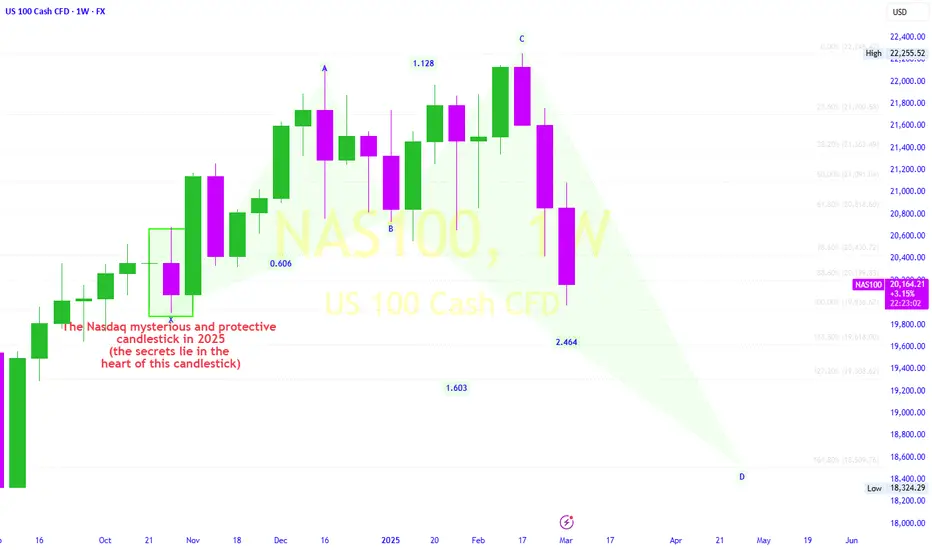
2025 Outlook: Correction and Harmonic PatternsThe NASDAQ , after peaking at an unprecedented 22,000 in 2024, has begun a corrective phase driven by pausing Federal Reserve interest rates, concerns over tech-sector profitability, and escalating geopolitical tensions and Trump Commands. This pullback reflects a shift away from growth stocks toward safer assets.
As outlined in this Chart, the index is now validating a bearish harmonic pattern (Crab), which typically signals major trend reversals.
The pattern’s completion zone aligns with key Fibonacci retracement levels (61.8–78.6%) of the 2022–2024 bull run, projecting downside targets:
- Near-term support: 20,000–20,500 (dynamic support near the 100-week moving average).
- Intermediate zone: 19,000–19,500 (50% Fibonacci level and long-term trendline confluence).
- Final target: 18,500 (78.6% Fibonacci retracement and psychological “golden support”).
Macro risks, such as prolonged restrictive monetary policy, slowing AI-driven earnings growth, and U.S.-China and US-Europe trade tensions, could accelerate this decline.
Traders are monitoring a decisive break below 20,500 with high volume to confirm bearish momentum, while a rebound from 18,500—coupled with reversal patterns like a double bottom may signal a short/mid-term buying opportunity.
This outlook hinges on earnings reports from mega-cap tech firms (Microsoft, Apple, NVIDIA) and Federal Reserve policy guidance.
nas100 buy/longnasdaq on a buy
bulish sentiment
bullish setup
use proper risk managment
#nasdaq #nas100 #nq #dowjones #dj #indices #index

NAS100 Will Go Up From Support! Long!
Please, check our technical outlook for NAS100.
Time Frame: 1h
Current Trend: Bullish
Sentiment: Oversold (based on 7-period RSI)
Forecast: Bullish
The market is approaching a key horizontal level 18,411.4.
Considering the today's price action, probabilities will be high to see a movement to 18,773.6.
P.S
We determine oversold/overbought condition with RSI indicator.
When it drops below 30 - the market is considered to be oversold.
When it bounces above 70 - the market is considered to be overbought.
Disclosure: I am part of Trade Nation's Influencer program and receive a monthly fee for using their TradingView charts in my analysis.
Like and subscribe and comment my ideas if you enjoy them!
