VET Bull Flag, supportBull flag on the bigger scale but you can also zoom and see the support carrying the outbreak of the bull flag. should worry if that uptrend breaks otherwise this should be a pretty clean outbreak.
VETBULLUSD trade ideas

VET/USD Price ActionVecchain is a top 25 crypto, underperforming this dip. Once broke the downtrend we're up +90%, expecting a pump to ATH after consolidation in the ascending triangle. Fibs on point.

VET drops to $0.16, quick recovery in progressVeChain price analysis is bullish today.
VET/USD likely saw the final push lower to $0.16.
Bullish momentum returned this morning.
VeChain price analysis is bullish today as we saw strong rejection for further downside as the market approached $0.16. Therefore, we expect VET/USD to recover later today and likely continue higher by the end of the week.

VET - Retracement and Up!Top of the Morning!
VET has shown some really great potential for this bull run, therefore my DCA levels on this retracements:
now
$0.15
$0.144
$0.131
$0.12

VETUSD Entry 0.1474 Take Profit 0.1877VETUSD (VeChain)
Diagonal Trend Line
Horizontal Support Resistance Line
EMA 10
EMA 20

💡Don't miss the great buy opportunity in VETUSD Trading suggestion:
". There is a possibility of temporary retracement to the suggested support line (0.1646).
. if so, traders can set orders based on Price Action and expect to reach short-term targets."
Technical analysis:
. VETUSD is in an uptrend, and the continuation of the uptrend is expected.
. The price is above the 21-Day WEMA, which acts as a dynamic support.
. The RSI is at 59.
Take Profits:
TP1= @ 0.1870
TP2= @ 0.1976
TP3= @ 0.2144
TP4= @ 0.2300
TP5= @ 0.2490
SL= Break below S2
❤️ If you find this helpful and want more FREE forecasts in TradingView
. . . . . Please show your support back,
. . . . . . . . Hit the 👍 LIKE button,
. . . . . . . . . . Drop some feedback below in the comment!
❤️ Your support is very much 🙏 appreciated!❤️
💎 Want us to help you become a better Forex / Crypto trader?
Now, It's your turn!
Be sure to leave a comment; let us know how you see this opportunity and forecast.
Trade well, ❤️
ForecastCity English Support Team ❤️

💡Don't miss the great buy opportunity in VETUSDTrading suggestion:
". There is a possibility of temporary retracement to the suggested support line (0.1646).
. if so, traders can set orders based on Price Action and expect to reach short-term targets."
Technical analysis:
. VETUSD is in an uptrend, and the continuation of the uptrend is expected.
. The price is above the 21-Day WEMA, which acts as a dynamic support.
. The RSI is at 60.
Take Profits:
TP1= @ 0.1870
TP2= @ 0.1976
TP3= @ 0.2144
TP4= @ 0.2300
TP5= @ 0.2490
SL= Break below S2
❤️ If you find this helpful and want more FREE forecasts in TradingView
. . . . . Please show your support back,
. . . . . . . . Hit the 👍 LIKE button,
. . . . . . . . . . Drop some feedback below in the comment!
❤️ Your support is very much 🙏 appreciated!❤️
💎 Want us to help you become a better Forex / Crypto trader?
Now, It's your turn!
Be sure to leave a comment; let us know how you see this opportunity and forecast.
Trade well, ❤️
ForecastCity English Support Team ❤️

VeChain (VET) - November 10Hello?
Welcome, traders.
By "following", you can always get new information quickly.
Please also click "Like".
Have a nice day.
-------------------------------------
(VETUSD 1W Chart) - Medium to Long-Term Perspective
Above the 0.03981204 point: the uptrend expected to continue
Above 0.08458101 point: Expected to create a new wave.
(1D chart)
You need to make sure you have support at the 0.16800141 point.
If the price holds above the 0.14187200 point, it is expected that the uptrend will be accelerated.
If it falls from the 0.11326725 point, a short-term Stop Loss is required.
The 0.20955073-0.22890460 section is a psychological resistance section and is expected to renew ATH if it breaks upwards.
------------------------------------------
We recommend that you trade with your average unit price.
This is because, if the price is below your average unit price, whether it is in an uptrend or in a downtrend, there is a high possibility that you will not be able to get a big profit due to the psychological burden.
The center of all trading starts with the average unit price at which you start trading.
If you ignore this, you may be trading in the wrong direction.
Therefore, it is important to find a way to lower the average unit price and adjust the proportion of the investment, ultimately allowing the funds corresponding to the profits to regenerate themselves.
------------------------------------------------------------ -----------------------------------------------------
** All indicators are lagging indicators.
Therefore, it is important to be aware that the indicator moves accordingly with the movement of price and volume.
However, for the sake of convenience, we are talking in reverse for the interpretation of the indicator.
** The MRHAB-O and MRHAB-B indicators used in the chart are indicators of our channel that have not yet been released.
(Since it was not disclosed, you can use this chart without any restrictions by sharing this chart and copying and pasting the indicators.)
** The wRSI_SR indicator is an indicator created by adding settings and options to the existing Stochastic RSI indicator.
Therefore, the interpretation is the same as the traditional Stochastic RSI indicator. (K, D line -> R, S line)
** The OBV indicator was re-created by applying a formula to the DepthHouse Trading indicator, an indicator disclosed by oh92. (Thanks for this.)
** Support or resistance is based on the closing price of the 1D chart.
** All descriptions are for reference only and do not guarantee a profit or loss in investment.
(Short-term Stop Loss can be said to be a point where profit and loss can be preserved or additional entry can be made through split trading. It is a short-term investment perspective.)

VECHAIN | VET _ Should we leave and come back? Price respecting the supply resistance are at the 0.1870 region. Closing out a partial position here. Looking for a retracement to the support/demand area & 50% fib 0.1525 region. Looking for short-term timeframe higher lows to go long again. TP zone in the 0.24 to 0.25 region which is the previous major swing high on the broader downtrend and the range extension we just broke out from.
What am I not seeing? Should I hold my position or sell and buy back at support?

VetChain - I'm still bullish, but I'm waiting a retracement.I like VetChain (VET). I closed part of the position, waiting for a retracement on the support in the 0.1550 zone.
I don't see the enthusiasm that was there last week on all social networks. It seems that the waters are cooling down and therefore I prefer to lighten myself and wait for the developments on this and other tokens.
Disclaimer
NO FINANCIAL ADVICE – The information on this website is for educational, informative, and entertainment purposes only. No express or implied warranty of any kind, including warranties of accuracy, completeness, or fitness for a particular purpose, is given with the Information.
This article is not intended to be and does not constitute financial advice, investment advice, trading advice, or any other form of advice.
This post's information is general in nature and isn't meant for you or anybody else. You should not rely on any of the material found on this post to make a financial, investment, trading, or other decision without first doing your own due diligence and consulting with a professional broker or financial advisor.
You understand that by reading any and all information on or through this post, you are doing so at your own risk.
The trading of cryptocurrencies, Tokens and NFTs has potential rewards, and it also has potential risks involved. Trading may not be suitable for all people. Anyone wishing to invest should seek his or her own independent financial or professional advice.

Vechain | From VEN to VET.From a $8 VEN ATH - to a $0,0019 VET ATL
Grinding up to a new $1 VET ATH
High to low to 4.618 = current local high at .278
High to low to 4.618 = projected new high at 1.08
Spring 2022

VET - Resistance hit!Top of the Morning!
So VET has shown some great strength and now it hit a resistance level. Most likely it will now retest the broken trendline. WATCHOUT for BTC! it may retrace big time and will drag along ALTs with it. On VET I'm prepared for a retracement and revisit of this top.

VET tests $0.17800, after establishing support at $0.1700VeChain price analysis is bearish today.
VET/USD tests previous high.
Rejection currently preventing further upside.
The VET/USD pair is trading in a very tight range today, with the market continuing to struggle against selling pressure after a brief advance above the previous high. As a result, we anticipate VET/USD to drop again and establish another higher low before attempting to rise further.

$VET SHORT SCALPVET Starting to move, short scalp here.
Opening a short scalp from here, target in next comment


UPDATE: $VET continues to break upwardsPosted the original chart back in late October.
Since then, VET has broken its downtrend line, held above it and continued to appreciate.
I still think there's a lot more room to run back to ATH's and even higher if the market allows.

VET can't get any more obviousImo VET mostly follows the simplest of TA rules.
Bitcoin will soon be at new ATHs and once the money rotates into Alts the party is on.
The RSI is set at monthly. Much room to shot up into overbought territory of 90+
Plan your exit strategy. Dec/Jan may be the top.

Vechain: Could 7x from current levelIn my previous analysis, I shown how Vechain is cyclical against Ethereum and is expected to outperform the latter in the upcoming weeks. In this analysis, I show the Elliott wave count for Vechain. VET recently finished a large triangle for its primary wave 4 and has now begun a massive primary wave 5. I believe we are now beginning the secondary wave 3 of primary wave 5 that could carry the price as high as $1.20, which is at least 7x gain.

Vechain (VET): Best cyclical buy signal!Vechain, when measured against Ethereum, is extremely cyclical. The best time to buy VET is when the pair goes above both moving averages, then corrects slightly, looks like an inverted hook as shown in magenta in the chart above. This means Vechain is going to outperform Ethereum in the upcoming weeks, quite significantly. It is not too late to buy, it is just about to get started!

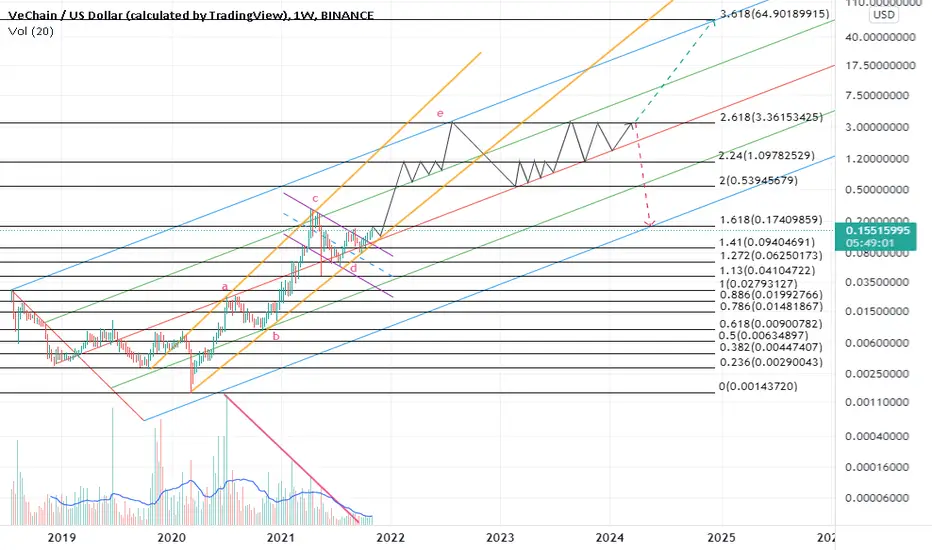
after the breakout of the $0.174 the E wave will be sharpFibo levels:
1.6 BC=$0.174
2 BC=$0.54
2.24 BC=$1.1
2.6 BC=$3.36
3.6 BC=$64
the crab behavior of the VECHAINcrab harmonic pattern:
X=$0.133
AB=0.61 XA
BC=0.38 AB
1.6 BC=$0.05
2.6 BC=$0.118
3.6 BC=$0.325
1.6 XA=$2.12

⭕VETUSD : It did we predict again and..
Click the pic to read last post and detail.
It hesitated after hit TP1 and break out again now, so we modify SL to 0.1511.
Remember take some profit and give it more time !
✅TP1:0.1478
✅TP2:0.1606
✅TP3:0.1658
TP4:0.1714
TP5:0.1770
🔴🆕TP6 : 0.1950
If you like this analysis, give it a like or share your thought or let me know what crypto TA you want to know.

