Vechain 19/4/21As long as price holds support or doesnt break HL points looking like a nice buy short term target for me is .32 cents
VETBULLUSD trade ideas
Continuation is the situationSee the idea below back from February to get an idea of how this has moved. Long.

LONG TERM HOLD - VET - $1 by July 2022VET has been one of my Long Term Holds since March 2019. I'm currently up 6000%.
I see it hitting $1 by July 2022 at the latest.
The earlier date is much nicer!!

VET Cooldown before new ATHWe saw a marketwide correction last night with most cryptos dropping 15% to me this is nothing out of the ordinary, we have been running up like crazy and with that we need corrections before we can keep moving up, it also great for creating more support. The VET bulls bought up the dip super quick bringing us all the way back up above our 0.2 FIB Level! I think soon enough we will start to see the markets and VET move up again creating new ATHs. The Zero Lag MACD did actually cross bearish but has recovered and flipped back bullish and starting to separate! Our EMA ribbons still look extremely bullish, pointing upwards and starting to spread out and open up carrying us with bull momentum. The RSI is overbought but coming down a little bit and the Ichimoku cloud is printing us green support clouds still but starting to turn a little sideways. Ideally it would be good if we went sideways for a few days before heading back up to create and strengthen support levels. Not financial advice just my opinion

VET/USD Buy IdeaThis is my view on Vechan, after completing wave 5 on the way are ABC corrective waves. So I will look to buy it around 0.16 highlited area.


VET Look Out Below!!! VET Is About To Crash Title says it all - DO NOT SHORT ANY CRYPTO and do your own DD just wait for a MUCH better entry down the road as the "retail" buy this name from the pros. Can it hit 0.30 of course it's crypto but it's about to wipe out many so called investors. Not Advice

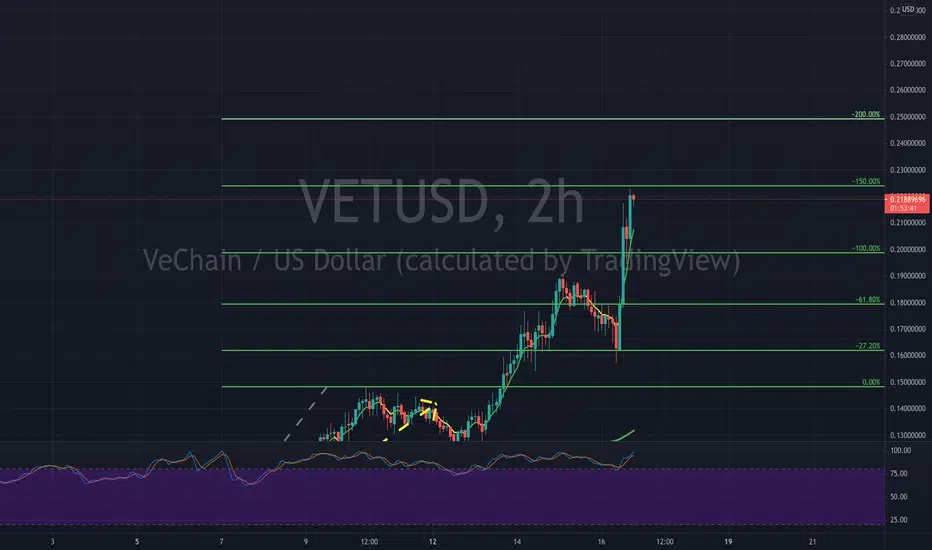
Vechain(VET) Update: 228% Gain from Buy Zone 4..Next Stop $0.33 Vechain(VET) Update 18/04/21: 228% Gained from our Buy Zone 4 from the 4th April to 16th April...Next Stop $0.33 from Buy Zone 5 which is an 81% Gain from 50.0% Fibonacci retracement level. Lets take advantage of the current prices as we will not be seeing these low prices for a long period of time once the Bulls are back in the market for the next push phase. Use the Buy Zones to map your Buys or simply for dollar cost averaging. The Fundamentals are great for this project and we are very bullish on Vechain and can see EOY price target between $2 to $5. See previous analysis below. Happy Trading :)
Vechain(VET) Update 05 /04/21: VET perfect bounce from Buy Zone 4 37% Gain to $0.11. See previous analysis below.
Update 30/03/21
Vechain(VET) looks ready for another 37% Gain to $0.11. Since the 27th March Vechain has been consolidating between $0.087 & $0.097 range. Stochastics are now showing an oversold market and VET looks ready for continued Bullish momentum to the upside. Be patient with your entry as we expect VET to test the 78.60% Fibonacci level before confirmation of a move towards our target at the 127.20% Fibonacci level @ $0.11. Failure to test the 78.60% Fibonacci would see a 12% Gain from the current level to the previos ATH tested on the 22nd March @ $0.10.
Use the Buy Zone ($0.088) to map your entry if you are not already riding the current wave, from here you can DCA to accumulate more coins, 37% Gain to our $0.11 price target.
See previous analysis below. Happy Trading :)
$VET #Hodl
Update 23/03/21
Vechain(VET) looks ready for another 46% Gain to $0.11 at the 127.20% Fibonacci level. Stochastics on 4H showing an oversold market at this price level. On 22 March VET reached $0.10 on the Binance exchange. Since reaching this price level, the price broke below the 13 EMA and 50 SMA as the profit takers came into the market after 21 days of this strong bullish continuation pattern. Although we have broke below both 13 EMA and 50 SMA , overall VET is still bullish and we can expect a bounce from the price pushing above the 50 SMA but be patient as they may be more profit takers in the market. There is a high probability the Bulls will take back control and continue to keep pushing the price higher. Currently VET is showing signs of a weak retracement just below the 78.60 Fibonacci level. Use Buy Zone 3 to map out your Buys from here and if the 13 EMA crosses below the 50 SMA , we will be looking to DCA and Accumulate between the 61.80% to 50% Fibonacci level. From the 61.80% Fibonacci level we expect a 57% Gain to the 127.20% Fibonacci level, this would be the worst case scenario if we get a stronger retracement. See below previous analysis of a new ATH target @ $0.14 as this is the best case scenario from here. Happy Trading :)
Vechain Monthly Outlook Update 23/03/2021
Vechain(VET) Explosive Move New ATH Target, 62% Gain to $0.14, we are very confident this new price target will be reached over the next coming days/week(s). Stochastics showing an oversold market on the 4h
*Update Vechain Outlook 20/03/21*
Vechain is still on course to our 127.20% Fibonacci level, beautiful continuation pattern. Some great Buy Zones to DCA in this channel. New Target @ 161.80 Fibonacci, lets ride this wave to $0.11, 24% Gain from current price level.
Vechain dropped into the perfect Buy Zone zone to enter if you’re not yet in or want to dollar cost average if you’re already riding the current wave. Happy Trading :) See previous analysis below.
*Update Vechain Outlook 18/03/21*
Road to $0.10 is clear, we are still in a strong continuation pattern in search of new ATH at the 127.20% Fibonacci level in the short term. Use Buy Zone 3 to set up your buys, perfect sniper entry would be at the 78.60% Fibs (33% Gain to 127.20 Fibs). Watch for price action as we may see a small retracement down to test the 50 SMA just below the 78.60% Fibs before pushing to the upside towards the $0.08 price level and further $0.10 (40% Gain to 127.20% Fibs).
*13/03/21*
Vechain's price soared to a new ATH on 12/02/21 reaching $0.606 on the Binance exchange. Following the new ATH there was a small retracement before trying to push past the resistance set at ATH , but this failed to break on 19/02/21 and was met with huge selling pressure at these price levels, retracing down further, quite sharply after 4 days on 23/02/21 touching the 50 SMA on the daily chart with a low of $ 0.0341. The downward pressure was met with a sharp bounce on the 50 SMA recovering in a day 24/02/21 back to the 38.20% Fib retracement level showing strong signs of Bulls still in the market. As of the past 3 days the price has been consolidating between a small range between the 38.20% Fibonacci retracement levels and 23.60%. Further to note the price on 2 occasions has tested to break below the 50 SMA failing twice signalling strong bullish pressure and signs of the Bulls to continue driving the current price to test the ATH yet again whilst also setting the sentiment of a possible new ATH at the 127.20% Fibonacci retracement level @ $0.0702.
Furthermore the 200 SMA has been tested at 3 occasions on the 4H Chart, failing to break past this level. Vechain is in a perfect zone for Buys back towards the ATH . Stochastics on the Daily chart signal an extremely oversold market so expect Vet to push back 55% back to ATH levels and Further 74% to 127.20% Fibonacci with the potential to set a new ATH in the coming days to weeks in March.
The Fundamentals are great for this project and we are very bullish and can see EOY price target between $2 to $5. Buy Zone 1 @ 23.60% Fibonacci retracement level for the perfect sniper entry. Be patient, wait for confirmation before entering any buy. Happy Trading :)

Wait for nowNo especial price action entry signal
indicator wise, RSI and Stocks are all in overbought

VET falling wedge breakout! Vet has broken out of a faking wedge.
MACD about to cross on the 30 min.
Looking good for more upside!

VET BET It's Extremely exciting to see this play out so smoothly. Opened position at $0.02-$0.04. I believe this product can stay successful in the long run, as a hedge against currency-coins. Staying long!

VET Healthy Consolidation after Retracement First time posting, the red and green lines are two arbitrary lines for my own use. It seems VET is consolidating after that amazing move from 0.16. Healthy retracement IMO... I'm hoping for another leg up after this, time will tell :)
Do your own research and DD. I'm new to TA and feel free to share your ideas in the comment section and make money yo!

VeChain - 1hr chart buy the dipsVeChain 1hr Chart update:
VeChain is still well within the Bullish Zone of the Ichimoku cloud for this 1hr timeframe.
The Ichimoku Cloud Conversion Line (Tenkan Sen) is indicating short-term momentum is upwards for this 1hr timeframe.
The Ichimoku Cloud Base Line (Kijun Sen) is indicating mid-term momentum is sideways for this 1hr timeframe.
VET is below its Ichimoku Cloud Conversion Line (Tenkan Sen) so VET eventually needs to close a 1hr candle above this level and turn it into strong support.
The Ichimoku Cloud Lagging Span (Chikou Span) is indicating momentum is sideways & slightly upwards for this 1hr timeframe. I say widens because the Lagging Span (Chikou Span) is a fast price reaction indicator and sideways trading is done within a range and not at a constant level.
VeChain is fighting to stay above its 50% Fibonacci Retracement Level which is also where the Ichimoku Cloud Base Line (Kijun Sen) is located.
As you can see, VeChain has managed to close 5 1hr candles above its 50% Fibonacci Retracement Level.
VET is still above its 50EMA.
VET is below its Bollinger Bands Middle Band Basis which is a 20 period SMA. VeChain needs to eventually cross and close a 1hr candle above this level and turn it into strong support.
The Bollinger Bands are also showing that we may see a Bollinger Bands Squeeze for this 1hr timeframe indicating sideways momentum.
The Chaikin Money Flow (CMF) is indicating that there is still accumulation happening even in this 1hr timeframe even though it has slowed and dipped slightly.
Please look at my previous VeChain Longterm post, what happened was exactly what i said was going to happen, VeChain found strong resistance at its Pitchfork Median Line and has retraced slightly under it. VeChain needs to eventually close a daily candle above this daily Pitchfork Median Line and turn it into strong support.
So wow! What an incredible rise for VET. Well done if you actually listened to me weeks ago and managed to get in early. If you didn’t, don’t worry as its still not too late to grab some VET before it crosses the $1 mark. The future really is looking bright for this sleeping giant of the crypto world.
I hope this is helpful. Good luck 👍🔥🚀🌍🌔🪐🛸👽


vet/usdlooks like more consolidation ahead for vechain. another bull flag forming. see if it keeps playing out and pumping!! i think we can easily test ath again and break 30 cents. just gotta it cool off for a bit.

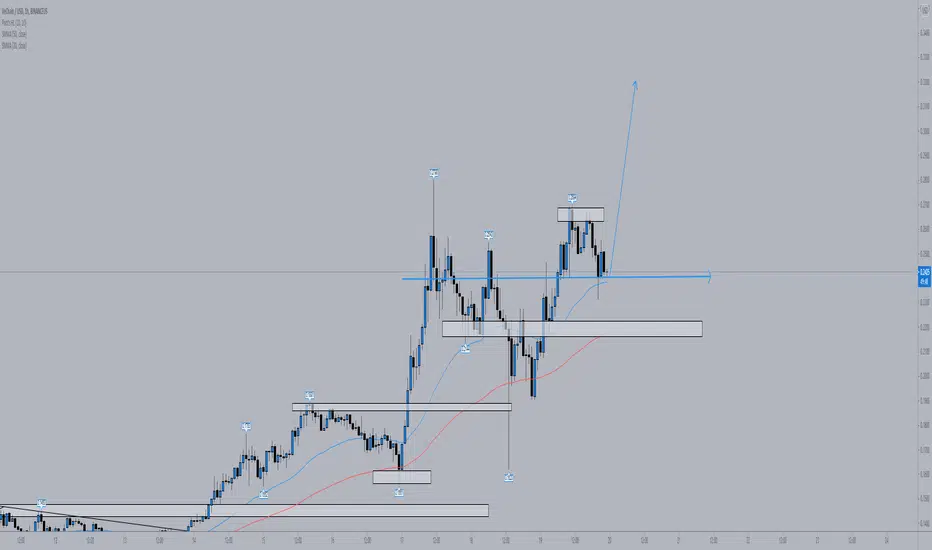
Potential price action VET.If VET breaks to the upside of the Bull Flag, we may expect the price to reach the target of 0.194.
Remember: when trading the breakout, wait for a breakout confirmation.
Green= Support
Red= Resistance
Disclaimer: this is not trading advice, trade at your own risk.
Feel free to give me a follow if you want to get notified when I publish a new idea.


VeChain Strong Momentum Just to be clear this is an investment type of coin. I am not financial advisor please do your own Due diligence

VeChain (VET) - April 17Hello?
Dear traders, nice to meet you.
By "following" you can always get new information quickly.
Please also click "Like".
Have a good day.
----------------------------------
We need to see if we can get support and climb in the 0.23458868-0.24620446 range.
If it falls, you need to make sure you get support at 0.21135712.
If it falls between 0.09819935-0.10681513, Stop Loss is required to preserve profit and loss.
------------------------------------
(VETBTC 1D chart)
We have to see if we can get support at the 379 Satoshi branch.
If it falls, we need to make sure we get support in the 323 Satoshi-337 Satoshi section.
There can be a plunge due to a surge, so careful trading is always necessary.
We have to see if there can be any movement to break above the 504 Satoshi point.
If it falls between 156 Satoshi and 170 Satoshi, Stop Loss is required to preserve profit and loss.
-------------------------------------------------- -------------------------------------------
** All indicators are lagging indicators.
So, it's important to be aware that the indicator moves accordingly with the movement of price and volume.
Just for the sake of convenience, we are talking upside down for interpretation of the indicators.
** The wRSI_SR indicator is an indicator created by adding settings and options from the existing Stochastic RSI indicator.
Therefore, the interpretation is the same as the conventional stochastic RSI indicator. (K, D line -> R, S line)
** The OBV indicator was re-created by applying a formula to the DepthHouse Trading indicator, an indicator that oh92 disclosed. (Thank you for this.)
** Check support, resistance, and abbreviation points.
** Support or resistance is based on the closing price of the 1D chart.
** All explanations are for reference only and do not guarantee profit or loss on investment.
Explanation of abbreviations displayed on the chart
R: A point or section of resistance that requires a response to preserve profits
S-L: Stop Loss point or section
S: A point or segment that can be bought for profit generation as a support point or segment
(Short-term Stop Loss can be said to be a point where profits and losses can be preserved or additionally entered through installment transactions. It is a short-term investment perspective.)
GAP refers to the difference in prices that occurred when the stock market, CME, and BAKKT exchanges were closed because they do not trade 24 hours a day.
G1: Closing price when closed
G2: Cigar at the time of opening
(Example) Gap (G1-G2)

VeChain - VET - Crypto - Chasing DOGE?VeChain - VET - Crypto - Chasing DOGE? VET is going parabolic. Will it run up over 30 cents like DOGE? We will see?
VET Looking pretty sweet. (4hr Heiken Chart)After making a new all time high and teasing .19, VET is currently experiencing a healthy retrace. Here are some fib lines and what i'm hoping to see over the next few days.

VeChain ideaThis is only my idea of the cryptoinvestement in VeChain
I am first expecting a little drop before BIG BIG buy
Let me know what do you think in comment!
