TradeCityPro | VETUSDT Keep an Eye on the Charts!👋 Welcome to TradeCityPro Channel!
Let’s dive into the days when the world is buzzing with interesting events—countries are forming alliances, and news of Trump’s tariffs to negotiations is everywhere. You need to keep a sharp eye on the financial markets and your assets!
🌐 Overview Bitcoin
Before starting the analysis, I want to remind you again that we moved the Bitcoin analysis section from the analysis section to a separate analysis at your request, so that we can discuss the status of Bitcoin in more detail every day and analyze its charts and dominances together.
This is the general analysis of Bitcoin dominance, which we promised you in the analysis to analyze separately and analyze it for you in longer time frames.
📊 Weekly Timeframe
After the bullish move from the 0.01963 support, we got rejected at 0.08271, essentially wiping out the entire move and fully retracing our steps.
We’ve now returned to the 0.01963 support, where we’re forming a solid green indecision candle, backed by noticeable buying pressure. This level has shown a strong reaction, acting as a reliable support.
This could serve as a decent buy trigger with low risk, offering a good entry point. Personally, though, I’m holding off on buying until we see stronger momentum in the chart and market, and until Bitcoin dominance experiences a deeper pullback.
📉 Daily Timeframe
In the daily timeframe, VET is among the coins that have faced a brutal sell-off! From its last peak, it’s dropped roughly 77%, and those without proper risk management have likely been wiped out.
After forming a support box between 0.04224 and 0.05298, we saw a fakeout above the box, signaling further downside. The last time we held support at 0.04224, we couldn’t reach the box’s ceiling, leading to a sharp drop. But after hitting 0.01942, the price has calmed down a bit.
For buying in spot or even futures positions, we’d need a break of the trendline and its trigger at 0.02352 to confirm entry, given the trendline’s retracement nature. If we get rejected from this trendline, a short position in a lower timeframe could make sense. Should 0.01942 break, the downtrend will likely continue. For spot entry confirmation, a surge in volume and a break above 48.68 RSI would be a strong signal.
✍️ Final Thoughts
Stay level-headed, trade with precision, and let’s capitalize on the market’s top opportunities!
This is our analysis, not financial advice always do your own research.
What do you think? Share your ideas below and pass this along to friends! ❤️
VETUSDT trade ideas

Vechain, 20X, 30X Or 100X In 2025?Vechain stopped dropping in June 2023, that's the market bottom. Ever since it has been producing higher highs and higher lows. This is one of the strong pairs and the last correction already ended, last week.
The low prices in late 2024 launched a bullish wave and this bullish wave was corrected by more than 100%. This is a full flush. A full flush is always great news for bulls and buyers, because it allows for maximum growth.
The previous high is an easy and certain target which equal to about 245%. This is very easy and ultra-high probability because this level was already hit in the last wave. If VETUSDT can find buyers at a higher price, now that the correction went beyond 100% even more buyers will show up.
But 245% is only short-term and being super conservative, this pairs chart points to a new All-Time High. This is because of the chart structure, the fact that the bottom happened in 2023 and in this April 2025 we have a long-term higher low. The weaker pairs are producing new All-Time Lows now. The stronger pairs are producing higher lows. The higher low means that holders/traders/participants are not ready to part with their coins. They are simply not willing to sell and this is why the price remains strong in comparison to other pairs.
These same participants will work as the base for maximum growth in this newly developing bullish phase. The 2025 bull market, make no mistakes.
This is no usual bullish jump, no relief rally nor "initial bullish breakout" as I love to say. This is it, we are entering price dynamics similar to 2021 or better. A major bullish wave.
See here how the market performed in 2021:
Of course, it is not that the market will necessarily grow by 17,000%. I am just saying, 245% is easy, it will be a very strong bullish wave.
The top can be hit at 10X, 20X or 30X (Can be 100X for all we know)... Allow for strong variations. Regardless of the final outcome, you will be very happy with the results. It will be great.
Namaste.

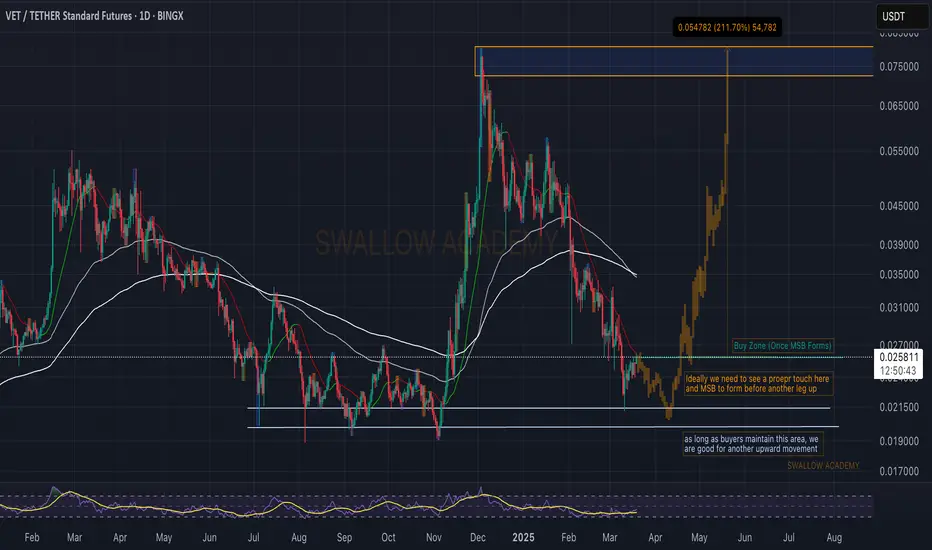
VeChain (VET): We Might See Soon 200% Pump, Waiting For MSBVechain coin has a chance to push 200% from our entry zone if everything goes as planned.
We are looking for price to fall slightly more down toward the support zone from where we are going to start looking for an MSB to form, which would then send price to 3x.
Setups seems good and support seems strong; now we have to do the hardest part—wait
Swallow Team
VET/USDT Potential Breakout Imminent?The VET/USDT perpetual contract on the 1-day timeframe is showing signs of a possible bullish breakout. The chart illustrates a long-term descending trendline, which the price is currently testing. If VET successfully breaks above this resistance, it could trigger strong upward momentum.
A key support and demand zone is visible between $0.020 - $0.022, where buyers have historically stepped in. If the breakout is confirmed, multiple resistance levels are outlined as potential price targets, including $0.03042, $0.03645, $0.04456, $0.05318, $0.05990, and $0.06908. These levels represent key areas where traders might look to take profits.
For confirmation, a daily close above the descending trendline is necessary. With a recommended stop-loss below $0.020 to minimize downside exposure. A breakout could lead to a strong bullish rally, whereas rejection at the trendline may result in continued consolidation. Traders should remain cautious and wait for confirmation before entering new positions.

Vet 3x-9x leverage 5% allocationHello traders,
Here is a free sample VIP trade we offer every Wednesday. Profit targets listed by the green horizontal line.
Enjoy

VETUSDT: trend in daily time framesThe color levels are very accurate levels of support and resistance in different time frames, and we have to wait for their reaction in these areas.
So, Please pay special attention to the very accurate trend, colored levels, and you must know that SETUP is very sensitive.
Be careful
BEST
MT

VETUSDT 1WVET ~ 1W Analysis
#VET Buy gradually from here if you still have a Conviction on this coin with a short -term target of at least 20%+.

#VET/USDT#VET
The price is moving within a descending channel on the 1-hour frame, adhering well to it, and is on its way to breaking it strongly upwards and retesting it.
We are seeing a bounce from the lower boundary of the descending channel, this support at 0.02460.
We have a downtrend on the RSI indicator that is about to break and retest, supporting the upward trend.
We are looking for stability above the 100 moving average.
Entry price: 0.02620
First target: 0.02700
Second target: 0.02765
Third target: 0.02853

VET/USDTVeChain (VET) showing signs of life on the weekly chart. Recently broke above a long-term descending triangle with decent volume, hinting at a potential trend reversal. Price currently at $0.02576, just below the breakout level of $0.02744. Watching for a retest of this level as support-could be a key area for bulls to defend. Next resistance around $0.034003 if momentum holds. Indicators showing early bullish signals but confirmation is key. Thoughts?

#VET BREAKING OUT OF MAJOR DOWNTREND Is altseason about to begin?
VET is currently breaking out of the downtrend after touching the LT critical support earlier so once we close the daily candle on a bullish note then we are going to go higher!
There is currently plenty of positive news out there but the sentiment is still pretty bearish. Let's remember that corrections are very healthy and it looks like we are still very much on track this bullrun!

I smell something...Could this be the be all end all... I see oversold on everything and we predicted this downturn but what is coming is something no one is prepared for...

VETUSDT on the Edge – Is a Major Breakdown Coming?Yello! Is VETUSDT on the verge of a bigger drop, or could a reversal be in play? The price action is signaling a critical moment, and traders need to stay sharp. A major move is brewing let’s analyze the setup.
💎#VETUSD remains under strong bearish pressure, repeatedly rejecting from the descending trendline and key supply zone. Price is also trading below the 200 EMA, reinforcing the bearish momentum and signaling that sellers remain in control. Until VET reclaims $0.02695, the risk of further downside remains high.
💎The next major support level to watch is $0.02117, where a temporary bounce could occur. However, if selling pressure continues, VET is likely to push lower toward $0.01906, a historically strong accumulation zone. This level will be crucial either it holds as a buying opportunity, or we see deeper downside continuation.
💎For the bulls to regain control, it must reclaim $0.02695 and break past the supply zone. A sustained push beyond $0.025, combined with strong buying momentum, could indicate the start of a recovery. However, a true trend reversal will only be confirmed if NYSE:VET closes above $0.02695 and reclaims the 200 EMA, invalidating the bearish setup and signaling bullish strength.
Patience is key, Paradisers. The market rewards those who wait for confirmation instead of chasing every move.
MyCryptoParadise
iFeel the success 🌴

VET/USDT BUY Hello friends
Due to the price correction, we have identified important supports for you that are likely to reverse the price, and you can buy steps according to the two specified ranges.
We have also identified price targets for you.
*Trade safely with us*

#VET/USDT#VET
The price is moving in a descending channel on the 1-hour frame and is expected to continue upwards
We have a trend to stabilize above the moving average 100 again
We have a descending trend on the RSI indicator that supports the rise by breaking it upwards
We have a support area at the lower limit of the channel at a price of 0.02666
Entry price 0.02950
First target 0.03080
Second target 0.03200
Third target 0.03300

#VET/USDT#VET
The price is moving in a descending channel on the 1-hour frame and is adhering to it well and is heading to break it strongly upwards and retest it
We have a bounce from the lower limit of the descending channel, this support is at a price of 0.02630
We have a downtrend on the RSI indicator that is about to break and retest, which supports the rise
We have a trend to stabilize above the moving average 100
Entry price 0.2700
First target 0.02810
Second target 0.02920
Third target 0.03064


VET looking for support as divergence forms. VET is approaching strong levels of support. There are signs of bullish divergence on momentum and trend oscillators. Although this is a good sign a chofch would confirm a pivot to the upside. DCA

VETUSDT 1WVET ~ 1W Analysis
#VET Buy gradually from here if you still have a Conviction on this coin with a short -term target of at least 20%+.

Cup and Handle pattern!Analysis 🚨
NYSE:VET is forming a Cup and Handle pattern! ☕ If it breaks out of the red resistance zone 🔴, the next targets will be:
🎯 First Target: Green line level 🟩
🎯 Second Target: Blue line level 🔵

UNIVERSOFSIGNALS | VET : a Layer 1 projectLet's quickly dive into VET, a Layer 1 project with a market cap of $2.37 billion, currently ranked 41st in coin market cap.
📊 In the 4-hour timeframe, you can see that a descending triangle has formed, and the floor of this triangle at $0.03068 has been broken, with the price now touching an important daily support at $0.02673.
⚡️ The RSI oscillator, following the triangle break, entered the oversell zone and, after concluding the downward leg, has rebounded above this zone, approaching the 50 area.
⭐ The volume aligns with the downward trend, and if the support at $0.02673 breaks, we could witness the next leg down. The next price support would be at $0.02406.
📈However, if the price moves back above $0.03068, it could indicate that the downward trend has ended. In this case, a risky long trigger would be at $0.03580, and the main long trigger would be at $0.03958. This reversal would suggest potential upward momentum, providing opportunities for long positions.

Be careful with VET !!!The price drops to around 0.305 and then pumps to 0.39 cents.
and if this wedge is broken, you will no longer see cardano below 30 cents.
Give me some energy !!
✨We spend hours finding potential opportunities and writing useful ideas, we would be happy if you support us.
Best regards CobraVanguard.💚
_ _ _ _ __ _ _ _ _ _ _ _ _ _ _ _ _ _ _ _ _ _ _ _ _ _ _ _ _ _ _ _
✅Thank you, and for more ideas, hit ❤️Like❤️ and 🌟Follow🌟!
❗Disclaimer
⚠️Things can change...
The markets are always changing and even with all these signals, the market changes tend to be strong and fast!!

VET buy/long setup (4H)VET appears to be bullish.
We are seeing higher lows within the RANGE.
It can move from the demand zone toward the targets on the chart.
A liquidity pool is also visible on the chart, which we have marked.
A daily candle closing below the invalidation level will invalidate this analysis.
Do not enter the position without capital management and stop setting
Comment if you have any questions
thank you

