A new growth opportunity for VIBVIB is preparing a new growth momentum today. As I wrote in previous reviews, finding a token below the 0.035 level is appropriate when the ether is below 1500, even if there is a monitoring tag. At the moment, the breakdown is more likely caused by panic sales on tag assignment. However, the assignment of the tag was obviously already worked out by the price when it fell below the 0.075 support. At the moment, I expect to enter the more appropriate 0.050-75 zone, corresponding to both the current market position and the tag. The opportunity for a refund will appear as soon as the indicators stop extinguishing sales, which has already happened on small timeframes. That is, today and tomorrow there is a high probability of a weekly candle reversal above the key support of 0.0350–375, and in the case of a daily or weekly candle opening higher, attempts to grow to 0.075-100 are likely, which is the main non-closed retest zone after the January impulse and is highly likely to be worked out. A retest of 0.035-50 from the current level will bring up to 100%+ profit.
VIBUSDT trade ideas

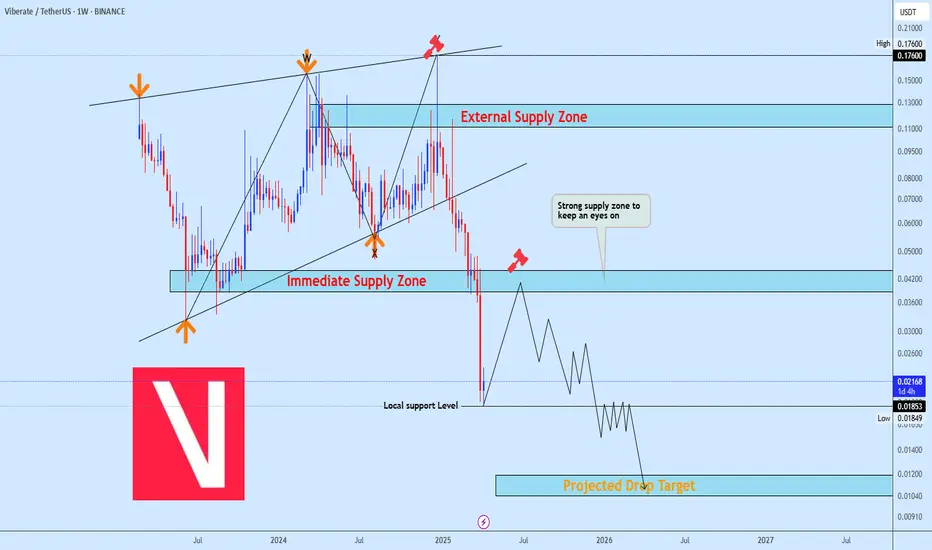
VIB Bearish Continuation Setup After Wedge BreakdownVIB broke down from a rising wedge and has since faced strong bearish pressure. With Binance monitoring the project, investor confidence is weakening, fueling the sell-off. We expect a retracement toward the supply zone before shorting to the outlined drop target.
Let us know your view on this setup.
VIBusdtVib is on cup and handle now it's on u shape formation
Wait for 50% profit mark my word ....
Cheers

New opportunities for earning money on VIPTo date, we have come close to a change in the quarter and a high probability of increased volatility. The second half of the monthly candle on ether opened in the negative zone, which gives a signal to hold sales until the end of the quarter. However, in recent days, individual coins have the opportunity to work out their accumulated potential with a bullish reversal of the monthly candle. VIB is currently the most oversold coin without the monitoring tag. Against the background of the pinbar of the last monthly candle, there were few buyers this month, but technical buy signals were left up to a 0.1 retest even with the current market position.
In an optimistic scenario, today's daily candle may turn bullish with continued purchases until the end of the quarter. Negative statistics on the United States today may contribute to this. In the case of a reversal in the current quarter, the target may be a local breakout and retest of the trend line formed by the previous breakdown.
With less volatility and strong statistics coming out in the US today, the probability of a rebound from the retest of past hows in the range of 0.110-125 and a transition to a flat near the key long-term level of 0.075 +-15 prevails. In this case, the start of purchases may be delayed until the opening of a new quarter, or the next announcement on the assignment of the monitoring tag.
The main long-term support is 0.035, a hike below which is possible only under extraordinary circumstances with the withdrawal of ether by 1,500, the dominance of alcoins by 7.5% or the assignment of the monitoring tag. Given the current oversold conditions and high targets, assigning the tag will only give a temporary departure below 0.035 with further growth to 0.075, similar to vidt.
In addition to vib, among coins without the monitoring tag, so far I am considering only pda with a possible new wave of growth, especially if the tag is not assigned in the new month.
The coins that already have the monitoring tag are the most oversold on binance, due to which they have shown good growth impulses in the last two weeks against the background of attempts to reverse the quarter. Before the next delisting announcement, there is time for new waves to reverse the current quarter under an optimistic scenario, as vidt shows, and a pullback already in the new quarterly candle. The most interesting scalping companies among this group today are uft troy alpaca with a growth potential of up to 100%+ and cream nuls with a possible growth of up to 50%+.
A new wave of VIB growthToday, another opportunity has formed for vib, which once again showed the best dynamics in January with a breakdown of 90%+. The year for the token opened quite positively above 0.0975, which gives a signal to consolidate above 0.01 in the future. The last impulse was given by the collapse of the last peaks, which gives a signal for at least a retest of strong resistance at 0.105, consolidation above which ensures an increase in volatility up to 0.15-25, especially considering the strong signal for a collapse left before the new year. At the moment, the price has traded near the long-term support of 0.055-625, a hike below which is likely only in the case of serious force majeure with a drop in ether by 1500-1750, bitcoin by 75k, or the assignment of the monitoring tag to the token (I expect the next tag changes in early April).
Given the successful opening of the second half of the quarter above the interim support at 0.06 and the time reserve before the possible assignment of the tag, there is a high probability of a repeat attempt to reverse the quarter. It is highly likely that we will see a strong resistance test at 0.075 by the end of the week with a likely breakdown, given the significantly higher final targets. If a new week opens above 0.075, there is a chance of stable support for purchases with breakouts at 0.0925, 0.105 and higher. To date, the token is the most oversold on binance and has the greatest growth potential of up to 100%+ among coins without the monitoring tag. There is also a possibility of adding futures, in which case growth up to 0.25 will not take long. In case of a fall below the 0.0550-625 support, a return to the retest of this resistance up to 0.075 is almost guaranteed, given the current oversold conditions, which makes investments quite reliable.
At the moment, the token is well suited for storing funds in an average amount along with og uft pda vidt.

Prepare to BUY Spot VIBUSDT for an Intraday Trade
🌟 Capture Quick Gains with VIBUSDT! 🌟
🌍 Market Overview:
VIBUSDT is presenting a strong intraday opportunity, offering the potential for rapid gains within a single trading session.
📊 Trade Plan:
📌 Entry: $0.11 - $0.12 – Accumulate within this range to optimize your position.
🎯 Target: +30% – Aiming for a quick profit within the same day.
⏳ Hold Time: Intraday – Ideal for short-term traders seeking fast returns.
🔍 Strategy Insights:
Utilizing my custom indicator RainBow MG3, VIBUSDT has been identified as a high-potential asset for intraday trading.
Volume spikes and favorable price action support a quick upward move.
🚀 Next Steps:
💬 Contact me if you need further assistance or tailored strategy advice.
💡 Note: This is not financial advice. Always DYOR before trading.
🔥 VIBUSDT is poised for quick gains – Execute with confidence! 🔥

VIBUSDT (Viberate) Updated till 26-12-24VIBUSDT (Viberate) Daily timeframe range. this thing absolutely on roll. it had a really well retrace back from its local low. very close to price discovery level. breaking that clean will ensure outperformance. recent support at 0.10234.

VIB/USDT %531 Daily Volume SpikeVIB/USDT has experienced a 531% increase in trading volume , which suggests a surge in interest and potential for volatility. By leveraging techniques like Heatmap Analysis , Cumulative Volume Delta (CVD) , and Volume Footprint , we can pinpoint precise demand zones and trading opportunities.
Key Indicators and Techniques:
Heatmap Analysis:
Heatmaps reveal areas with significant bid clusters, helping identify key demand zones.
These zones often align with institutional or large trader activity.
Cumulative Volume Delta (CVD):
Look for divergence between price and CVD:
If price is flat or falling while CVD rises, it signals hidden buying pressure (bullish).
If price is rising while CVD decreases, it suggests distribution and potential reversal (bearish).
Volume Footprint:
Use footprint charts to spot imbalances between buyers and sellers.
Areas with aggressive buyer dominance typically mark strong support levels.
Analysis on the Chart:
Demand Zone (Blue Box):
Identify a demand region where significant volume spikes occurred.
This zone is likely an accumulation area and acts as a potential support level.
CVD Divergence:
Watch for divergence between price and CVD:
Bullish divergence = buying pressure.
Bearish divergence = potential reversal or distribution.
Breakout or Rejection:
Monitor price action at the blue box:
A breakout with volume confirms bullish continuation.
A rejection may signal a pullback to lower levels.
Volume Confirmation:
Ensure any breakout or breakdown is supported by strong volume to avoid false signals.
Trading Strategy:
Long Setup:
Enter near the blue box if supported by CVD divergence or volume imbalance.
Target resistance levels or Fibonacci retracements.
Final Notes:
Always wait for volume confirmation before entering trades to avoid false breakouts or breakdowns.
Use proper risk management and limit leverage to safeguard capital.
I keep my charts clean and simple because I believe clarity leads to better decisions.
My approach is built on years of experience and a solid track record. I don’t claim to know it all, but I’m confident in my ability to spot high-probability setups.
If you would like to learn how to use the heatmap, cumulative volume delta and volume footprint techniques that I use below to determine very accurate demand regions, you can send me a private message. I help anyone who wants it completely free of charge.
My Previous Analysis
🐶 DOGEUSDT.P: Next Move
🎨 RENDERUSDT.P: Opportunity of the Month
💎 ETHUSDT.P: Where to Retrace
🟢 BNBUSDT.P: Potential Surge
📊 BTC Dominance: Reaction Zone
🌊 WAVESUSDT.P: Demand Zone Potential
🟣 UNIUSDT.P: Long-Term Trade
🔵 XRPUSDT.P: Entry Zones
🔗 LINKUSDT.P: Follow The River
📈 BTCUSDT.P: Two Key Demand Zones
🟩 POLUSDT: Bullish Momentum
🌟 PENDLEUSDT.P: Where Opportunity Meets Precision
🔥 BTCUSDT.P: Liquidation of Highly Leveraged Longs
🌊 SOLUSDT.P: SOL's Dip - Your Opportunity
🐸 1000PEPEUSDT.P: Prime Bounce Zone Unlocked
🚀 ETHUSDT.P: Set to Explode - Don't Miss This Game Changer
🤖 IQUSDT: Smart Plan
⚡️ PONDUSDT: A Trade Not Taken Is Better Than a Losing One
💼 STMXUSDT: 2 Buying Areas
🐢 TURBOUSDT: Buy Zones and Buyer Presence
🌍 ICPUSDT.P: Massive Upside Potential | Check the Trade Update For Seeing Results
🟠 IDEXUSDT: Spot Buy Area | %26 Profit if You Trade with MSB
📌 USUALUSDT: Buyers Are Active + %70 Profit in Total
🌟 FORTHUSDT: Sniper Entry +%26 Reaction
I stopped adding to the list because it's kinda tiring to add 5-10 charts in every move but you can check my profile and see that it goes on..

Probable move over VIBAgainst the background of maintaining purchases this week, there is a fairly high probability of moving over VIB, which has already given 6 waves of 25-70% over the past two months. Trying to grow against the established bearish trend on the monthly chart, technical rollbacks occur from most levels to the base of the previous figure, which gives new and new opportunities for scalping, despite the fact that the token remains in a rather oversold position with a small risk of drawdown. So far, the goal in the case of a calm market is to continue the reversal of the annual candle with an attempt to test the range of 0.15-25.
To date, we are drawing a shadow on a new weekly candle. The main reversal zone is the flat range of 0.0875-950 near the strong formed support level of 0.09. The opening of the month above 0.075 gives a signal for an attempt to consolidate above 0.1. The opening of the second half of the month above 0.09 supports this dynamic.
In an optimistic scenario and in the absence of a deeper pullback on the tops, a reversal and return to the bullish VIB trend is possible today with a reversal of the current daily candle into a bullish one. With less volatility and the closing of a new daily candle above 0.09, a return to the hay is likely within a couple of days. With a reversal today and tomorrow, there is a possibility of returning to the top of growth in the binance, even with a small percentage of price increase, given the low–volatility market. This could lead to a sharp influx of liquidity and a new breakdown, which we observed over the weekend. The new wave can give up to 50-70% growth at least.
With an extremely negative market and disruption of the tops, there is a probability of a deeper retest of 0.075-80. To date, a retest of this range is more likely at the end of the month after the breakout and in the absence of price consolidation above 0.125 or with a rebound from this level from the third wave.
Besides OG and TROY, VIB has the highest goals among coins without a monitoring tag.

Bullish ViberateBINANCE:VIBUSDT
Double bottom pattern ++
Vib predicted price is about 0.69 -0.70 USDT ..

VIBUSDT(Viberate) Daily tf Range Updated till 12-06-24VIBUSDT(Viberate) Daily timeframe range. holders for this one looks like not giving up as even through market dump its being solid above its local support. but PA is not very stable as wicks here and there. 0.08778 needs to hold or it will fall back to 0.06694.

A new opportunity for VIPAs we approach the middle of the quarter, the bulls are trying to restore the price of ether to the range of 3250-3500 to consolidate purchases for the second half of the quarter, in case it opens in this range. Against this background, from 2900-3000 on the air and 61-65.5 to the cue ball, there is a fairly high probability of a new wave of growth this week and next. Against this background, new short-term coin toppings can be made. To date, vib is showing itself very well, giving two waves of growth of 40% each, but the medium-term goals are at a retest of 0.150-175 with a high probability of going to 0.25 in the event of a breakdown by ether 3500. At the moment, the short-term bullish trend line clamps the vib price into a triangle with a key level of 0.1, if taken, we can expect a sharp increase in volatility to 0.125-150 at least, which we have already observed. If the second half of the quarter opens above 0.125, the road to growth to 0.25-50 in this quarter will open. According to vib/btc, there are signals for growth up to 10X, which makes the coin reliable for investments in the average market.

vib is aimed at the hay testThis week we are passing the middle of the month and it is time for attempts to turn monthly candlesticks into bullish ones for individual coins. VIB still has extremely high potential with medium-term goals up to the 0.25 test. Today, the momentum for the month's reversal immediately passed, but these are only the first investments for the upcoming trend. On the weekly chart, according to the indicators, we remain in a bullish trend for a long time, which will support growth. The main technical signal is the left overshoots on the weekly and monthly charts. Also, in addition, the ground for breakouts will be created by general attempts to grow the market for a turn of the month by tops. Sales continue for the first half of the week based on the inertia of last week, but more active purchases can be expected from the middle of the week. The reason for the growth will also be the weakening of the dollar against the background of events in the Middle East, which I also expect from the second half of the week. The main area of the set of positions for vib today is the range 0.085-90. With an optimistic scenario and the implementation of a reversal already this week, there is a high probability that the month will end before the end of April. With a negative market, the trend will be smoother, with the 0.15 test already in the new monthly candle.
Oax pros and ooki have similar potential, which today I primarily consider to work as the most oversold coins with the highest unprocessed goals. Pros and ooki are less volatile due to the lack of a pair to btc. According to oax, we can expect at least a retest of 0.35, according to pros, a return to the bullish trend followed by a test of 0.75, according to ooki, the target on the retest is 0.0050-75.

Profit up to 100% on VIBAfter the rollback of the new quarterly candle, the time for the continuation of the trend for individual coins from the second half of the month is approaching. In the upcoming run, vib looks interesting, which is well suited for storing free funds in the medium term. The main target is the 0.25 level. Technical signals for a trend up to 10X from current levels were previously left in a pair with BTC. Unfortunately, we could not open the quarter above 0.125, which would provide a fast trend to 0.25+, but opening above 0.11 gives a signal for the trend to continue at a slower pace, therefore, after drawing the shadow on a new quarterly candle this week, we can expect a return above the formed trend line and an attempt to grow to 0.25 if successful taking 0.125. Given the candlestick pattern on the weekly chart, with a move on the last weekly candle, in case of a new move this week, we will get the opportunity for a stable trend until the end of the month. After waves of 35-40%, at the moment there is a good opportunity to take up to 100%.
In addition to vib, I also expect new HAI from pros and ooki in the current quarter.


✴️ Viberate Easy 135% (Trading For Beginners Explained)This is another Altcoin pair that looks easy to read; notice the volume.
Today we have really high volume and volume has been good since early June. Buy/green volume is always predominant in this chart, a strong giveaway signal.
A very clear higher low is present, Aug. vs June, and that's all we need...
This is how a trader would do it:
- Buy and hold.
- If prices move and close daily (or weekly, your choice) below 0.3100, stop the trade at a loss.
- Anything else, simply wait.
- If prices break up you have a winner and you can apply any "selling for profits" strategy that you wish.
There are only two options, buy and sell with wait/hold in between.
That's trading made easy.
Namaste.

Vib will repeat the success of oaxThere remains the last day before the end of the quarter and the last opportunity to try to open a new quarter above the key level for coins. Considering yesterday's dynamics of oax, the probability of an attempt to take 0.25 on vin has increased. A double bottom has formed from the new trend line and technically there is ground for a breakdown. In the case of overshooting from the third wave above 0.15, the target range will be 0.23-35 in the same way as oax.
Ooki, unlike oax, shows more sluggish dynamics even with a positive technical picture. Due to the lack of a stable breakdown of even 0.0045, there is still no talk of moving into the range of 0.0050-75, which may lead to a trend reversal and a return to 0.0025-35. According to proc, the picture is more optimistic, a position is being set after a successful retest of 0.5 and on the 4-hour chart there is also a probability of a breakdown from the third wave with a test target of 0.75. There is also a possibility of a new wave of pump for drep and pnt as part of the pullback on the current weekly and monthly candle.


#VIB is bullishBreaking the recent bear channel , HOSE:VIB turned bullish. Tiny drops are necessary and important.
NOT FINANCIAL ADVICE.

#VIB/USDT#VIB
We have a bear flag on the 1 D frame.
It was broken downward and is expected to touch moving average 100 and then return to the rise again.
Support and entry area 0.0600
First target 0.0718
Second goal 0.08142
Third goal 0.08921
Which represents 170% of the support point

VIB ANALYSIS (4H TF)If it reaches the flip range once again, it is suitable for a buy/long position. We will not enter the position above the flip range.
I specified the targets. Closing a 4-hour candle below the green range will violate the analysis. Do not enter the position without setting stop and capital management.

VIB 1d is bullish but...VIB is very bullish but we need either
1. to close above the mentioned yellow area for 1d
or
2. wait for a retest for the area below and enter from there
3. Don't FOMO and patience is the key here
You have great and potential targets for the long run
All the best insha Allah!

BTC To Where easy to read !!!All my TA is for Education purposes , Btc to 42k then what we stay to see a huge correction soon
