VIDT BIG looser from Binance Delisting, any chance for recovery?VIDT got absolutely nuked after the Binance delisting announcement, leading to a brutal sell-off and a local ATL (all-time low). But now things are getting interesting...
🔻 Falling wedge has formed on the 4H chart — a classic bullish reversal pattern.
📉 RSI is printing bullish divergence, signaling

VIDT - Die or FLYUPDATED Chart with travel channels:
VIDT got absolutely nuked after the Binance delisting announcement, leading to a brutal sell-off and a local ATL (all-time low). But now things are getting interesting...
🔻 Falling wedge has formed on the 4H chart — a classic bullish reversal pattern.
📉 RSI is

VIDT - I know it's being delisted IDEAWe all know by now that VIDT is being delisted from Binance, and yes, that’s a heavy hit. But seeing this crash from 35 sats to just 5 sats in a matter of hours—it’s hard to ignore. Honestly, the urge to scoop some up here is real.
There’s a clear bullish divergence on the chart, but let’s put that

Is VIDT about to drop? Don’t ignore the bearish signs! (3D)Note: The funding fee for this asset in futures is very high, and it's also a highly volatile and risky asset. Be cautious when taking positions on it.
Note: This coin is on Binance's delisting red list.
Since the point where we placed the green arrow on the chart, this asset has started forming a

Short VIDT40% on 20x leverage will make generational wealth. The downside is solely based off my model prediction and current volatility measurements and that the asset is being delisted.

VIDT: High-Risk, High-Reward Setup at Range Low#VIDT is moving in a clear sideways range, and we’re now trading right at the lower boundary. This is a high-risk trade, but the potential reward justifies the setup—especially if we see a strong bounce from current levels.
Don’t miss the next moves—make sure to follow for more setups like this.
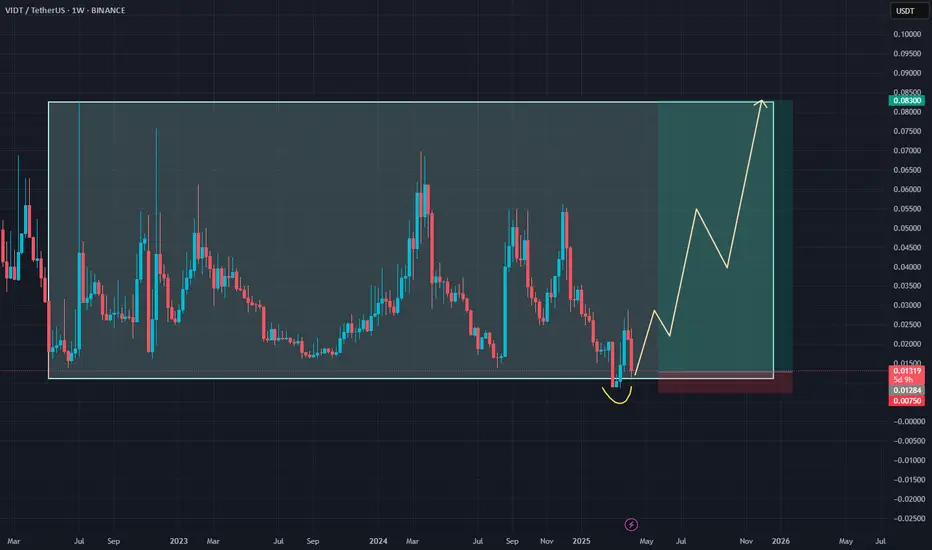
Bullish coin VIDT#VIDT Bullish continuation
TA: U Shape chart
FA: No fundamental, just like REEF TRB bullish formation.
Zoom out a little for the bigger picture

VIDT Datalink Hodl positionVIDT looks to clear the weekly descending trend-line at $0.04000 so it can commence its bull market structure.
Wait for break above and buy the strength

VIDTUSDT CHART ANALYSİS - EDUCATIONAL POSTConclusion
The NFT market is developing extremely fast, and the blockchain infrastructure has undergone significant changes over the past few years. However, today, there are still many questions about how the NFT market can function and in which areas non-fungible tokens can be used.
For example

VIDTUSDT(VIDTDAO) Updated till 28-03-25VIDTUSDT(VIDTDAO) Daily timeframe range. PA trying to hold above its 0.01233 level. it can have some relief if it gets a valid close above 0.02066. not so much retail interest it can see better day if market gets some volume.

See all ideas
Summarizing what the indicators are suggesting.
Oscillators
Neutral
SellBuy
Strong sellStrong buy
Strong sellSellNeutralBuyStrong buy
Oscillators
Neutral
SellBuy
Strong sellStrong buy
Strong sellSellNeutralBuyStrong buy
Summary
Neutral
SellBuy
Strong sellStrong buy
Strong sellSellNeutralBuyStrong buy
Summary
Neutral
SellBuy
Strong sellStrong buy
Strong sellSellNeutralBuyStrong buy
Summary
Neutral
SellBuy
Strong sellStrong buy
Strong sellSellNeutralBuyStrong buy
Moving Averages
Neutral
SellBuy
Strong sellStrong buy
Strong sellSellNeutralBuyStrong buy
Moving Averages
Neutral
SellBuy
Strong sellStrong buy
Strong sellSellNeutralBuyStrong buy
Displays a symbol's price movements over previous years to identify recurring trends.