$SNAP BreakoutClosing in on its IPO high from 2017. Not the greatest fundamentals here, but the kids love it! Its breakout success will be telling of the environment.
SNAP trade ideas


Broke Resistance. Just broke Resistance. MACD looking bullish with increasing Green. Uptrend channel still intact.


Snap going upTesting all time highs with positive momentum on the macd growing... looking for a test of the 1.68

SNAP CUP & HANDLE.. Short and long opportunity Snap 4hr Chart
I am shorting SNAP here and will start to get calls to long when it gets closer to my support zone at 22. I am playing this Handle down and will get calls on the breakout of the Handle to complete the cup and handle!

SNAP to 26$ UPDATE If you caught this movement when i posted you should be up big! 26 is my PT but wall street analyst upgraded pt to 28 so could we see more? Keep in mind we have a gap down at 24.70 so once we hit those new week highs expect a pull back!

snap heading to ATH?After the recent upgrades to this stock, and looking at it from a technical side snap is closing in on an important level after its close yesterday. If it can break out here Snap can very well head to a new ATH. I bought into this trade yesterday with itm calls of 25 strikes and some 26 which had a decent amount of volume expiring on 10/16 .

$SNAP All Time High on the way
Extremely bullish move off the lows and outperforming the market
Very bullish option action

SNAP moving After HoursPosted this chart earlier, if you held SNAP and we continue to this after hour surge we're gonna be up good tomorrow morning! SNAP up 1.98% AH

SNAP overextended after rally today, target 22-23.5SNAP had a great run today, but made higher high with a lower MACD, potential sign of an imminent correction. History usually repeats itself in the markets, we had a similar patter a couple weeks ago with a failing MACD and rising share price, and then witnessed a 8% correction, so watching this stock closely in anticipation of the drop to potentially get some upside.


Uptrend channel for SNAP.Snap appears to be in a uptrend. Have an option call on SNAP for October 10 28.5.

SNAP to 26$SNAP PT upgraded by Wall Street analyst to $28... waiting for breakout of this ascending triangle! also another stock to add shares for long term portfolio

DAX analysis of SNAPHi friends
the daily chart of this market shows with a strong probability an uptrend in the coming days but it is also necessary to be vigilant of the change towards the opposite direction
please subscribe to receive more analyzes

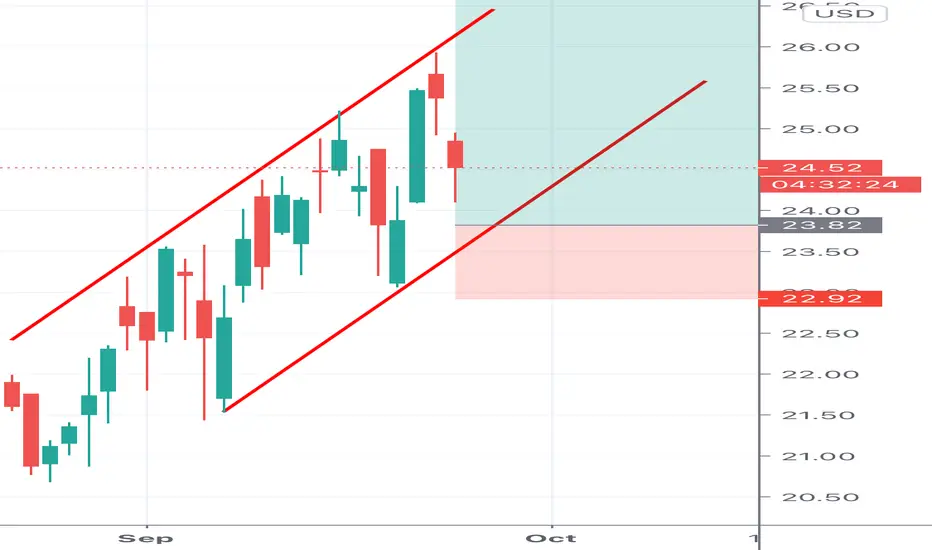
$SNAP Channel Support Long $SNAP Channel Support Long
$SNAP has formed channel up & is testing lower band of channel. If support holds, go long for retest of highs at $26.50.
One of my favorite basic strategies is relative performance. $SNAP has been a clear standout since September 3rd (first day of correction) - $QQQ is down over 12% while $SNAP is up over 3% (and at one point up 10%). In this sense I am looking for continued strength from $SNAP as an ex-index play - countertrend plays that are not trending with overall market.
BTO $SNAP 10/16 $25c avg $.85


First ChartThis is the first charting I have ever done. Looks like Snapchat is forming a cup and handle.

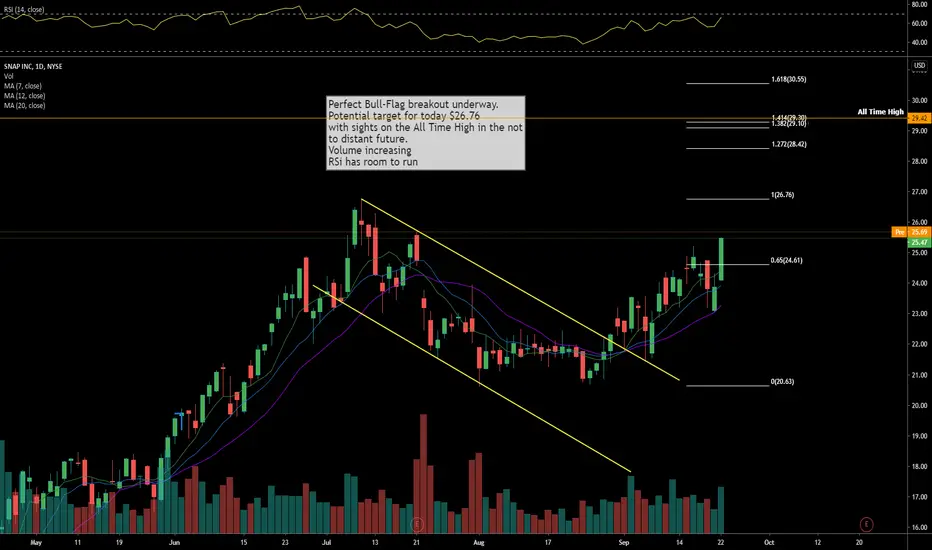
$SNAP on way to All Time High
Perfect Bull-Flag breakout underway.
Potential target for today $26.76
with sights on the All Time High in the not
to distant future.
Volume increasing
RSi has room to run
Rallying despite the Nasdaq, S&P 500, Dow Jones correction #3Double top or nice breakout
Which one will occur?! Well, time will tell us, but we can look for the signs.
If it gets above 26.87 with HUGE volume, it is a good indication for a longer rally.
If the resistance will be strong enough than a double top will develop.
