Trade Signal Alert: VITE/BTC PairDear traders,
We have a new trading signal for the VITE/BTC currency pair, generated using the EASY Quantum Ai strategy.
Direction: Sell
Enter Price: 3.8E-07 BTC
Take Profit: 3.6E-07 BTC
Stop Loss: 4.2E-07 BTC
Rationale:
The forecasting is based on a combination of several technical patterns and indicators analyzed by our advanced EASY Quantum Ai model. The key factors leading to this bearish sentiment include:
1. Resistance Levels: Recent price movements have shown a buildup of selling pressure near the current resistance level, indicating potential bearish momentum.
2. Volume Analysis: A decline in trading volume suggests a decrease in buying interest, which supports the downward trend.
3. Market Sentiment: Current market sentiment analysis shows a shift towards bearishness, contributing to the projected price decrease.
By following this signal, traders can capitalize on the anticipated decline, with a calculated risk management approach via the specified Stop Loss and Take Profit levels.
Please remember that all trading involves risk, and it is crucial to execute trades with caution and consideration of your financial situation.
Happy trading!
VITEBTC trade ideas

VITE | Potential For Fast Growth (535% Target Mapped)This is a pair that has potential to grow fast, once it gets going.
VITEBTC went flat recently, that is, the low remained the same for multiple sessions. After almost two months of the same high, on very low volume, we have a strong bullish breakout. This bullish breakout can be the start of an impulsive bullish wave.
We can see a very strong and fast move develop in the weeks to come. This will move fast, like DATAcoin.
Namaste.

Vite 230% Bullish Wave Supported by Classic SignalsAnd every now and then we go back to basics...
Notice the 16-Feb. session; The long upper wick or shadow is there to remove resistance. Normally, a long upper wick would be considered bearish but this is not the case here. When we add some context, the chart reveals the full picture.
This session has really high volume, the highest on daily basis since November 2022.
The day closed above EMA50 and was supported by a strong RSI. These signals help us determine that the upper wick is a move removing resistance rather than a rejection.
And then we have a break of MA200 today. Once this level is conquered, the pair is ready to grow long-term.
The bullish divergence with the RSI has been mentioned many times recently and is also a classic. These are all pointing higher... 170%-230% is only the initial move —much more is possible long-term.
Namaste.

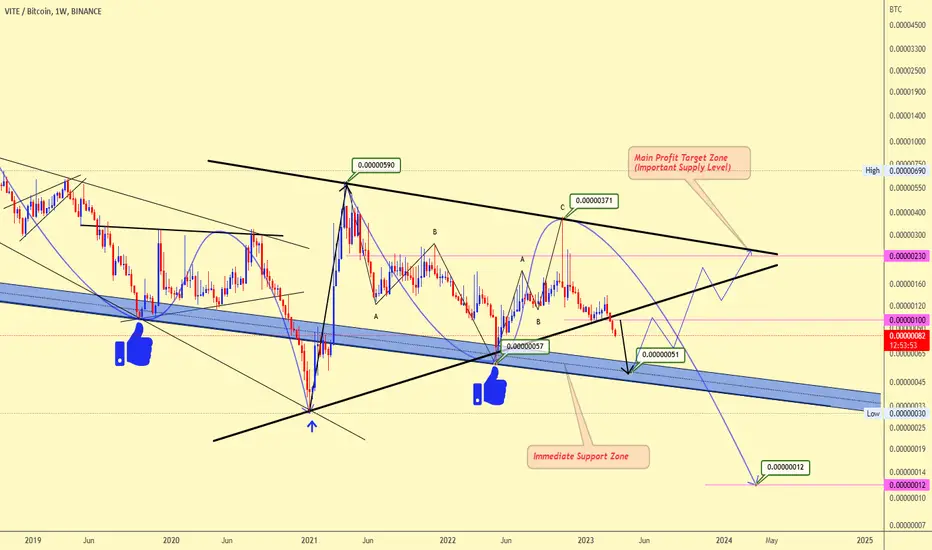
ViteBtc Trading ideaAs you can see from the chart, VITE/BTC has recently broken down below the trendline support. This breakdown is likely to lead the price towards our designated zone of accumulation, which is shown as a slant channel around 0.00000051. We have identified this area as a potential turning point for the pair, offering a possible buying opportunity for traders.
If the price indeed bounces from this accumulation zone, our expected target for VITE/BTC would be around 0.00000230. This represents a substantial upside potential from the current level, making it an attractive risk-reward trade setup.
However, it is crucial to consider the alternative scenario. If the price breaks down below the immediate support zone at 0.00000051, we could see a further decline towards the next support level at 0.00000012. In this case, we would recommend reassessing your trading strategy and monitoring the market for new developments.
This analysis is for informational purposes only and should not be construed as financial advice.
✳️ VITE Hits Bottom, Prepares To Grow (150% Potential)VITEBTC just printed a reversal 3D candle 10-May.
The current candle is full green and supported by a rising RSI.
The May 2022 low/support has been activated.
Last time this level was activated a massive 555%+ bullish wave followed.
Something similar is possible this time around.
Here I am mapping for you ~150% potential but there can be more.
Namaste.

✳️ VITE (Fast ALTSBTC #3)
We continue with the trade ideas with pairs that are set to move strong against Bitcoin, fast.
The bullish signals already confirmed.
Fast ALTSBTC | Altcoins vs Bitcoin #3
---
Altcoin (PAIR): VITEBTC
Trend: Up
Potential: 118% to 342%
---
Wishing you great profits and success.
This is not financial advice.
Namaste.

#VITE/BTC [VITE]: Bollinger_Breakout Super_TrendWe've identified both a Bollinger Band breakout and a Super Trend pattern on the VITE/BTC chart. Both indicators are signaling a bullish trend, with the Bollinger Band indicating a potential bullish trend as the price has moved outside of the upper band and the Super Trend showing a bullish trend. This is a stronger bullish signal as both indicators are aligned. It may be a good idea to consider buying at the current price zone and targeting higher levels. However, it is still important to consider other factors such as overall market conditions, and other technical indicators before making a trade decision. .


VITE formed a bullish Gartley for upto 15.50% pumpHi dear friends, hope you are well and welcome to the new trade setup of VITE coin.
Previously we caught more than 74% pump of VITE
Now on a daily time frame, VITE has formed a bullish Gartley pattern.
Note: Above idea is for educational purpose only. It is advised to diversify and strictly follow the stop loss, and don't get stuck with trade

VITE EXCHANGER PREDICTIONVITE Lab blokchain with 0 fee i think many project to building with XNO$ nano very fast transaction and 0 Fees..
0.36$
1$
2.3$

VITE vs BitcoinOn the above 1-day chart price action has corrected 70% since early April. A number of reasons now exist to be bullish. They include:
1) Price action breaks out of resistance following a ‘incredible buy’ signal.
2) The 10-day EMA crosses up the 21-day EMA.
3) Price action makes an impulsive move to the upper half of the Bollinger Band (not shown here).
4) On the weekly chart price action has corrected to the golden ratio and prints a Bullish engulfing candle.
5) Have studied a lot of alt-coin / BTC pairs recently. This is one of a few (the others being Metal MTL and another I’ll publish soon) that have broken through both 21-weekly and 50-weekly EMAs.
Is it possible price action falls further? Sure.
It is probable? Very unlikely.
Target? 600-650 sats / 350%
Good luck!
WW
The Weekly chart

$VITEprobably a good idea to get a bag of this
stoch crossing on weekly
D3 MACD cross
volume only 10 corn for now so imo weekend scam pump loading
looks to have broken downtrend
binance ieo coins pumping
30% till range high invalidation below 127

$VITE - been a whilelooks like this might have a decent break sooner rather than later
chilling above 200
decent accumulation
weekly stoch turning up we just need some volume to blast us through 186 for 266

VITE/BTC Looking 🔥 2000% PROFIT?!VITE/BTC
Vite has built a Directed Acyclic Graph (DAG) based smart-contract platform, with a Snapshot Chain structure to facilitate zero-fee transactions and optimize transaction speed, reliability, and security.
Technically lying above strong support. RSI is in the oversold region. MACD is showing bullish momentum. It will pump hard from here. so now is the right time to build your position in it before breakout for massive profits😊
Targets: 142-185-240-300 satoshi

VITE Takes Off (80% Breakout)VITE takes off on really high volume and prints 80% on today's candle.
We have the highest trading volume since April 2021.
We can also see prices moving above EMA50.
Daily candle closes within 35 minutes.
A new bullish wave is about to develop...
Right after you buy, you set your sell orders on target.
Here is the chart:
Enjoy the profits.
Namaste.

VITE-BTC WeeklyHi
As you can see in the chart. It is an accumulation phase for VITE (per BTC ). First Target is 0.00002481 it can raise to 0.00015674. SL (Stop Loss) is under 0.0000003.

VITE/BTC VITE/BTC like this setup.
VITE been in range/accumulation mode for almost 700days + with fake breakout and fake break down. Looking at OBV we have very clear divergence ( On-Balance Volume ) somebody is accumulating while the weak ones are exiting
Invalidation point 0.00000139 SAT.
On Balance Volume (OBV)=
On Balance Volume (OBV) measures buying and selling pressure as a cumulative indicator that adds volume on up days and subtracts volume on down days.
How this indicator works
The actual value of the OBV is unimportant; concentrate on its direction.
• When both price and OBV are making higher peaks and higher troughs, the upward trend is likely to continue.
• When both price and OBV are making lower peaks and lower troughs, the downward trend is likely to continue.
• During a trading range, if the OBV is rising, accumulation may be taking place—a warning of an upward breakout.
• During a trading range, if the OBV is falling, distribution may be taking place—a warning of a downward breakout.
• When price continues to make higher peaks and OBV fails to make higher peaks, the upward trend is likely to stall or fail. This is called a negative divergence.
• When price continues to make lower troughs and OBV fails to make lower troughs, the downward trend is likely to stall or fail. This is called a positive divergence.
Calculation
On Balance Volume is calculated by adding the day's volume to a cumulative total when the security's price closes up, and subtracting the day's volume when the security's price closes down.
If today's close is greater than yesterday's close then:
OBV = Yesterday’s OBV + Today’s Volume
If today’s close is less than yesterday’s close then:
OBV = Yesterday’s OBV – Today’s Volume
If today’s close is equal to yesterday’s close then:
OBV = Yesterday’s OBV
Vite/usdt

VITEBTC consolidating prior to major upward move?After the huge spike in April 2021, which sent VITEBTC out of the falling wedge, it bounced off of the previous dynamic resistance (which acts now as support) and seems to be in a consolidation phase prior to the next big move.
On the weekly, the MACD cooled off and seems ready for another upward movement.
The RSI (12 and 24) is below 50, which is not good at the moment, the RSI (6) points upward, so there has been more buying in the last couple days. If this continues, we should see RSI (12 and 24) also moving upwards.
KDJ seems to make a U-turn on the weekly.
On the weekly, it looks like the 50 EMA may move further upward. On the daily, EMA 50, 100, and 200 are very close together, with 50 < 100 < 200, so waiting either on buyers to step in or selling pressure to rise.
I am watching how this one evolves over the next couple days. If a daily candle closes below 169 sats that would be a clear sign of a downward move in my opinion.
However, I think a daily close above 216 sats could trigger an upward movement.
In case of breakout to the upside I see following target points:
TP1: 325
TP2: 490
TP3: 600
TP4: 766
TP5: 850
What is your opinion on VITEBTC? Any fundamentals in the near future that could send this one to the upside once consolidation is done?

VITE/BTC { VITE } - BULLISH SETUPANALYSIS 🔎
- VITE/BTC was resisted by the descending trendline resistance.
- Price brokeout above the descending trendline resistance.
- This is a bullish signal.
- Price action printed the double bottom pattern.
- The double bottom is a bullish reversal pattern.
- Price brokeout above the double bottom neckline resistance.
- This is a bullish signal.
- Price action is printing an ascending triangle pattern at the right bottom.
- An ascending triangle is a bullish build up pattern.
- There's a breakout potential.
BUY ENTRY ⬆️
- Market entry: current market price.
- Stop limit entry: breakout above the ascending triangle's horizontal resistance (@0.00000214).
- Limit entry: test of the ascending triangle's inclined support.
TARGETS 🎯
- Horizontal resistance level (@0.00000351).
- Horizontal resistance level (@0.00000431).
- Horizontal resistance level (@0.00000506).
- Horizontal resistance level (@0.00000600).
SETUP INVALIDATION ❌
- Breakdown below the ascending triangle's inclined support.

VITE/BTC buy opportunityBINANCE:VITEBTC is on the move, after big ABC pattern formation and higher lows, the pair may be ready for the next move up.
Don't forget to manage your risk! 👌
Good luck and trade with care 🙏
If you like my content - 👍 Like, 💬 comment, 👆 follow and 👉 share!
❗❗❗
Disclaimer: This information is not a recommendation to BUY or SELL. It is to be used for educational purposes only!

$VITE, Maybe, trying to wake up after a R/S flip over the ~160 $VITE
Maybe, trying to wake up after a R/S flip over the ~160 sats level..
Volume needs to appear in stronger way but the UCTS 1D Signal is there..
Will see how it goes..
#VITE


VITE/BTC buy opportunityHi followers,
BINANCE:VITEBTC is starting to move away from the support area,
With potential to visit the highs again.
Don't forget to manage your risk! 👌
Good luck and trade with care 🙏
If you like my ideas - 👍 Like, 👆 follow and 👉 share!
❗❗❗
Disclaimer: This information is not a recommendation to BUY or SELL. It is to be used for educational purposes only!
