Verasity: Your Altcoin Choice (S2)I will do a new Top Altcoins Choice session next week so if you missed the previous two sessions you can participate in the next one. You can choose any Cryptocurrency project you want and I will publish an analysis for you.
Today we are looking at Verasity (VRAUSDT) on the daily timeframe. It has a standard chart for a Tether (USDT) trading pair.
Volume started to grow in November 2024 and remained high.
Bullish volume is high in relation to bearish volume as VRAUSDT hit a major low. The correction bottom.
High volume was present 10-March and 7-April. Two decisive points and both ended green. A reversal comes next.
There is a downtrend and this downtrend has been compromised, it is no longer safe.
It has been broken and there is an initial bullish breakout, the retrace led to the test of the descending trendline, once resistance, as support. This is classic trend reversal behavior. The first reaction is always corrected into a higher low before additional growth.
This is the start of a major bullish phase. Verasity hit the lowest price since early 2021. There can be growth for months or even years. This is as good as it gets if you are a buyer, prices will not go lower. This is the best time to enter if you are considering a LONG (Bullish) trade.
Thank you for your support, I am wishing you the best.
Namaste.
VRAUSDT trade ideas

How about this chart?? I think Vra is like any other altcoin is in the sale zone, even though it hit a historical low.
Just look at the technicals in every other coin you will see it, all coins will thrive the moment risk-on markets comeback after positive news

VRAUSDT 1WVRA ~ 1W Analysis
#VRA Buy gradually from here if you still have a Conviction on this coin with a short -term target of at least 20%+.
Veracity end of wave 2 or whatI can see a 5 wave move up for the wave 1. Now trting to find the end of wave 2. We totaly backtested the top of wave 1 also lining up with a fib level. If we break the upper trendline we could be in a wave 3 making ath. If we dont we will go for the other 2 to jump in.

$VRA can break out soon#VRA can creak out this resistance and be projected to the next one around $0.004.
All depends by the news and overall the crypto environment

I think this is solid for vraKUCOIN:VRAUSDT
This is the core of the technicals for vra in my opinion.

VRA VRAUSDT
this is my latest update about vra in WXY correction
it took very long time to start bullish not just bra but all alt coins
target is 0.14000

VRA in 2025#VRA has been in a bearish trend since Oct 2021. The current price action isn’t bullish enough, so another dip is likely before a strong reversal.
The $0.00160–$0.00130 zone looks like a good buying area.
Passing $0.00815 confirms a shift.
Long-term hope remains as long as it stays above $0.00034.
#Verasity

VRAUSDTVRA over 0.002121 still shows very bullish
we are going to see huge pump soon on next 4 months
this is what shows in all altcoin structures not only vra
but vra market cap is only 23 million so any extra millions enter the market it gonna directly affect on price

VRA & BAND: Moving in Sync for 3 Yrs—Any Opportunity?OKX:VRAUSDC and COINBASE:BANDUSDC have have very similar moves for over 3 yrs—pretty interesting, right?
When two unrelated altcoins move so closely for such a long time, it might suggest that market makers or whales are managing liquidity in similar ways.
If this correlation continues, tracking one coin’s movement could give you clues about the other’s next move.
So, the big question is: which one will break out first?
Keep an eye out for any divergence. If one coin breaks out first, the other might follow, creating a lagging entry opportunity for both short and long positions.
What do you think? Will you add these two to your watch list?
🔴 Read my signature & publications for more info you don’t want to miss.
🔥 for more future "guesses" like this!
-----
🔮 Brief Intro for The Two Coins
Both VRA and BAND serve distinct purposes within the cryptocurrency ecosystem:
KUCOIN:VRAUSDT focuses on enhancing digital content engagement and combating ad fraud in the esports, gaming, and video sectors.
BINANCE:BANDUSDT provides critical infrastructure for connecting blockchain applications with real-world data, enabling a wide range of decentralized use cases.

Verasity bullishA quick recover is around the corner.
When coins like verasity fall off a lot like this they tend to recover very quickly.
Buying some spot here . Lets see if we get that bounce.

vravra is in safe area while is moving over 0.002121
we should be only careful in case it goes below this price
i only recommend now buying from this level with risk management

vra usdt entriesvra usdt. good project as we all know. but the pattern looks unfinished. based on liquidity pools and demand zone that will be a great entry point in my opinion. nfa

VRAUP possible R?hey
greeny days ahead of us, dont miss this GEM sitting at 35Mio CAP
Enjoy the profits!
de

VRA verasity looks in triangle if we analyze it in simple way
everything look clear in chart buying level is valid in current area
stop loss is too clear
the risk is on traders, this is only my view

$VRA possible Falling Wedge forming?If that is the case #VRA could be finally get the push we need to at least go to 0,0070, where there is the biggest resistance.

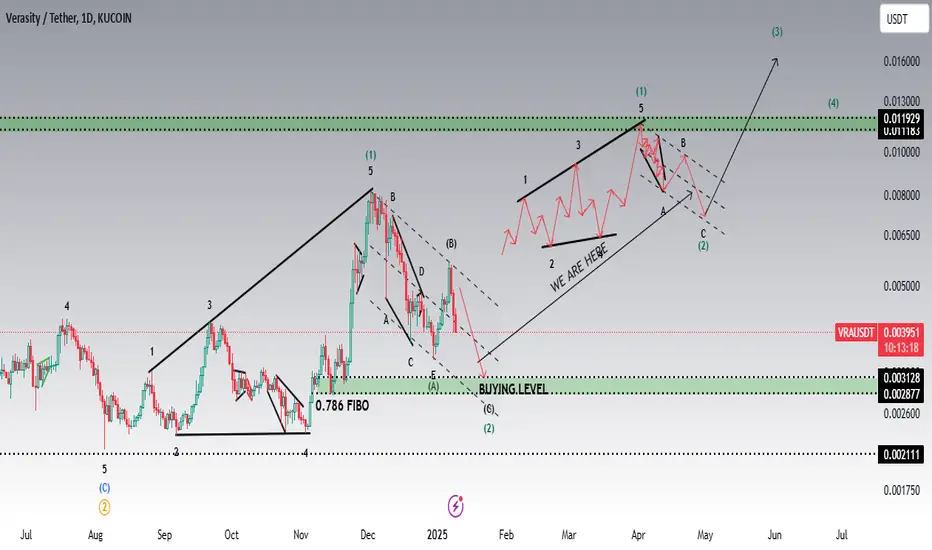
VRAUDT - Long Trade Idea Update - Weak 5-Wave Move In Progress..In this video, I share an update on the VRA long trade idea originally posted in November 2024.
I discuss how the current wave structure aligns with the pattern and its implications for the trade. The weakness in this move strengthens the expectation that, upon reaching our target, the price is likely to reverse downward.
Previous related ideas are linked below for reference.

$VRA repeating itself?I was analyzing the #VRA chart and Im seeing a lot of similarity from what it did in the last breakout, if it does, be prepared to a couple of ups and downs but then brace yourself!

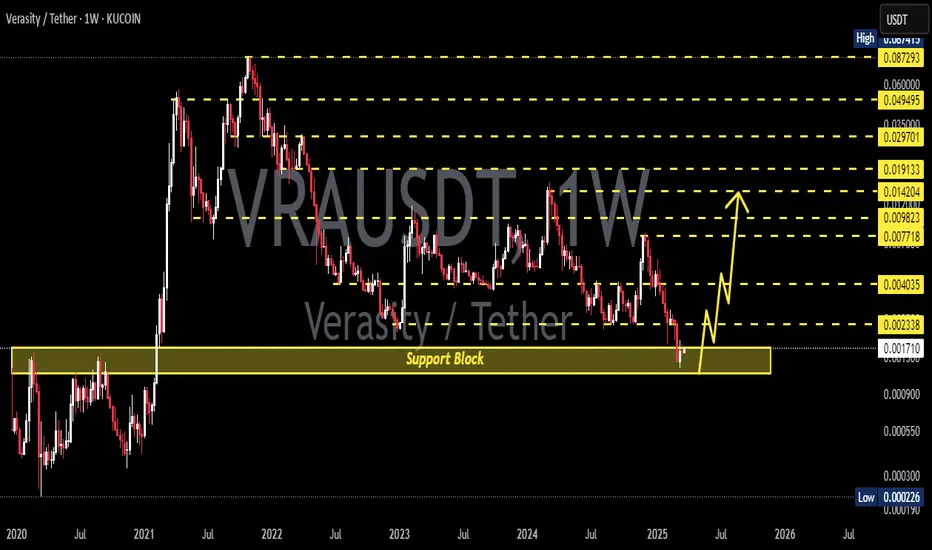
VRA LongThe Demand Zone (2023-2024) is showing a significant area of support where price has previously bounced. This area is crucial as it forms a base for future price movements.
The chart projects a Bullish Breakout (2025), where the price is expected to experience a sharp upward movement. The projected path indicates a series of strong rallies after the initial breakout from the demand zone. The price could reach higher levels, as indicated by the upward arrows.
The Time Exit is marked with the red text, which suggests a time window when it might be ideal to exit the position.
Potential Target: The price is projected to rise significantly after the breakout, with potential targets near the higher levels indicated by the chart's upward arrows.
Overall Outlook: The chart reflects a well-formed demand zone with an expected bullish breakout in 2025. Keep an eye on the demand area for potential entries, and monitor the time exit for possible profit-taking after the anticipated rise.

$VRAUSDTThis token just pop up on my RADAR.
this is like a GEM to me.. Good for holding this token for about 2-3yrs.
lets ride the never ending waves.
trade safe everyone

$VRAUSDTthis token pop up on my radar and it looks like ready to fly ..
let's ride the never ending waves..
looks promising GEM to me..
good for long term maybe 2-3yrs holding..
Trade safe!!

$VRA looking good after breaking out the resistanceIt has been a hard last month watching #VRA loosing support after support, but now it looks healthy.
Next big goal to aim is 0.0068, then I'm expecting a little bt of downside again because #VRA will get ready to finally break the main weekly resistance and go to the real bull run.
