XAUUSD.F trade ideas
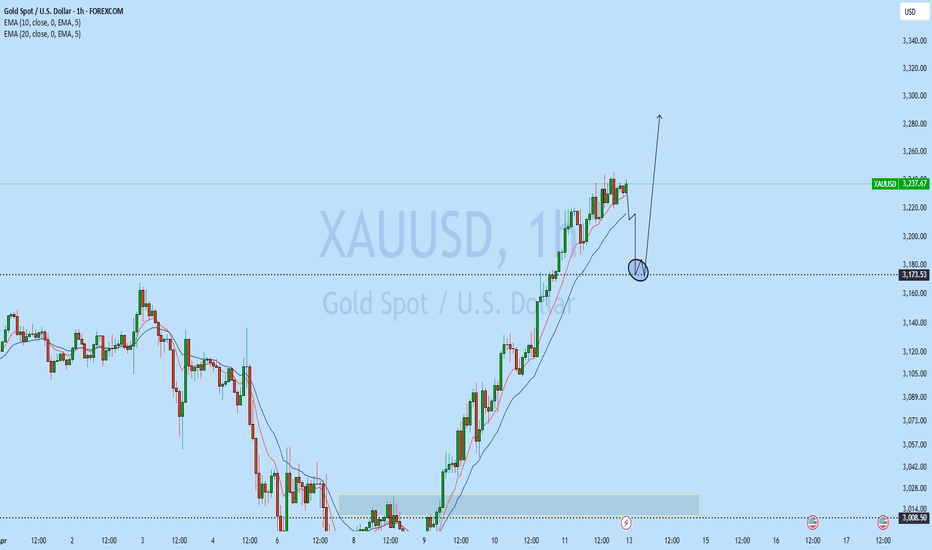
Gold: Sell@3188-3200Gold has continued its strong rally, hitting a new all-time high, with bullish sentiment running extremely hot.
However, we must approach this rationally — every new high is usually followed by a technical pullback.
Currently, the 3200 level is a significant psychological resistance, as well as a key threshold for short-term bullish momentum.
From a technical perspective, the sharp recent rally has shown signs of momentum exhaustion, with clear overbought signals emerging.
📌 Strategy Suggestion:
Consider building short positions around the 3188–3200 zone
If 3137 is broken, further downside could extend to 3112–3090
⚠️ Risk Management Notes:
The larger the rally, the stronger the pullback potential
Avoid chasing long positions at these levels to prevent getting trapped at the top
Keep position sizes under control and set stop-losses to guard against sudden volatility
Wishing everyone smooth trades and solid profits!
GOLD WEEKLY CHART MID/LONG TERM ROUTE MAPHey Everyone,
Following on from yesterdays update on our mid/long term route map after completing the 1h, 4h and daily chart route maps. We completed 3094 target and stated that we will now need this weeks candle to finish and close and/or ema5 lock above 3094 to open the gap above.
- Looking like no close above 3094 on the weekly candle, if price stays below this level on market close. Amazing to see the weighted levels levels being respected like this to allow us to identify new range gaps or rejections.
We will be looking for support and bounce on the channel half line or a cross and lock below the half line will open the lower range for the channel low Goldturns.
This is the beauty of our channels, which we draw in our unique way, using averages rather than price. This enables us to identify fake-outs and breakouts clearly, as minimal noise in the way our channels are drawn.
We will now come back Sunday with our updated Multi time-frame analysis, Gold route map and trading plans for the week ahead and also a new Daily chart long term chart idea, now that this one is complete.
Have a smashing weekend!! And once again, thank you all for your likes, comments and follows, we really appreciate it!
Mr Gold
GoldViewFX
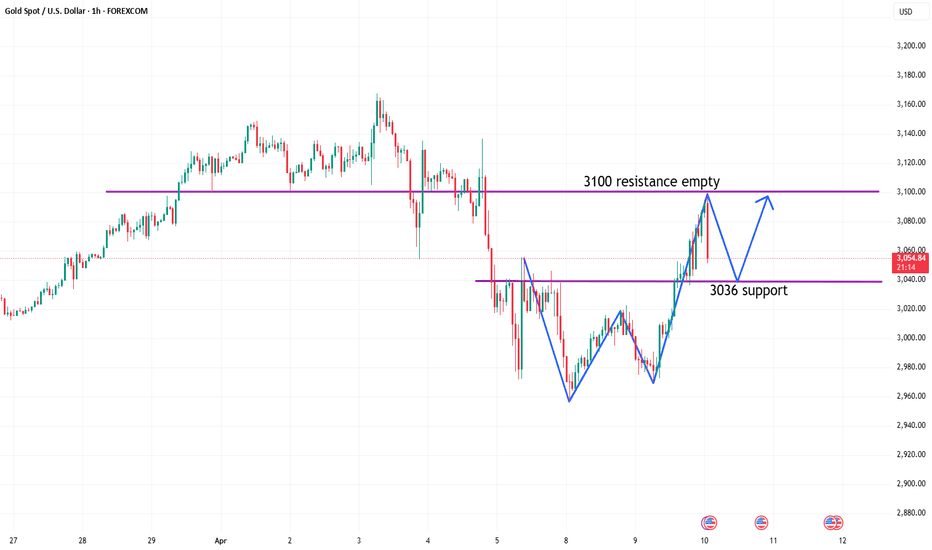
Will gold fall after its strong rise?From a technical perspective, if gold breaks through 3054 this week, the next major resistance level will be in the 3100 USD area. We need to pay special attention to this position on Thursday and Friday, as it is a key dividing line between long and short positions. If this position can be re-established this week, the upper side may test the historical high target again. At present, the downward momentum of gold has basically weakened compared with last week. If you want to operate, you can pay attention to the support near 3053. Before breaking through, any decline is a long opportunity. The upper pressure will first look at the competition near 3100. If it stands above, you can try to chase more aggressively. On the whole, the short-term operation strategy for gold is to short on rebounds and to buy on pullbacks. The upper short-term focus is on the 3095-3100 resistance line, and the lower short-term focus is on the 3035-3040 support line.
Gold operation strategy reference:
Short order strategy: Short gold rebounds near 3095-3098 in batches, stop loss 6 points, target near 3070-3050, break to see 3035 line;
Long order strategy: Long gold pullback near 3035-3038 in batches, stop loss 6 points, target near 3055-3065, break to see 3075 line;
Gold roller coaster market washoutThe 4-hour Bollinger Bands also closed, forming a head and shoulders bottom pattern at 2955 and 2970. Today, we will focus on the gains and losses of the double top at 3055, and then see whether it can form a unilateral surge. If the European session cannot break through 3055, you can go short in the 3050-3052 area below 3055. For gold today, it is still viewed as a shock. The support below is at the 3000 mark, and the pressure above is at 3052-3055, with strong pressure at the 3055 line. If it is still sideways and oscillating like yesterday, then be careful not to repeat yesterday's trend and turn down at night. On the whole, it is recommended to do more on pullbacks and short on rebounds in the short-term operation of gold. The upper short-term focus is on the 3035-3045 line of resistance, and the lower short-term focus is on the 2975-2970 line of support.
Gold operation strategy reference:
Short order strategy: Short gold rebounds near 3050-3052 in batches. Stop loss 6 points, target near 3030-3010, break to see 3000 line;
Long order strategy: Long gold pullback near 2998-3000 in batches, stop loss 6 points, target near 3025-3040, break to see 3050 line;
GOLD at The Edge of The CliffGOLD at The Edge of The Cliff
Gold is entering a bearish phase, with the Russian central bank leading the sell-off. I believe other central banks and hedge funds may follow, looking to take profits while prices remain high.
If more institutions join the selling trend, the drop could accelerate, potentially triggering a sharp decline in gold’s value.
You may watch the analysis for further details!
Thank you and Good Luck!
❤️PS: Please support with a like or comment if you find this analysis useful for your trading day❤️
XAU/USD: First Long,Then SHORT! (READ THE CAPTION)By examining the gold chart on the 15-minute timeframe, we can see that the price is currently trading around $3122, and I expect the price to soon reach higher levels such as $3128, $3133, $3135, and $3143, and after reaching each of these important levels, we will probably see an initial negative reaction!
Ultimately, I expect a strong rejection from the price once gold reaches $3144!
The level of this analysis is very high, so make sure to study it carefully!
Don’t forget to support this analysis!
Please support me with your likes and comments to motivate me to share more analysis with you and share your opinion about the possible trend of this chart with me !
Best Regards , Arman Shaban
4/9 Gold Trading Strategies
Gold opened with a mild bullish tone yesterday but faced resistance near 3018 , pulling back briefly before attempting a second push toward 3023 . However, the rally failed to sustain, and price returned near the opening level. Compared to recent sessions, yesterday marked a clear contraction in volatility, suggesting either a bottoming formation or a setup for a directional breakout.
From both candlestick structure and indicator alignment, the market appears primed for a potential bullish push today. If momentum builds as expected, a test of the 3037–3043 resistance zone is highly probable.
On the downside, 2976 remains the key initial support , followed by 2952 , which was the previous local low.
On the fundamental side, no major data releases are scheduled today. However, updates related to tariff policies will likely be the main market driver, and could trigger intraday volatility.
🎯 【Trade Setup for Today】
🔻Sell Zone: 3047–3066
🔺Buy Zone: 2968–2942
🔄Flexible/Scalping Zone: 2978–3023
Finally a clear bigger viewthe pump happened in the last few days did wake something in me as i allways try to be aware of the "Dumps" before they can happen and the last pump was "too fast too far" must lead to something bigger and we are in a long long uptrend there must be something beneath it, when i recalculate trend lines matching waves i see we are in an extencion and almost at the end of it, there will be a lot of gain and bigger losts, this is why i am sharing this chart so you will have another point of view
XAUUSD Analysis todayHello traders, this is a complete multiple timeframe analysis of this pair. We see could find significant trading opportunities as per analysis upon price action confirmation we may take this trade. Smash the like button if you find value in this analysis and drop a comment if you have any questions or let me know which pair to cover in my next analysis.
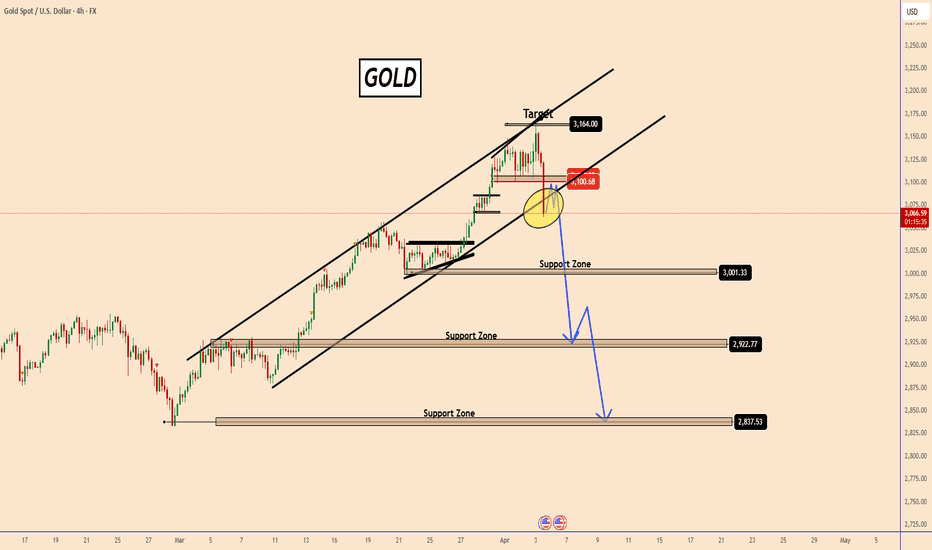
Gold's Downtrend PersistsGold's Bearish Outlook Continues Despite Temporary Upside Spike
Market Overview:
The overall outlook for gold remains bearish, even though the market recently experienced a surprising and sharp upward movement. While a deep correction was anticipated and in line with prior expectations, the nature and timing of the recent surge raised some eyebrows among analysts and traders alike.
The unexpected bullish reaction came shortly after former U.S. President Donald Trump announced a 90-day suspension on reciprocal tariffs—a development that typically would not warrant such a dramatic price rally in gold. Normally, easing geopolitical or economic tensions would dampen safe-haven demand, causing gold to retreat. In this case, however, the opposite occurred, which suggests the possibility of non-fundamental drivers at play, potentially even artificial market influence or manipulation.
Technical Outlook:
Despite the sudden upward movement, gold’s larger technical structure has not changed significantly. The overall trend remains bearish unless we see a sustained breakout above the 3167 resistance level. A clean breach above that threshold would be uncharacteristic based on current fundamentals and could indicate external interference or speculative overreaction rather than a genuine shift in sentiment or macroeconomic conditions.
The price action continues to favor the bears, with lower highs and lower lows still forming on the larger timeframes. Until there’s clear evidence to the contrary, any rallies should be viewed with skepticism and treated as potential selling opportunities rather than the start of a new bullish trend.
Key Support Zones:
Looking at potential areas where gold may find some temporary footing, the following support levels should be closely monitored:
3054 – Minor support; could serve as a short-term pause point.
3000 – A psychological level and round number that often acts as a magnet for price action.
2925 – More significant historical support zone with prior buying interest.
2840 – Deeper support, aligning with the longer-term bearish trajectory.
Conclusion:
In summary, while gold has shown a sudden upward burst, the broader picture remains cautious. The technical indicators, market context, and recent price behavior all point toward a continuation of the downtrend unless key resistance levels are convincingly breached. Traders are advised to remain vigilant, avoid emotional reactions to short-term volatility, and refer closely to technical signals when making decisions.
The chart provides further clarity on this setup—feel free to review it for a more visual representation of the analysis.
Thank you for reading, and best of luck in the markets!
Gold Hits 3220s ATH — Retracement ExpectedAfter the bullish surge to 3160s, Gold market swept more liquidity, printing a new all-time high at 3220s — an upthrust after distribution move. Now, the market eyes a retracement on the daily formation, with 3159 marked as a key mitigation level to stabilize for the next hedge.follow for more insights , comment , and boost idea
Gold Trade Plan 08/04/2025Dear Traders,
Gold still ( Correction phase) and i expect price will start correction after touch top of Descending channel ,
If you enjoyed this forecast, please show your support with a like and comment. Your feedback is what drives me to keep creating valuable content."
Regards,
Alireza!
GOLD BEARS WILL DOMINATE THE MARKET|SHORT
GOLD SIGNAL
Trade Direction: short
Entry Level: 3,224.05
Target Level: 3,072.86
Stop Loss: 3,325.09
RISK PROFILE
Risk level: medium
Suggested risk: 1%
Timeframe: 6h
Disclosure: I am part of Trade Nation's Influencer program and receive a monthly fee for using their TradingView charts in my analysis.
✅LIKE AND COMMENT MY IDEAS✅
XAUUSD: Buy or Sell ?Hello everyone, let’s take a look at OANDA:XAUUSD and plan the latest strategy for this afternoon!
Currently, this precious metal is trading around the 3039 USD level, recording a 1.94% gain on the day.
The main driver of the rally comes from the news that the United States will impose tariffs of up to 104% on imports from China starting Wednesday. This decision has sparked concerns about a potential global economic recession, thereby boosting demand for safe-haven assets like gold.
In addition, the market is expecting the Federal Reserve (Fed) to begin a rate-cutting cycle soon, with over a 60% chance of it happening as early as May, and a projected five more rate cuts in 2025. This expectation is weakening the USD, further supporting gold prices. Although some Fed officials continue to deliver hawkish signals, concerns that tariffs could increase inflation remain and are putting pressure on the Fed's upcoming policy decisions.
From a technical standpoint, an effort to shift the trend has formed above the resistance of the descending trend channel, and price is now reacting near the key resistance level at 3055. A breakout and price consolidation above 3055 will trigger the continuation of the current upward move. A retest of the previous broken consolidation resistance at 3020 may also occur.
The market structure is fully bullish. A breakout above key resistance or a pullback to support levels will likely lead to the next phase of growth, but if the 3055 level is broken earlier than expected, it could eventually push this metal up to 3110.
If you find this information useful, don’t forget to like and follow Gary to stay updated with the latest insights!
Potential Reversal in Gold After Completing Widening Formationhello guys!
The 4H Gold/USD chart exhibits a classic Broadening Formation (also known as a Megaphone Pattern), marked by higher highs and lower lows, reflecting increased volatility and market indecision. This pattern is identified with three key swing points on both the upper and lower trendlines:
Point 1 and Point 2 formed the initial boundaries of the pattern.
Point 3, recently touched, completes the structure by testing the upper boundary of the formation near $3,238, suggesting a potential bull trap, as illustrated in the schematic overlay.
just look at:
The price has sharply rallied to the top of the widening pattern, aligning with the third high, often a strong signal for reversal in this setup.
A rejection from this level is anticipated, supported by the bearish projection arrows targeting multiple demand zones.
Bearish Target Zones:
$3,180 – $3,160: Previous consolidation zone.
$3,140 – $3,120: Mid-pattern volume area with past price sensitivity.
$3,060 – $3,040: Major support zone with a strong volume node and previous reaction area.
Volume Profile Insight:
The volume profile shows significant activity in the $3,040 zone, reinforcing it as a major demand area where buyers might step in again.
__________________________
Summary:
This setup suggests a potential bearish correction after a strong upward move. If price action respects the pattern, traders may look for short opportunities from current levels with the outlined targets. Watch for confirmations such as reversal candlesticks or breakdowns of minor support levels.
DeGRAM | GOLD Growth in the Channel📊 Technical Analysis
- Uptrending channel
XAU/USD steadily climbs within a clear ascending channel, rebounding from support towards resistance.
- Key resistance
Main barrier at $3225; a breakout here confirms bullish momentum.
- Predictive scenario
Breaking $3225 opens doors for further upward movement.
💡 Fundamental Analysis
Trump's imposition of trade duties, has caused geopolitical instability, which has contributed to further demand for GOLD.
✨ Summary
Positive technical setup combined with supportive fundamentals. Break above $3225 signals continued bullish momentum!
-------------------
Share your opinion in the comments and support the idea with a like. Thanks for your support!
GOLD Trade Plan 14/04/2025Dear Traders,
Gold hit the resistance level of 3230 and I expect it to move back to the resistance area after a correction from the 3140-3160 areas.
If you enjoyed this forecast, please show your support with a like and comment. Your feedback is what drives me to keep creating valuable content."
Regards,
Alireza
Closing another re-Sell orderGold delivered aggressive upside sequence due Fundamentally Bullish bias where Price-action delivered almost #110-point upside extension. I have calculated that #3,082.80 - #3,092.80 should be local Top's for the sequence and engaged Selling order on #3,084.80 which hit my Stop-loss of #3,092.80 minutes after. However I have engaged another re-Sell order on #3,093.80 and closed my Selling order on #3,057.80 with excellent Profit.
My position: Gold is Trading below record High's values after #3,127.80 - #3,132.80 local High's rejected the Price-action. I see no alternative than waiting for CPI announcement and how Gold will digest it and will continue Trading in mentioned direction. I will continue Trading my setups one by one as my re-Sell and re-Buy levels appear.


