GOLD GOLD watch 3212 zone and the lower break of structure .the buy back is strong and selling is a mistake until price drop below 3000
XAUUSD.F trade ideas

Gold short from 3255Crazy how this thing is going .
Will short the top of that channel .
Lets wait first.

Gold (XAU/USD) Bounces Sharply After Retesting TrendlineGold surged +1.43% to close at $3,126.77, delivering a strong bullish engulfing candle after bouncing off both the trendline and 50-day SMA support zone near $2,960.
🔹 MACD is curling back higher, hinting at a bullish momentum reset
🔹 RSI sits at 63.40, supportive of continued upside without being overbought
🔹 Key higher low structure remains intact above the trendline
The rejection of lower prices and follow-through strength reinforce the bull trend. Unless the price breaks below $2,960, buyers remain firmly in control.
Momentum was tested—and it passed. The bull trend remains intact.
-MW

XAUUSD H4 | Bearish Drop Based on the H4 chart analysis, we can see that the price is testing our sell zone at 3113.30, which is a pullback resistance that aligns close to the 78.6% Fibonacci retracement.
Our take profit will be at 3056.01, a pullback support level.
The stop loss will be placed at 3169.78, which is a swing high resistance.
High Risk Investment Warning
Trading Forex/CFDs on margin carries a high level of risk and may not be suitable for all investors. Leverage can work against you.
Stratos Markets Limited (tradu.com):
CFDs are complex instruments and come with a high risk of losing money rapidly due to leverage. 63% of retail investor accounts lose money when trading CFDs with this provider. You should consider whether you understand how CFDs work and whether you can afford to take the high risk of losing your money.
Stratos Europe Ltd (tradu.com):
CFDs are complex instruments and come with a high risk of losing money rapidly due to leverage. 63% of retail investor accounts lose money when trading CFDs with this provider. You should consider whether you understand how CFDs work and whether you can afford to take the high risk of losing your money.
Stratos Global LLC (tradu.com):
Losses can exceed deposits.
Please be advised that the information presented on TradingView is provided to Tradu (‘Company’, ‘we’) by a third-party provider (‘TFA Global Pte Ltd’). Please be reminded that you are solely responsible for the trading decisions on your account. There is a very high degree of risk involved in trading. Any information and/or content is intended entirely for research, educational and informational purposes only and does not constitute investment or consultation advice or investment strategy. The information is not tailored to the investment needs of any specific person and therefore does not involve a consideration of any of the investment objectives, financial situation or needs of any viewer that may receive it. Kindly also note that past performance is not a reliable indicator of future results. Actual results may differ materially from those anticipated in forward-looking or past performance statements. We assume no liability as to the accuracy or completeness of any of the information and/or content provided herein and the Company cannot be held responsible for any omission, mistake nor for any loss or damage including without limitation to any loss of profit which may arise from reliance on any information supplied by TFA Global Pte Ltd.
The speaker(s) is neither an employee, agent nor representative of Tradu and is therefore acting independently. The opinions given are their own, constitute general market commentary, and do not constitute the opinion or advice of Tradu or any form of personal or investment advice. Tradu neither endorses nor guarantees offerings of third-party speakers, nor is Tradu responsible for the content, veracity or opinions of third-party speakers, presenters or participants.

Gold Wave 5 Bull Complete?! (4H UPDATE)Today & yesterday's price action is the slowest movements we've seen in the market in the past few weeks, which in my eyes is a positive sign. It means Gold has either or is close enough to topping in the next week or two, after which we should see a bearish market sentiment kick in.
POI 1: $3,147📉
POI 2: $3,060📉
Markets are hugely volatile, so we need to monitor minor areas for any potential reversals or continuation of trends.

Gold Shaking Hands with All-Time HighsSafe-haven assets caught a strong bid in recent trading, directing Spot Gold to all-time highs of US$3,220/troy ounce versus the US dollar (XAU/USD). The shift towards safe-haven markets was fuelled by softer demand for the USD as markets fled dollar assets, as well as escalating trade tensions between the US and China. Unsurprisingly, the Swiss franc (CHF) and Japanese yen (JPY) also attracted substantial bids, with the USD/CHF pair notching up losses of nearly 4.0% – its largest one-day drop since 2015!
Monthly Resistance and Oversold Conditions
Several desks are reportedly eyeing US$3,500 as the next upside objective for Gold; however, the monthly chart reveals it is considerably overbought according to the Relative Strength Index (RSI). You will note the RSI has remained within overbought territory since mid-2024 and recently touched gloves with familiar resistance between 87.31 and 82.20. This area boasts historical significance from as far back as 2006, and each time the Index has approached the resistance, a correction/pause typically followed in the yellow metal. Consequently, it raises the question about whether buying is set to moderate/pause at the monthly resistance area between US$3,264 and US$3,187 (made up of 1.618% and 1.272% Fibonacci projection ratios, respectively).
Daily Demand Zone; Dip-Buying?
Meanwhile, on the daily chart, price action came within a stone’s throw of testing support from US$2,942 at the beginning of the week before rallying to all-time highs noted above. What is interesting from a technical perspective is that the move left behind a demand area at US$3,000-US$3,058, which, in my opinion, represents a key technical zone.
With Gold firmly entrenched in a strong uptrend, dip-buyers could emerge from the daily demand area if a correction occurs. That said, given technical indicators on the monthly chart suggesting buyers could pump the brakes, any dip-buying activity would likely be approached with caution. Confirmation – such as a bullish candlestick signal or supporting price action on lower time frames – might be required before pulling the trigger. However, any movement below the mentioned demand area signals bearish strength from the monthly resistance zone, and potentially opens the door to short-term selling opportunities, targeting daily support at US$2,942, closely followed by support at US$2,865, and possibly US$2,790.
Written by FP Markets Chief Market Analyst Aaron Hill

XAU/USD "The Gold" Metal Market Heist Plan (Swing/Day Trade)🌟Hi! Hola! Ola! Bonjour! Hallo! Marhaba!🌟
Dear Money Makers & Robbers, 🤑💰✈️
Based on 🔥Thief Trading style technical and fundamental analysis🔥, here is our master plan to heist the XAU/USD "The Gold" Metal market. Please adhere to the strategy I've outlined in the chart, which emphasizes long entry and short entry. 🏆💸"Take profit and treat yourself, traders. You deserve it!"💪🏆🎉
Entry 📈 :
"The loot's within reach! Wait for the breakout, then grab your share - whether you're a Bullish thief or a Bearish bandit!"
🏁Buy entry above 3070
🏁Sell Entry below 2950
📌However, I recommended to place buy stop for bullish side and sell stop for bearish side.
Stop Loss 🛑: "🔊 Yo, listen up! 🗣️ If you're lookin' to get in on a buy (or) sell stop order, don't even think about settin' that stop loss till after the breakout 🚀. You feel me? Now, if you're smart, you'll place that stop loss where I told you to 📍, but if you're a rebel, you can put it wherever you like 🤪 - just don't say I didn't warn you ⚠️. You're playin' with fire 🔥, and it's your risk, not mine 👊."
🚩Thief SL placed at 2960 (swing Trade Basis) for Bullish Trade
🚩Thief SL placed at 3050 (swing Trade Basis) for Bearish Trade
Using the 4H period, the recent / swing low or high level.
SL is based on your risk of the trade, lot size and how many multiple orders you have to take.
Target 🎯:
🏴☠️Bullish Robbers : TP 3260 (or) Escape Before the Target
🏴☠️Bearish Robbers : TP 2800 (or) Escape Before the Target
⚒💰XAU/USD "The Gold" Metal Market Heist Plan is currently experiencing a neutral to bullish trend,., driven by several key factors.... 👇👇👇
📰🗞️Get & Read the Fundamental, Macro, COT Report, Geopolitical and News Analysis, Sentimental Outlook, Intermarket Analysis, Index-Specific Analysis, Positioning and future trend targets.. go ahead to check 👉👉👉🔗🔗
📌Keep in mind that these factors can change rapidly, and it's essential to stay up-to-date with market developments and adjust your analysis accordingly.
⚠️Trading Alert : News Releases and Position Management 📰 🗞️ 🚫🚏
As a reminder, news releases can have a significant impact on market prices and volatility. To minimize potential losses and protect your running positions,
we recommend the following:
Avoid taking new trades during news releases
Use trailing stop-loss orders to protect your running positions and lock in profits
💖Supporting our robbery plan 💥Hit the Boost Button💥 will enable us to effortlessly make and steal money 💰💵. Boost the strength of our robbery team. Every day in this market make money with ease by using the Thief Trading Style.🏆💪🤝❤️🎉🚀
I'll see you soon with another heist plan, so stay tuned 🤑🐱👤🤗🤩

XAUUSDHello Traders!
What are your thoughts on GOLD?
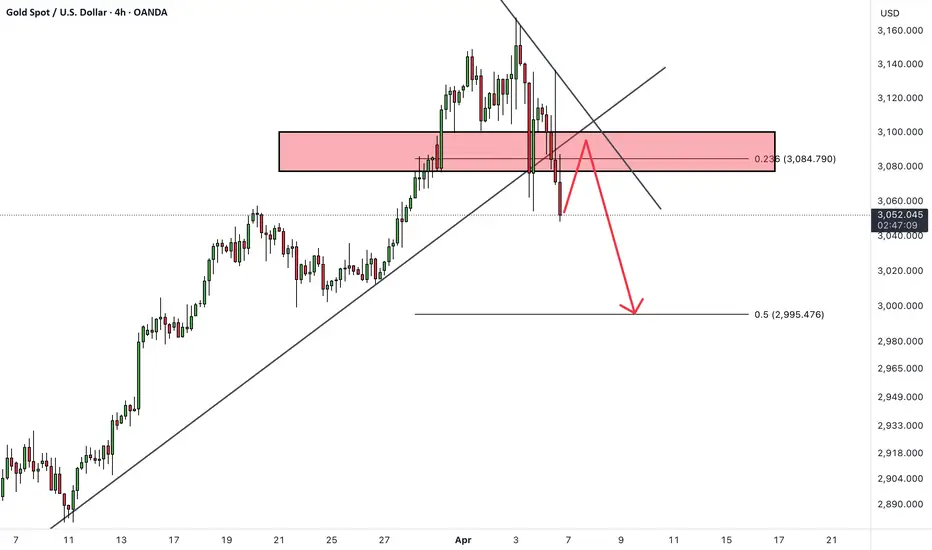
Gold has broken its ascending trendline and failed to hold above the 3100 level.
We now expect a pullback to the broken trendline, which may act as resistance.
After the pullback, we anticipate a decline toward the specified support level.
Will gold continue its decline or regain bullish momentum? Share your thoughts below!
Don’t forget to like and share your thoughts in the comments! ❤️
XAUUSD M15 I Bearish Reversal Based on the M15 chart, the price is approaching our sell entry level at 3013.90, a pullback resistance that aligns close to the 61.8% Fibo retracement.
Our take profit is set at 2978.66, an overlap support.
The stop loss is set at 3055.40, a swing high resistance.
High Risk Investment Warning
Trading Forex/CFDs on margin carries a high level of risk and may not be suitable for all investors. Leverage can work against you.
Stratos Markets Limited (fxcm.com/uk):
CFDs are complex instruments and come with a high risk of losing money rapidly due to leverage. 63% of retail investor accounts lose money when trading CFDs with this provider. You should consider whether you understand how CFDs work and whether you can afford to take the high risk of losing your money.
Stratos Europe Ltd (fxcm.com/eu):
CFDs are complex instruments and come with a high risk of losing money rapidly due to leverage. 63% of retail investor accounts lose money when trading CFDs with this provider. You should consider whether you understand how CFDs work and whether you can afford to take the high risk of losing your money.
Stratos Trading Pty. Limited (fxcm.com/au):
Trading FX/CFDs carries significant risks. FXCM AU (AFSL 309763), please read the Financial Services Guide, Product Disclosure Statement, Target Market Determination and Terms of Business at fxcm.com/au
Stratos Global LLC (fxcm.com/markets):
Losses can exceed deposits.
Please be advised that the information presented on TradingView is provided to FXCM (‘Company’, ‘we’) by a third-party provider (‘TFA Global Pte Ltd’). Please be reminded that you are solely responsible for the trading decisions on your account. There is a very high degree of risk involved in trading. Any information and/or content is intended entirely for research, educational and informational purposes only and does not constitute investment or consultation advice or investment strategy. The information is not tailored to the investment needs of any specific person and therefore does not involve a consideration of any of the investment objectives, financial situation or needs of any viewer that may receive it. Kindly also note that past performance is not a reliable indicator of future results. Actual results may differ materially from those anticipated in forward-looking or past performance statements. We assume no liability as to the accuracy or completeness of any of the information and/or content provided herein and the Company cannot be held responsible for any omission, mistake nor for any loss or damage including without limitation to any loss of profit which may arise from reliance on any information supplied by TFA Global Pte Ltd.
The speaker(s) is neither an employee, agent nor representative of FXCM and is therefore acting independently. The opinions given are their own, constitute general market commentary, and do not constitute the opinion or advice of FXCM or any form of personal or investment advice. FXCM neither endorses nor guarantees offerings of third-party speakers, nor is FXCM responsible for the content, veracity or opinions of third-party speakers, presenters or participants.

3rd Week on APRIL 2025Bullish is getting strong due to the global economic situation. In the third week, it will continue its bullish movement.
Last week I have loss at support, 2956 is the last strong support.
For me, 3300 is the next psychological price to be reached.
Good Luck !

Gold surged by $120 in a single day!Technically, after breaking through $3054 this week, the key resistance above moved up to the $3100 area. This position is the historical high and the dividing line between long and short positions. If it can stand firm, the gold price may further test the previous high and open up upward space. On the contrary, if the rebound encounters resistance and falls back, the 3050 line will become a short-term support belt, and breaking it may expand the adjustment range.
Gold recommendation: Go long when it falls back to around 3060-3065, stop loss 3053, target 3085

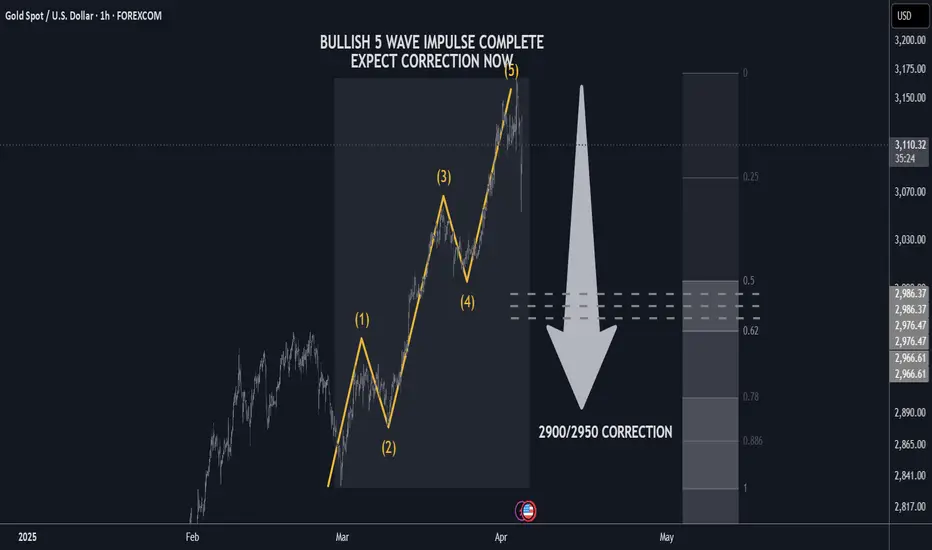
GOLD H1 Update: Expect correction 2900/2950 USD🏆 Gold Market Update (April 3rd, 2025)
📊 Technical Outlook Update
▪️5 wave impulse completed
▪️Expect correction now
▪️Tariffs already priced in
▪️Profit taking in progress now
▪️Price Target BEARS 2900/2950 USD
▪️Strategy: SHORT SELL rips/rallied
▪️target is 2900/2950 USD
📢 Gold Market Update – April 2025
📈 Gold Hits All-Time High!
🚀 Price spiked to $3,167.84/oz after Trump announced sweeping tariffs (10–34%) on global imports.
🌎 Investors rushed to safe-haven assets amid rising trade war fears.
📉 Volatility Followed
💸 Sharp pullback after the surge as markets reacted to global uncertainty.
🔁 Analysts expect more swings as tensions evolve.
🏦 Central Banks Buying More Gold
🛡️ A move to protect against currency risks & inflation fears.
THE KOG REPORT - NFP UpdateEnd of day update from us here at KOG:
An absolutely crazy day on the markets with Gold continuing the move it started and completing hopefully now at the extreme level we wanted on the KOG Report. Our indicators were screaming short, we obliged and then waited for the lower level to give us a 90pip bounce initially with the support still holding us up.
We now have support below at 3020-18 which if broken can take us down into 3010 for another potential RIP, otherwise, resistance here stands at the 3050-55 level which if targeted will need to break to go higher!
We're done for another successful week on the markets and will be back on Sunday for the KOG Report and our view for the week ahead.
Wishing you all a great weekend and as always, trade safe.
KOG's bias of the week:
Bullish above 3040 with targets above 3091✅, 3097✅, 3101✅ and above that 3110✅
Bearish on the break of 3040 with targets below 3035✅, 3027✅, 3020✅ and below that 3010
RED BOXES:
Break above 3095 for 3101✅, 3106✅, 3110✅ and 3120✅ in extension of the move
Break below 3077 for 3070✅, 3066✅ and 3055✅ in extension of the move
KOG

XAUUSD Channel Up holding but be ready to short if broken.Gold (XAUUSD) has been trading within a Channel Up on the 4H time-frame, hitting today its 4H MA200 (orange trend-line). That is the first time the price hits this trend-line since February 28 and the previous Higher Low of the pattern.
As long as it holds, expect a Bullish Leg similar to the previous one, to hit first the 0.786 Fibonacci retracement level at 3130 and then the 1.786 extension for a Higher High at 3280.
On the other hand, if we get a candle closing below the 4H MA200, we will be ready to take the loss and go short instead, targeting Support 1 (Feb 28 Low) at 2840, potentially also making contact with the 1D MA100 (red trend-line).
-------------------------------------------------------------------------------
** Please LIKE 👍, FOLLOW ✅, SHARE 🙌 and COMMENT ✍ if you enjoy this idea! Also share your ideas and charts in the comments section below! This is best way to keep it relevant, support us, keep the content here free and allow the idea to reach as many people as possible. **
-------------------------------------------------------------------------------
💸💸💸💸💸💸
👇 👇 👇 👇 👇 👇

Has Gold established a bottom?04-07 was the ideal timing for a low, which proved to be correct.
From a cyclical standpoint, we need to break and close above the cycle-derived resistance line before a move toward new highs can be expected.
Why do cycles work? Because they define the natural boundaries of price energy. Just like everything in the universe moves in cycles, so does price. Mapping these cycles reveals order where there once appeared to be chaos.
Keep in mind that the potential for a larger FALSE MOVE to the downside still exists.

RSI 101: Revealing the Special Characteristics of RSIWhy does RSI have support and resistance levels at 40 and 60?
Why does divergence happen between RSI and price?
What is RSI momentum?
All the characteristics of RSI (that I know) will be explained here.
Formula and Meaning
If you are using TradingView, you probably already know what RSI is and what "overbought" and "oversold" mean. So, I won’t repeat it here. Instead, I’ll dive deeper into the true nature of RSI, giving you a different perspective.
You can skip the mathematical formula of RSI, it’s already discussed everywhere online. Just remember this ratio table:
Here’s how I explain the table:
At RSI = 50, the average gain equals the average loss (I'll call this the buy/sell ratio). This is a balanced point. Buyers and sellers are equally strong.
At RSI ~ 60 (66.66), the buy/sell ratio = 2/1. Buyers are twice as strong as sellers.
At RSI ~ 40 (33.33), the buy/sell ratio = 1/2. Sellers are twice as strong as buyers.
At RSI = 80, the buy/sell ratio = 4/1. Buyers are four times stronger.
At RSI = 20, the buy/sell ratio = 1/4. Sellers are four times stronger.
The formula shows that when RSI reaches 80 or 20, the buyer or seller is extremely strong — about four times stronger — confirming a clear trend.
At these levels, some Trading strategies suggest placing a Sell or Buy based on the overbought/oversold idea.
But for me, that’s not the best way. The right approach is: when a trend is clearly formed, we should follow it.
I'll explain why right below.
Look at this chart showing RSI changes with the buy/sell ratio:
When RSI > 50:
When RSI < 50:
You can see that the higher RSI goes, the slower it climbs, but the high buy/sell ratio makes price move up faster.
Similarly, when RSI goes lower, it drops slower but price drops faster.
That’s why at overbought (RSI=80) or oversold (RSI=20) areas, you need to be careful. Even a small RSI moving can lead to big price changes, easily hitting your stop loss.
On the other hand, if you follow the trend and wait for RSI to pull back, you will trade safer and more profitably.
RSI Key Levels
Here are some special RSI levels I personally find useful when observing FX:XAUUSD :
(These levels are relative. They might vary with different timeframes or trading pairs. Check historical data to find the right ones for you. On bigger timeframes like M15 or above, the accuracy is better.)
RSI = 20
When RSI hits 20, sellers dominate. This confirms a trend reversal to bearish.
RSI = 80
When RSI hits 80, buyers dominate. This confirms a trend reversal to bullish.
RSI = 40
This is a sensitive level. Sellers start gaining the upper hand (sell/buy = 2/1).
If buyers lose 40, they lose their advantage.
So RSI >= 40 is "buyer territory". In an uptrend, RSI usually stays above 40.
RSI = 40 acts as support in an uptrend.
RSI = 60
Same idea. RSI <= 60 is "seller territory".
RSI = 60 acts as resistance in a downtrend.
40 and 60 are considered the key levels of RSI.
Now you guys know why RSI has support/resistance around 40/60!
RSI Range
As you know, RSI moves between 0 and 100.
Since RSI >= 40 is buyer territory, we can see the relationship between price and RSI:
When RSI stays above 40, price tends to move in an uptrend:
When RSI stays below 60, price tends to move in a downtrend:
When RSI stays between 40 and 60, buyers and sellers are balanced, and price moves sideways in a box:
When RSI is moving, It creates a RSI Range.
Whenever the trend switches between the three states — uptrend, sideways, and downtrend — a Range Shift is formed.
At first, RSI moves in 40-60 range, price moves sideways. A strong price move pushes RSI to 80. Later, RSI stays above 50, helping price grow strongly. When momentum fades, RSI returns to 40-60 and price moves sideways again.
Note:
RSI reflects Dow Theory by showing the stages of accumulation, growth, and distribution.
And as you see, when RSI touches key levels, the trend often pulls it back.
RSI Momentum
Price momentum means how fast price changes.RSI momentum represents the change in the strength between buying and selling forces.
When RSI > 50:
If price falls, RSI shows high momentum — RSI drops fast but price drops slowly.
If price rises, RSI shows low momentum — RSI rises slowly but price rises fast.
For example, at first RSI is above 50.
Price drops from (a) to (b) by 44 units, RSI drops from (Ra) to (Rb) by 25 units.
Later, RSI drops from (Rb) to (Rc) (also 25 units) but price drops from (b) to (c) by 73 units.
When RSI < 50:
If price falls, RSI has low momentum — RSI drops slowly but price falls fast.
If price rises, RSI has high momentum — RSI rises fast but price rises slowly.
RSI and Price Divergence
Divergence happens when price and RSI move in opposite directions:
Price goes up but RSI goes down, or vice versa.
Why does divergence happen?
In a strong downtrend, price forms a bottom at point (1), and RSI drops to level (r1).
When a price pullback happens, price pushes up to a peak at point (2), and RSI also bounces back to level (r2).
Because the downtrend is strong, after completing the pullback (1-2), price continues to make a lower bottom at point (3).
At this point, remember the behavior of RSI momentum when RSI is below 50:
It takes a large price drop (from 2 to 3) to cause a small RSI drop (from r2 to r3).
Meanwhile, even a small price increase (from 1 to 2) causes a large RSI rise (from r1 to r2).
Since the distance (1-2) is smaller than (2-3), but the RSI move (r1-r2) is bigger than (r2-r3), divergence is created.
Divergence shows that the current trend is very strong, not a complete signal of a trend reversal.
(I might share with you how to spot a complete RSI reversal signal in future posts.)
As shown in the example above, after forming bottom (5) and creating a bullish divergence between (3-5) and (r3-r5), price still kept dropping sharply while RSI kept rising.
In these areas, if you keep trying to catch a reversal just based on divergence, you will likely need to DCA or cut your losses many times.
That’s why the most important thing in trading is always to follow the trend.
RSI Exhaustion
RSI Exhaustion happens when RSI keeps getting rejected by a resistance or support zone and can’t break through.
After a strong downtrend, RSI recovers but stalls around the 5x zone.
It tries many times but fails, showing buying power is weakening.
Then the downtrend continues:
Exhaustion near high or low RSI levels creates stronger divergences than exhaustion in the middle range:
Double or triple tops/bottoms on RSI (M or W shapes) basically indicate RSI exhaustion.
RSI Can Identify Trend Strength
In an uptrend:
If RSI pulls back to a higher level before going up again, the trend is stronger.
The pullback should not fall too deep (below 40).
Example:
First rally: RSI drops to 60 before rising again → strong rally (273 units).
Second rally: RSI drops to 50 before rising again → weaker rally (94 units).
Same idea for a downtrend:
If RSI pullbacks to 50 then drops again, the downtrend is stronger than if it pullbacks to 60.
RSI Support and Resistance
Besides 40-60 acting as support/resistance, RSI also reacts to old tops and bottoms it created.
Why does this happen?
RSI is calculated from closing prices.
On a higher timeframe, the candle close price is a high/low or support/resistance price on lower timeframes.
When RSI moves in a trend on a higher timeframe, it maintains a buy/sell ratio, forcing lower timeframe RSI to oscillate within a range.
Example:
On H4, RSI stays above 40 → uptrend.
It makes H1 RSI move between 30-80.
Sharp RSI tops/bottoms react even stronger because they show strong buying/selling forces.
Summary
When looking at the price chart, we can see that price can rise or fall freely without any defined boundaries.
However, RSI operates differently: it always moves within a fixed range from 0 to 100.
During its movement, RSI forms specific patterns that reflect the behavior of price.
Because RSI has a clear boundary, identifying its characteristics and rules becomes easier compared to analyzing pure price action.
By studying RSI patterns, we can make better assumptions and predict future price trends with higher accuracy.
I have shared with you the core characteristics of RSI, summarized as follows:
Besides overbought (80) and oversold (20), RSI respects 40 and 60.
40 is support level in an uptrend. 60 is resistance level in a downtrend.
In an uptrend, RSI stays above 40.
In a downtrend, RSI stays below 60.
An RSI Range-Shift leads to a trend change.
RSI Divergence shows strong trends.
Double or triple tops/bottoms show RSI exhaustion → potential reversals.
The higher the RSI level, the slower it moves, but the faster the price rises.
The lower the RSI level, the slower it moves, but the faster the price falls.
A strong uptrend can be identified when RSI moves within a higher range or shows continuous bearish divergences.
A strong downtrend can be identified when RSI moves within a lower range or shows continuous bullish divergences.
RSI reacts to its old tops and bottoms.
Sharper RSI peaks show stronger selling.
Sharper RSI bottoms show stronger buying.
In the next parts, I’ll show you how to apply these RSI's Characteristics to trend analysis, multi-timeframe analysis, and trading strategies, that you might have never seen before.
I trade purely with RSI. Follow me for deep dives into RSI-based technical analysis and discussions!

Gold fluctuates and adjusts at a high level!Gold opened lower and bottomed out and rebounded without breaking the 3245 line. Today's trend tends to fall back and adjust. Intraday trading can be kept high and low! Today, we will focus on the previous high-altitude suppression. Below, we will focus on whether it can effectively stabilize at 3200-3190. If it stabilizes, we will continue to look at the integer 3300 mark for long positions. The overall bulls are still strong, but gold fluctuates greatly during the day. If the position ratio is not done well, both long and short positions are easily damaged. Therefore, in recent transactions, we mainly focus on the area and position control ratio, and strictly stop losses in the short term during the day. On the whole, today's short-term operation strategy for gold is mainly to do more on pullbacks and short on rebounds. The short-term focus on the upper resistance of 3240-3245 is 3240-3245, and the short-term focus on the lower support of 3210-3187 is 3210-3187.
Short order strategy: Short in batches near the rebound of 3240-3243, stop loss of 6 points, target near 3210-3200, break to see the 3190 line;
Long order strategy: Long in batches near the pullback of 3187-3190, stop loss of 6 points, target near 3215-3235, break to see the 3245 line;

XAUUSD Today's strategyYesterday, the market trend on the trading chart continued to decline. However, it did not set a new low compared to the previous low point. Instead, the lows gradually showed an upward trend. Today, the crucial price level of 3,025 US dollars requires our close attention. Once it is successfully broken through, the market will continue to make an upward assault on the range between 3,045 and 3,055 US dollars. Overall, the current market is mainly characterized by a washout and sideways movement, and it is still too early for the price to reach its peak. Given the continuous impact of the trade conflicts, this will serve as a powerful factor driving the price of gold to new heights rather than causing the price of gold to collapse.
In particular, we must keep a close eye on the breakthrough of the 3,025 US dollars level. After this price level is broken through, we should focus on the pullback and confirmation movement. If the pullback does not break below this level, we can set the area below 2,980 US dollars as the stop-loss line. Under this premise, we can consider entering the market to go long, with the target set at the range between 3,040 and 3,045 US dollars, so as to capture the profit opportunities brought about by the rebound.

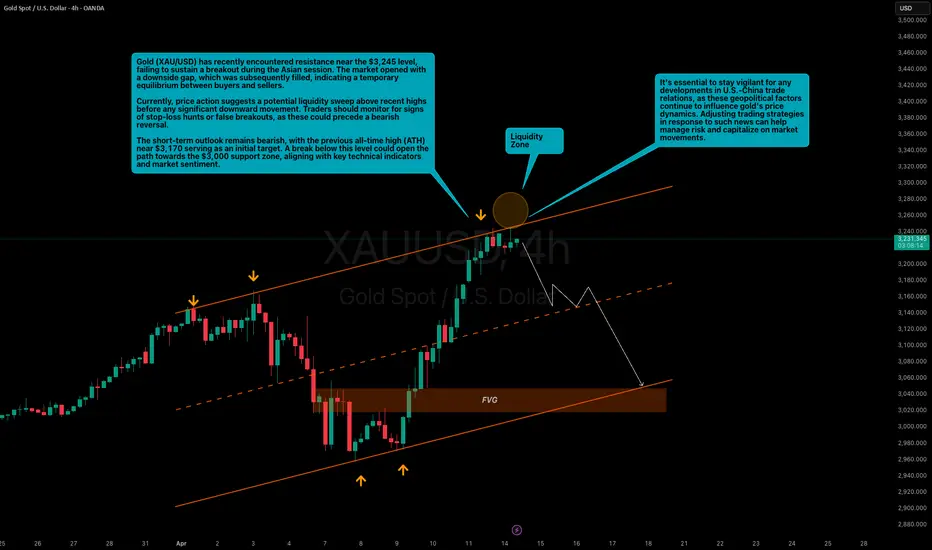
Resistance Holds at $3,245; Bearish Targets in FocusGold (XAU/USD) has recently encountered resistance near the $3,245 level, failing to sustain a breakout during the Asian session. The market opened with a downside gap, which was subsequently filled, indicating a temporary equilibrium between buyers and sellers.
Currently, price action suggests a potential liquidity sweep above recent highs before any significant downward movement. Traders should monitor for signs of stop-loss hunts or false breakouts, as these could precede a bearish reversal.
The short-term outlook remains bearish, with the previous all-time high (ATH) near $3,170 serving as an initial target. A break below this level could open the path towards the $3,000 FVG as well as support zone, aligning with key technical indicators and market sentiment.
It's essential to stay vigilant for any developments in U.S.-China trade relations, as these geopolitical factors continue to influence gold's price dynamics. Adjusting trading strategies in response to such news can help manage risk and capitalize on market movements.
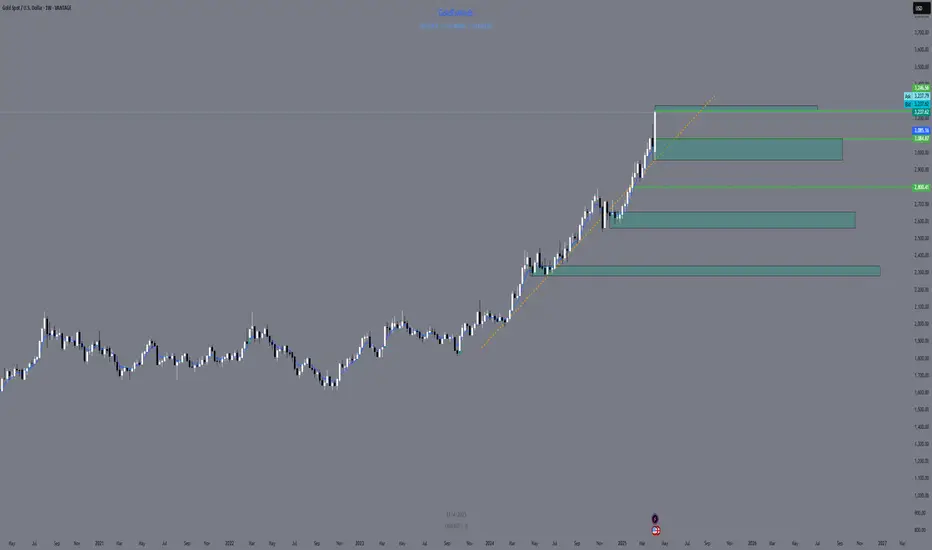
Weekly Outlook – XAUUSD Key Levels Map🟩 Weekly Outlook – XAUUSD Key Levels Map
📍 Premium Supply Zone:
‣ 3246 – 3275 → Price currently testing this premium area; potential reaction zone.
📍 Wick High / Liquidity:
‣ 3246.07 → Weekly wick = clear liquidity, useful for sweep/rejection monitoring.
📍 Weekly FVG (Fair Value Gap):
‣ 3085.16 → First key imbalance zone below current price, valid draw for bearish correction.
📍 Equilibrium Zone (Macro Weekly):
‣ ~2800 → Midpoint between recent major swing low and swing high = macro balance area.
📍 Origin of Macro CHoCH:
‣ 2372.54 → Anchored zone for deeper corrections; institutional footprint from structural shift.
Gold's Next Move?This analysis examines Gold’s current price action in the context of cyclical projections. As price appears poised to close above a key resistance level, two scenarios come into focus: a continued rally toward the weekly cyclical target, or a short-term pullback to retest the resistance level as support. A successful retest followed by new highs would likely confirm a bullish continuation near term.

GOLD short-term analysis and buying planThe key guidance for gold's trend this week is undoubtedly focused on every subtle change in the tariff news.
In this market, the influence of a tariff news is so great that all previous technical-based analysis and forecasts are instantly invalid. Looking back at the recent market, we can clearly see that in just three days, the price of gold first fell sharply by $211, and then rebounded rapidly, soaring by $275 in three days. Such drastic and frequent price fluctuations are almost entirely driven by various news, which once again highlights the decisive role of news in the current gold market.
From a purely technical analysis perspective, the strong performance of the weekly surge clearly shows that the current market structure is controlled by the bulls. It is worth noting that in the past month or so, the Asian market has formed a unique opening must rise rule. In-depth details of the market, we can find that the low point of gold in the US market, 3220-3215, has become a key watershed between the strength of longs and shorts. When the price runs above this area, the market shows obvious strong characteristics; once the price falls below this area, the market is very likely to turn to a weak pattern.
Similarly, the Asian session retracement low point of 3185-3190 area also constitutes an important dividing line between long and short positions. If the price remains above this area, the bulls will dominate; if it unfortunately falls below, the market is likely to quickly switch to the short mode, and even trigger a rapid plunge. For the upper long target, there is still great uncertainty. Investors can focus on the new high breakthrough in the 3245-3250 area, followed by the 3265-3260 area and the psychologically important $3,300 mark.
As the tariff war continues to deepen, the market generally expects that in the next 1-2 weeks, the gold market will usher in more crazy fluctuations, and its rise and fall is expected to set a new record. We need to be vigilant at all times and respond cautiously to market changes.
Key points:
First support: 3210, second support: 3202, third support: 3192
First resistance: 3246, second resistance: 3263, third resistance: 3300
Operation ideas:
Short-term gold 3206-3209 long, stop loss 3198, target 3240-3250;
Short-term gold 3260-3263 short, stop loss 3272, target 3220-3210;

Has the gold tariff peaked?The 4H cycle failed to open upward. According to the general rule, there is a certain probability of a downward kill. The watershed below is still 3100. Only if it falls below this position can it gradually turn to short. At the same time, the current volatility is very large, and any fluctuation starts at ten points. It is recommended to reduce the position to trade; the current long structure of gold has not changed. The key support watershed below is still 3100. Above 3100, the strong bullish idea remains unchanged. Short-term operations rely on 3100 for defense, and enter the market near 3116 to gradually look up. Focus on the strength of the European session. If the European session rebounds and does not break the high, then short the US session at highs, and pay attention to the resistance of the 3148-50 area above.
Today's gold short-term operation ideas suggest that rebounding should be the main focus, and callbacks should be supplemented by longs. The upper short-term focus is on the first-line resistance of 3148-3150, and the lower short-term focus is on the 3100-3110 first-line support.
Short order strategy
Strategy 1: Short 20% of the gold position in batches when it rebounds to around 3148-3150, stop loss 6 points, target around 3135-3125, and look at 3115 if it breaks;
Long order strategy
Strategy 2: Long 20% of the gold position in batches when it pulls back to around 3115-3118, stop loss 6 points, target around 3130-3140, and look at 3150 if it breaks;
