XAUUSD.F trade ideas

Gold --> Consolidation before the news. Increase trendOANDA:XAUUSD entering a strong growth phase after a false breakout from support as part of the correction process. The previous high at 3127 is now acting as a robust support for buyers. Strong news is about to be released...
Fundamentally, the market is shifting towards defensive assets amid speculation from the WSJ that Trump is considering imposing global tariffs of up to 20% on most of the United States' trading partners while rejecting plans to scale back tariffs. This could create inflationary pressure and stagnation, weakening the dollar and bond yields, thus supporting gold prices.
Central banks and investors continue to build positions in gold, but there may be some adjustments before the announcement of tariffs and the release of U.S. economic data. Theoretically, any reaction to U.S. data is likely to be short-lived, as the main event risk on the so-called 'Liberation Day' is Trump's major tariff revelation.
The strong resistance level is at 3135. A breakout and consolidation above this level would foster continued growth. However, given the upcoming news, gold may test the area of interest and liquidity between 3025-3020 before further advancing.

XAUUSD (Gold) Bullish Outlook – Targeting 3157 & Beyond
Gold (XAUUSD) is displaying strong bullish momentum today, with price action indicating a potential rally toward the 3157 level. The metal has established a key demand zone between 3115 - 3125, from where buyers are likely to step in.
🔹 Trading Plan & Key Levels:
✅ Entry Zone: 3115 – 3125 📍
✅ Bullish Targets: 3157 ➝ 3170 🎯
✅ Invalidation: Below 3110 ❌
🔹 Technical Analysis
📊 Market Structure: Higher highs & higher lows confirm bullish continuation.
📈 Support & Demand Zones: Strong buying interest at 3115 - 3125.
📉 Indicators: EMA crossover supports bullish bias; RSI > 60 confirms buying pressure.
🔵 Liquidity & Order Blocks: Price might grab liquidity before pushing higher.
🚀 Bullish bias remains intact as long as price holds above 3115, with an upside target of 3157 – 3170. A breakout beyond 3170 could trigger further gains. Stay disciplined & follow risk management! 🏆

Where will gold go after the sharp drop?The gold daily line decline structure continues to fluctuate downward, the moving average opens downward, and the RSI indicator runs below the central axis. The rise is not continuous, and the tariff policy still has an impact on the market. Yesterday, the market reported a 90-day tariff suspension. It can be seen that US stocks, crude oil, gold and silver are all rising rapidly, and then it is confirmed to be false news, and then they fall back quickly. It can be seen that as long as the impact of the tariff news does not change, all assets will continue to sell.
At present, the market is in a two-way power game between the selling of risky assets and the rising demand for risk aversion. Although gold is a safe-haven asset, it is also facing the pressure of liquidity withdrawal. In the context of the unclear Fed policy and the continued escalation of global trade concerns, the gold price may continue to maintain a volatile pattern, and the main idea is to sell at a high level!
However, the current fluctuation is too fast and the amplitude is too large, so short-term operations may not be easy to start, but the direction is still the most important, and the entry point is secondary, which means that gold will continue to fall sharply. Gold hit 2956 and then bottomed out and rebounded, but the recent market is actually volatile. Because the fluctuation is relatively large, it is reasonable to have a larger amplitude, but it increases the difficulty of operation. Gold fell back after rising again, and now it is in a large range of fluctuations, but overall, shorts are still dominant.
Yesterday's Asian session had a new low, and NY time had another new low. In such a market environment, new lows continue to appear, which is a short market. When the 3000 point fell below, many investors' faith collapsed, and they firmly believed that they could hold the 3000 mark and break it at this moment, which means that the current downward trend has not ended yet, and they continue to sell with the trend.
The gold 1-hour moving average continues to cross downward, and the downward momentum has not weakened; the rebound continues to sell. Although gold rushed up after filling the gap in 1 hour, it fell down quickly. Overall, it is still weak, and the short-term resistance is around 3030!
Today's rebound is under pressure near 3030, but you can still continue to sell. The market is changing rapidly. Although gold seems to rebound strongly, it eventually rises and is blocked and then falls. Gold is still the home of short sellers, but now it is more volatile. Be patient and wait for a rebound. You can sell near the resistance level. Pay attention to patiently wait for the rebound and sell near the resistance level.
Key points:
First support: 2978, second support: 2963, third support: 2955
First resistance: 3000, second resistance: 3013, third resistance: 3030
Operation ideas
Buy: 2975-2978, SL: 2966, TP: 3000-3010
Sell: 3030-3033, SL: 3042, TP: 3010-3000;

XAU/USD Trend Today - Wide and Unpredictable Trading Range🔔🔔🔔 Gold news:
➡️ The price of gold (XAU/USD) continues its decline after reaching an all-time high on Thursday, though it remains above the $3,100 level in early European trading. Optimistic traders are taking profits and scaling back their positions amid mildly overbought conditions. However, persistent concerns over potential economic harm from President Donald Trump's reciprocal tariffs are expected to support the safe-haven appeal of the precious metal.
Personal opinion:
➡️ The effects of the gold price increase are too much. Therefore, the current decline in the gold price to the 3125 area compared to the peak of 3167 is just profit-taking by buyers. Consider strong technical resistance - support zones to get the best profit for you
➡️ Analyze based on resistance - support levels and Pivot points combined with EMA to come up with a suitable strategy
Resistance zone: 3137 - 3150 - 3165
Support zone: 3113 - 3100 - 3184
Plan:
🔆Price Zone Setup:
👉Sell Gold 3150 - 3148 (Scalping)
❌SL: 354 | ✅TP: 3145 - 3142 - 3139
👉Sell Gold 3165- 3167
❌SL: 3172| ✅TP: 3160 – 3155 – 3150
👉Buy Gold 3086- 3084
❌SL: 3079| ✅TP: 3090 – 3095 – 3110
👉Buy Gold 3100- 3102 ( Scalping)
❌SL: 3095 | ✅TP: 3106 – 3112 – 3120
FM wishes you a successful trading day 💰💰💰

"Swinging up and down 100 points"The trend of gold's continued rise after breaking through $3,100 indicates that its path of least resistance is still upward. After losing below, it may return to the round mark of $3,100. If it effectively falls below this level, it may trigger a long-covering market, which will push the gold price to test the support of $3,076 near Monday's low. In the short term, pay attention to the new high of $3,148-50.
Today's operation ideas for gold;
1; The upper short position can be tried at 3125-30, with a small stop loss, the target is more than 15 points, if the loss is swept without replenishment, no more entry,
2; The lower long position can be tried at 3080, look at 10-15 points, long positions must have a stop loss. If you don't want to take losses, don't participate in long positions.

GOLD - New All-Time High Again? Where Will This End? Current Price Action:
Gold (XAUUSD) has reached another record high at 3,175.06 on the 4-hour chart, showing strong bullish momentum. The price is currently hovering around 3,127.07 after a minor pullback from the peak.
Key Levels:
Resistance: The all-time high at 3,175.06 is now the key level to watch. A break above could signal continuation of the rally.
Support: Immediate support sits at 3,127.20, with 3,150.00 acting as additional support. A drop below 3,127 could indicate a deeper correction.
Market Context:
The repeated tests of new highs suggest strong buying pressure, though the recent pullback shows some profit-taking. The 3,150 level has flipped from resistance to support, which is a bullish sign.
Trading Considerations:
- Long positions may consider entries near 3,127-3,150 with stops below 3,120, targeting 3,175 and beyond
- Short-term traders might watch for rejection at 3,175 for potential reversal plays
- The overall trend remains strongly bullish, but extended moves often see sharp corrections
Volume and Momentum:
The current pullback appears on relatively low volume, suggesting this may be a temporary pause rather than a trend reversal.
Final Thoughts:
Gold continues its historic rally with no clear resistance in sight. While the trend favors buyers, traders should remain cautious of potential profit-taking at these elevated levels.
Disclaimer: This analysis is for informational purposes only and not investment advice. Always conduct your own research before trading.

Is Gold about to enter resistance? !XAU/USD is rising towards the resistance level which is an overlap resistance that lie sup with the 50% Fibonacci retracement and could reverse from this level to our take profit.
Entry: 3,124.63
Why we like it:
There is an overlap resistance level that lines up with the 50% Fibonacci retracement.
Stop loss: 3,146.29
Why we like it:
There is a pullback resistance level.
Take profit: 3,097.69
Why we like it:
There is a pullback support level that lines up with the 38.2% Fibonacci retracement.

#xauusd #GoldLevels where price reactions are most likely to occur during the day. Naturally, at each level, you can have buy and sell positions.the levels are updated daily!
The results of price reaction to these levels will be shown in the upcoming videos.

XAUUSD H12 IdeaGold Rally Pauses, But Bullish Trend Holds
Gold hit an all-time high of $3,167.84 earlier this week amid safe-haven buying sparked by President Trump’s new tariffs and China's retaliatory duties, which intensified global recession fears. The resulting forced selling in equities caused a brief pullback in gold prices. However, this dip is seen as mechanical, not sentiment-driven, with gold still up over 15% this year, supported by central bank buying, strong institutional interest, and ETF inflows. The pullback is likely temporary unless new macroeconomic shifts emerge.
Ongoing Risks Support Gold’s Long-Term Bullish Outlook
Despite recent market volatility, the drivers behind gold’s rally remain intact. Mohamed El-Erian raised U.S. recession odds to 50%, while Goldman Sachs raised theirs to 35%. The Fed has warned of slower growth and higher inflation due to tariffs, and gold's role as a hedge against these risks is vital.
Focus on Upcoming Data
Next week, key data will be in focus: the FOMC minutes on Wednesday, CPI report on Thursday, and consumer sentiment data on Friday. If CPI surprises to the upside or the FOMC minutes reveal a more dovish stance, gold could see renewed buying interest. Traders should view pullbacks as buying opportunities, as inflation, trade tensions, and recession risks continue to support gold.
Technical Outlook
If gold tests support at $3,000.28 and holds, it may attract new buyers. A break below could bring the $2,852.34 level into play. Shorting is risky, but if pursued, exit over $3,167.84 with objectives at $3,000.28, $2,852.34, and the 52-week moving average at $2,601.40.

A Calm Mind Sees Better – Gold OutlookPrice reacted strongly from the highs, showing signs of a shift in momentum. Watching the green zone closely—it’s an area of interest where the market might reveal its next intention.
As long as the higher structure holds, there’s still room for continuation. No need to rush—sometimes, the best trades are the ones that come to you.
Plan with patience. Let price lead.
#XAUUSD #Gold #SmartMoney #PriceAction #SupplyDemand #ForexForecast #MarketStructure

XAUUSDoverall , XAUUSD is bullish , i am eyeing on the 2 levels to see if there is any good reaction to buy from ( orange zones)

GoldXAUUSD
- Bearish Channel in Short Time Frame
- Break of Structure
- RSI - Divergence
- Change of Characteristics
- Completed " 12345 " Impulsive Waves and " A " Corrective Wave
KEEP TRADING SIMPLE - GOLDGood Morning,
Gold is not looking so hot right now - We are seeing some rejection in the market and it looks like lower lows are on the horizon. I do not personally expect the current support to hold. If it does not we are looking at a short term correction and trend change.
If it bounces off the current resistance that will be the sign of confirmation.
Thanks

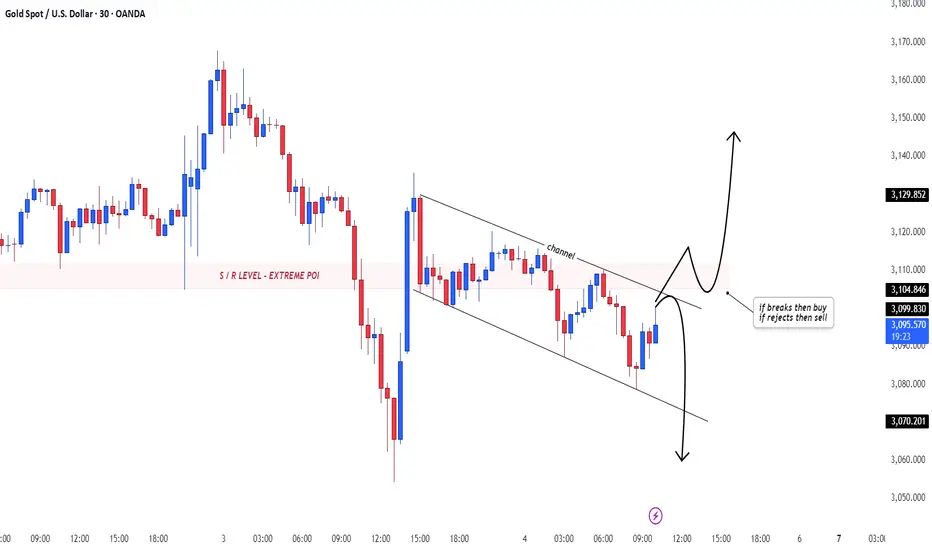
Gold (XAU/USD) Technical Analysis: Key Resistance Test Before BrThis chart represents a Gold (XAU/USD) 30-minute timeframe analysis from TradingView. Here are the key takeaways:
Technical Indicators & Levels
Exponential Moving Averages (EMAs)
200 EMA (Blue Line): 3,110.97 – A long-term trend indicator.
30 EMA (Red Line): 3,134.65 – A short-term trend indicator.
Key Levels
Resistance Point: Around 3,136.56.
Support Zone (Stop Loss Level): 3,103.16.
Target Point: 3,167.44, indicating a potential 1.62% upside.
Potential Trade Setup
Scenario 1 (Bullish Case):
If price breaks above resistance (3,136.56) and holds, the next target is 3,167.44.
A bullish breakout could indicate further momentum.
Scenario 2 (Bearish Case):
If price fails to break resistance and drops, it could test the support zone around 3,103.16.
A break below this level might lead to further downside.
Pattern Analysis:
The chart suggests a potential retest of resistance before a breakout.
A possible accumulation phase before a strong move.
Conclusion
Bullish above 3,136.56, targeting 3,167.44.
Bearish below 3,103.16, watching for downside risk.
The 200 EMA (3,110.97) could act as dynamic support.

The long-short game of gold at high levels is intensifyingAfter continuing to rise, gold fell from its highs during yesterday's US trading session to test the 3100 integer support, and then stabilized and rebounded. After today's shock repair, the gold price finally stood above 3100, showing an overall strong trend. However, from the technical structure, the upward trend line at the hourly level has been broken, and the price has turned to horizontal horizontal operation, entering a high-level wide-range shock adjustment stage.
At present, gold is in a typical long-short stalemate, and the key resistance above is in the 3134-3127 area, which is both the previous high and an important top-bottom conversion pressure zone. If this resistance area can be effectively broken, the gold price is expected to further test the 3150 mark. The primary support below is the 3105-3113 range. The gains and losses in this area will determine the short-term long-short trend. If this support is lost, it may trigger a deeper correction, testing key support levels such as 3085 and 3070-3065 in turn.
Although gold has shown initial signs of stagflation, it is recommended to still take the low-long strategy as the main idea and the high-short strategy as the auxiliary before the short trend is clearly formed. In terms of specific operations, short orders can be arranged in the 3134-3140 area, with the stop loss set above 3150, the target is 3115, and further down to the 3100 mark; at the same time, long orders can be tried in the 3100-3105 area, with the stop loss set below 3090, and the targets are 3130 and 3150 respectively.
The current market is at a critical turning point. Investors need to pay close attention to the breakthrough direction of the wide range of 3100-3150, and pay attention to controlling positions, strictly stop losses, and guard against sudden volatility risks. Before the trend becomes clear, it is recommended to maintain flexible operations and avoid excessive pursuit of gains and losses.
Continue to short gold after the rebound!Although gold did not fall due to the negative impact of ADP data, this does not mean that the risk of gold falling has been eliminated. As long as gold does not break through the recent highs, and in the fluctuations in recent days, the resistance strength of the 3135-3145 zone has been strengthened, gold still has a considerable risk of falling before breaking through the resistance area, and once gold falls below the 3110-3100 zone, it is bound to retreat to the 3095-3085 zone!
The trading strategy verification accuracy rate is more than 90%; one step ahead, exclusive access to trading strategies and real-time trading settings

Gold Intraday Trading Plan 4/9/2025Yesterday good retraced further to 3020 and dropped from there. I am seeing further downside momentum but also reversal possibility. If we have a 4hrly bullish bar, we may see short term bulls picking up.
Therefore, I am monitoring closely on these two levels 3000 and 2960. Will act accordingly on price actions there.

xauusd analysisGold prices experienced a sharp decline today, dropping to a three-and-a-half-week low. The move was driven by a combination of global macroeconomic concerns, investor behavior, and technical market dynamics.
🔍 Key Reasons Behind the Drop:
Global Trade Tensions Intensify
A major escalation in the U.S.-China trade war rattled markets. The U.S. announced new tariffs, and China retaliated with export restrictions on rare earth elements. This sparked broad risk-off sentiment across global markets.
Panic-Led Liquidation
Despite being a traditional safe haven, gold was sold off as investors rushed to cover losses in other risk assets. This often happens during periods of extreme volatility when liquidity becomes a priority.
Hawkish Fed Comments
Fed Chair Jerome Powell made comments suggesting the central bank might delay rate cuts due to persistent inflation and trade uncertainties. This caused the U.S. dollar to strengthen, which typically puts pressure on gold prices.
📈 Technical Analysis:
Current Price: Around $2,962
Support Levels:
First support around $2,950
Stronger support near $2,930
Resistance Levels:
Immediate resistance at $2,970 (Target 1 in your chart)
Further resistance near $3,000 (Target 2)
Trend & Indicators:
RSI is approaching oversold, indicating a potential bounce.
The short-term trend remains bearish, with a series of lower highs and lower lows.
Volume spiked during the sell-off, showing strong momentum behind the move.
🧠 What to Watch Going Forward:
Any new trade developments between major economies.
Fed’s stance on inflation and interest rates.
Gold’s behavior around key support zones – bounce or breakdown?

Gold is still weak, rebound can still be shortedThe 1-hour moving average of gold still continues to cross downwards, and the strength of gold shorts has not weakened; gold rebounds are still mainly short selling. Although gold rose after covering the gap for one hour, the upper shadow line soon fell. Gold is still weak overall, and gold is under pressure near 3050 in the short term.
Trading idea: short gold near 3042, stop loss 3052, target 3022
The above is purely a sharing of personal opinions and does not constitute trading advice. Investments are risky and you are responsible for your profits and losses.

Gold Price at a Crossroads: Awaiting the Next MoveCurrently, I foresee two possible scenarios for XAUUSD. In the more optimistic scenario (black label), the recent correction is assumed to be wave ii of wave (v), which suggests that XAUUSD still has the potential to strengthen toward the 3,177–3,306.
However, attention should also be given to the bearish scenario (red label). If XAUUSD fails to break above the 3,167 resistance level, it is likely that wave 3 has already been completed, and the current movement is part of wave 4. In this case, XAUUSD may decline toward the 2,489–2,832.

will gold push higher , given the state of US economyyesterday NY session we did see gold bounce of a major 4 hour support area, & buyers coming into the market
with the current situation in the US market & with the DXY pushing down, there is a good chance that gold will be pushing higher.
opportunities on gold happen london & the crossover with the new york session, be mindful of
NFP & the fed announcement also at 4 pm.
i will be looking for buys around the 3.08.00 area, which lines up perfectly with the 0.71 fibbonacci level. extra comformations/ i would want to see a bullish engulfing or another candle formation that is showing bullish price action around this area, before i enter the trade.
we may get an early entry london open, or around NFP news release at 1.30 pm
please feel free to comment & send me your own mark up, ideas.

XAUUSD ShortXAUUSD short again. With the previous drop and increase, I guess it's still safe to hold on to sell positions. Setting my position at 3138 // TP 3000 SL 3238. Let's see how this trade rolls :)
Day 16of100
L:5
W:2
