XAUUSD – Buy Setup from Strong Support ZoneGold is reacting from a strong support zone around . Price formed a bullish candle and showed rejection from this area, which has acted as demand before.
Entry: Above
Stop Loss: Below
Take Profit: and based on previous resistance levels
Reason for Entry:
Support zone holding
Bullish price action
RSI near oversold
Trend still bullish overall
Note:
This is a low-risk, high-reward setup. Always use proper risk management and avoid over-leveraging. I personally use small lot sizes for safety.
XAUUSD.F trade ideas

Gold Market Breaks Bearish Trend After2970"s Imbalance Sweep Gold market breaks its previous trend following the mitigation of imbalance at the 2970s. This shift signals a potential weekly formation pullback as the market realigns with broader sentiment. Eyes now on confirmation of further correction or a possible bullish resurgence.follow for more insights , comment and boost idea

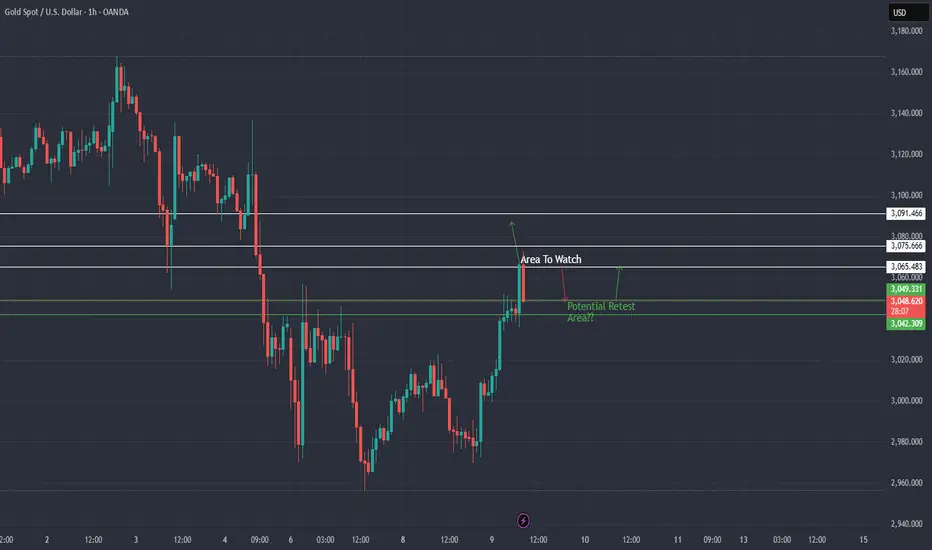
XAU / USD 1 Hour ChartHello traders. As per my last analysis, gold pushed down to my potential retest area.. I am watching the lower time frames but I am cautious as we have the NY open in an hour. If we break and close below $3042 then I would find this idea invalid. Need the current 1hour candle's bottom to hold. Could be a nice scalp up. Let's see how it plays out. Be well and trade the trend. Shout out to Big G.
GOLD: Short Signal with Entry/SL/TP
GOLD
- Classic bearish pattern
- Our team expects retracement
SUGGESTED TRADE:
Swing Trade
Sell GOLD
Entry - 3044.0
Stop - 3051.7
Take - 3027.6
Our Risk - 1%
Start protection of your profits from lower levels
Disclosure: I am part of Trade Nation's Influencer program and receive a monthly fee for using their TradingView charts in my analysis.
❤️ Please, support our work with like & comment! ❤️

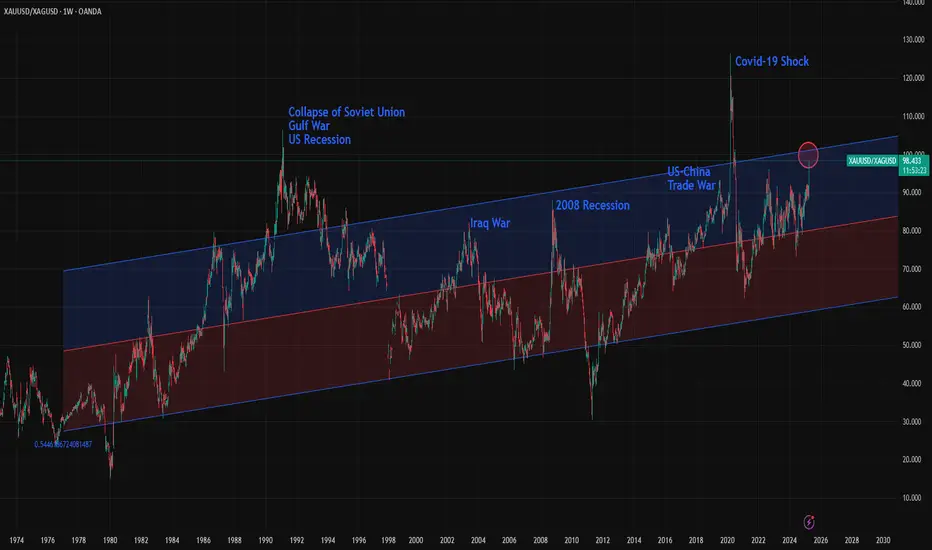
Gold/Silver Ratio Nears 100: What Does It Mean Historically?The Gold/Silver ratio is on the verge of reaching 100, an extremely rare level seen only at key historical turning points. The chart includes a 2,500-week linear regression channel, which shows that over the very long term, the ratio has been steadily rising, though at a slow pace. Occasionally, the ratio touches the 1.5 standard deviation line, and in rare, game-changing events, and sometimes it even breaks beyond that level.
Here are some of the key historical turning points marked by major spikes in the Gold/Silver ratio:
1- Early 1990s: The collapse of the Soviet Union, the Gulf War, and a U.S. recession pushed the ratio to 106. It remained above 1.5 standard deviations for more than two years.
2- 2002: Following the dot-com bubble burst, the 9/11 attacks, and the Iraq War, the ratio climbed to 82.6, nearing the 1.5 deviation line.
3- 2008 Recession: The global financial crisis triggered by the collapse of Lehman Brothers sent the ratio to 88.50. This spike sparked a major rally in both gold and silver, lasting until 2011 when the ratio reached one of its deepest bottoms.
4- 2019: The U.S.–China trade war under Trump’s first term pushed the ratio to 93, again nearing the 1.5 deviation threshold.
5- 2020 (COVID-19 Shock): The pandemic caused one of the biggest disruptions in modern economic history. Although relatively short-lived, its impacts were severe. The Gold/Silver ratio surged to 126 , marking the highest level in modern records, possibly the highest in all of history.
6- 2024–2025 (Global Trade War?): With the U.S. imposing major tariffs on key global trading partners, this could be another historic inflection point. The full impact is still unfolding, but risks of a serious global slowdown, or even a deep recession are rising. A full-scale trade war remains a real possibility.
Now, the Gold/Silver ratio is approaching 100 and nearing the 1.5 standard deviation line. It remains unclear whether this represents a powerful pair trade opportunity—"sell gold, buy silver"—or a structural breakout where the ratio stays elevated for an extended period. In either case market is showing that this is one of the rare turning point of global economy.
XAUUSD/GOLD Possible Move 09.04.2025📊 Market Context
After a sharp selloff from the $3,160 region to sub-$2,980 levels, the market is now in recovery/consolidation mode.
Market currently hovers around $3,010 after bouncing from below $2,980, indicating buyer interest.
📏 Fibonacci + Support Confluence Zones
Price may pull back and give a buy-the-dip opportunity.
✅ Buy Zone 1 – $2,993–2,997
Reason: Retest of strong horizontal support, Fibonacci .5% area.
Signal to Enter Long: Bullish engulfing / hammer on M5/M15 + RSI divergence.
Target: $3,010 (first), $3,020+ (extended).
🔁 Retest Logic
Wait for price to retest any of these zones on low volume → watch for bullish candle close.
⚠️ Important Notes
Avoid entering mid-range trades at $3,010–$3,015 without pullback confirmation.
Aggressive buys can be scalped on momentum breakouts of $3,020 only if volume supports.
Always monitor for news or sudden volume spikes which can invalidate pullback zones.
Follow, comment, like and join for more like analysis.

Bearish continuation after the retracement!XAUUSD(Gold) dropped as anticipated. We are now waiting to re-enter the market at the proper retracement level shown on the chart. Remember to be patient and control your emotions.

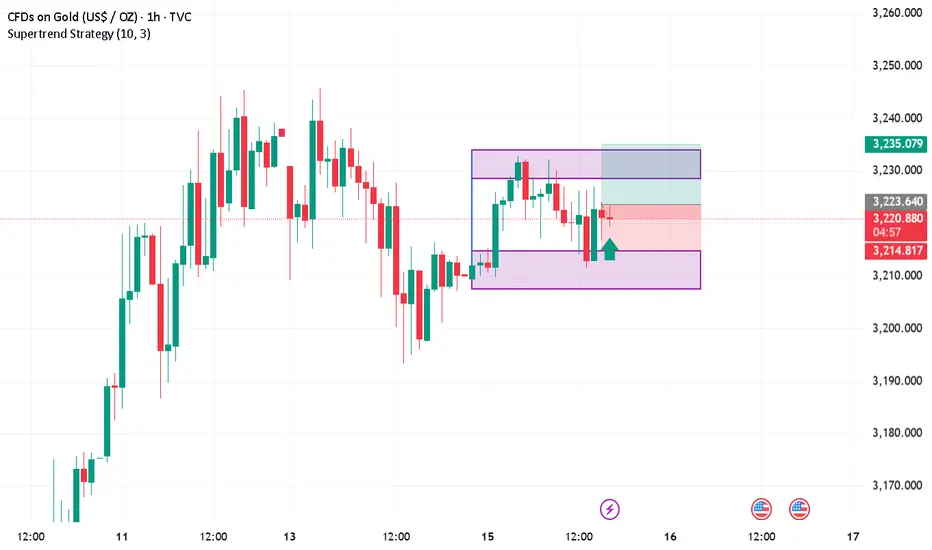
XAUUSD:In a fluctuating market, go long when there is a pullbackToday, the characteristics of intraday oscillatory adjustments are evident, and the magnetic attraction effect within the range of 3235-3200 is remarkable. It is advisable to maintain a range-trading mindset. Currently, the upper resistance lies at the 3232-3235 level, and the lower support is at 3200-3195. Wait patiently for the key data on Wednesday to provide a clear directional guidance. In terms of operation, the main strategy is to go long at relatively low prices.
Trading Strategy:
buy@3200-3210
TP:3220-3240
The signals resulted in continuous profits, and accurate signals were shared daily.
👇 👇 👇 Obtain signals👉👉👉

XAUUSD Entre point 3222 Target 3232 Stop loss 3214XAUUSD Trade:
Buy Signal:
Entry: 3222
Target: 3232 (+10 pips)
Stop Loss: 3214 (large stop)
Let's monitor the trade! Potential for gains!
Will Gold Retest 3170 ATHs in Sight Amid Rising Global TensionsXAU/USD has decisively broken above the significant 3170 resistance level, confirming bullish momentum and signaling a potential continuation of its long-term uptrend. This breakout is not just technical—it's backed by a growing fundamental storm.
With escalating geopolitical tensions, the ongoing trade war rhetoric surrounding Trump’s tariff policies, and persistent global macro uncertainty, gold is once again asserting its role as a premier safe haven asset. These drivers are creating the perfect backdrop for further upside, possibly pushing gold toward new all-time highs.
Currently, price is in a healthy correction phase, pulling back toward the former resistance zone at 3170, which now acts as strong support. A retest and confirmation in this area may offer a high-probability long setup for trend-followers and breakout traders alike.

Sizable fall possible... Starting todayNothing much to describe.
Everything on chart.
Best selling zone 3227-3236
Stop (approx) 3245-48
Expecting 3182-3168-60
And much more in coming days... May be 2880/60
Posting hourly chart.

Gold might peak around 3285 with potential downside targets 2900(The following is solely my personal opinion and not investment advice. Please make your own judgments before making any decisions.)
Gold saw a sharp rally last week, and the RSI indicates it is overbought. If a bearish crossover appears on the weekly MACD, gold may face a short-term pullback.
Based on current observations, this upward move might peak around 3279–3295, with potential downside targets at 2966–2835. If the decline continues, there's a chance it could retrace further to around 2500.
Similar patterns occurred in August 2011 and July 2020. In 2011, gold dropped from 1930 to 1045, and in 2020, it fell from a high of 2076 to 1619.
This is a technical warning — short-term traders should be mindful of the risks. For long-term holders, I personally wouldn't be too concerned about a short-term correction in gold prices.

gold ; Is it time to move up or down? In the short term, of courGood day: My friends, this is my mind in the short and medium term for trading. This is just a theory, not a buy or sell signal.

XAUUSDlooking for long positions as shown in analysis. always do proper risk management.
By sharing your ideas in the comment below will help us understand financial markets better..

Gold: It may Fall below 3180 todayOver the weekend, Trump announced a pause on tariffs for popular consumer electronics, prompting gold to gap down to 3210 at today’s open;
✅ Our recommended short entries at 3230–3260 are already in profit;
New semiconductor tariff announcements are due during the U.S. session today — the key driver for gold’s next move;
Given the fragile U.S. political/economic backdrop, escalating tariff conflict is unlikely, increasing the chance of bearish impact on gold;
With gold already trading at a premium, any "tariff relief" narrative will likely trigger speculative sell-offs;
If you're holding short positions, consider being patient — avoid premature exits due to emotional reaction to minor pullbacks.
Maintain key short entry zone: 3230 – 3260;
Expect gold to test below 3180 if market sentiment shifts

XAU/USD "The Gold" Metal Market Heist Plan (Scalping/Day Trade)🌟Hi! Hola! Ola! Bonjour! Hallo! Marhaba!🌟
Dear Money Makers & Robbers, 🤑💰✈️
Based on 🔥Thief Trading style technical and fundamental analysis🔥, here is our master plan to heist the XAU/USD "The Gold" Metal Market. Please adhere to the strategy I've outlined in the chart, which emphasizes short entry. Our aim is the high-risk Pink MA Zone. Risky level, oversold market, consolidation, trend reversal, trap at the level where traders and bullish robbers are stronger. 🏆💸"Take profit and treat yourself, traders. You deserve it!💪🏆🎉
Entry 📈 : "The heist is on! Wait for the breakout then make your move at (3185) - Bearish profits await!"
however I advise to Place sell stop orders below the Breakout level (or) after the breakout of Support level Place sell limit orders within a 15 or 30 minute timeframe most NEAREST (or) SWING low or high level for Pullback entries.
📌I strongly advise you to set an "alert (Alarm)" on your chart so you can see when the breakout entry occurs.
Stop Loss 🛑: "🔊 Yo, listen up! 🗣️ If you're lookin' to get in on a sell stop order, don't even think about settin' that stop loss till after the breakout 🚀. You feel me? Now, if you're smart, you'll place that stop loss where I told you to 📍, but if you're a rebel, you can put it wherever you like 🤪 - just don't say I didn't warn you ⚠️. You're playin' with fire 🔥, and it's your risk, not mine 👊."
📌Thief SL placed at the nearest/swing High or Low level Using the 30min timeframe (3240) Day/Scalping trade basis.
📌SL is based on your risk of the trade, lot size and how many multiple orders you have to take.
Target 🎯: 3130
💰💵💴💸XAU/USD "The Gold" Metal Market Heist Plan (Day / Scalping Trade) is currently experiencing a Neutral trend (there is a chance to move bearishness).., driven by several key factors.👇👇👇
📰🗞️Get & Read the Fundamental, Macro, COT Report, Quantitative Analysis, Sentimental Outlook, Intermarket Analysis, Future trend targets... go ahead to check 👉👉👉🔗🔗
⚠️Trading Alert : News Releases and Position Management 📰 🗞️ 🚫🚏
As a reminder, news releases can have a significant impact on market prices and volatility. To minimize potential losses and protect your running positions,
we recommend the following:
Avoid taking new trades during news releases
Use trailing stop-loss orders to protect your running positions and lock in profits
💖Supporting our robbery plan 💥Hit the Boost Button💥 will enable us to effortlessly make and steal money 💰💵. Boost the strength of our robbery team. Every day in this market make money with ease by using the Thief Trading Style.🏆💪🤝❤️🎉🚀
I'll see you soon with another heist plan, so stay tuned 🤑🐱👤🤗🤩
2 hours ago

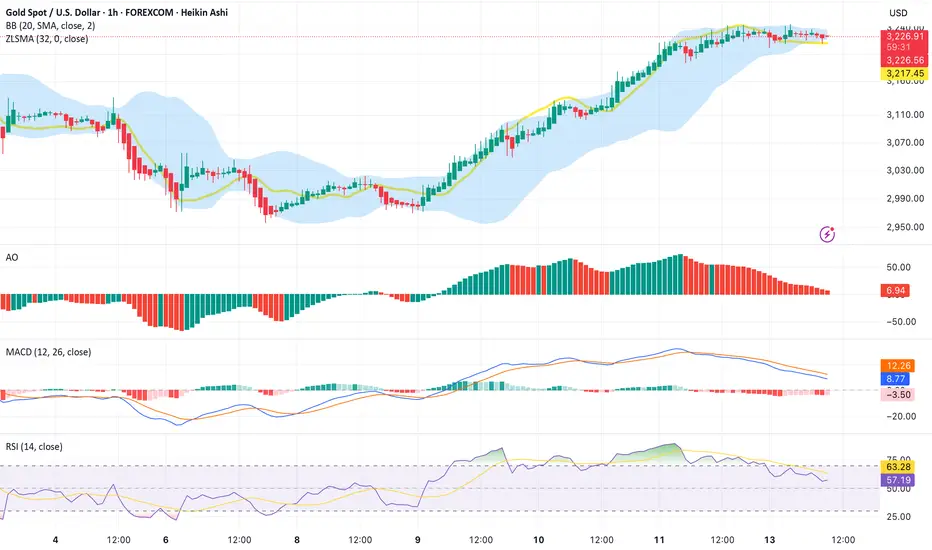
Gold Market Outlook: Potential Pullback in Play Following Early Early this morning, the gold market opened with a downside gap, potentially signaling the beginning of a corrective phase. With no high-impact economic events on the calendar today, price action may remain sideways or retrace toward the previous session’s low. On the 1-hour timeframe, bearish divergence has already been identified, supporting the case for a short-term pullback.
A similar consolidation phase occurred after the bullish momentum seen from March 11 to March 20. If no unexpected developments influence the market, comparable price behavior could emerge. Overall, conditions suggest a classic breakout–pullback–continuation scenario, which is consistent with typical movements following strong directional trends. A key resistance zone near the 3280 level is currently being observed as a potential target area

Gold Holds Haven Status Above 3200Gold maintains its safe-haven appeal, holding firmly above the $3,200 mark. The current trend met resistance near $3,250, and a decisive breakout could drive further gains toward $3,290–$3,300, fueled by rising trade war tensions and ongoing dollar weakness.
• Downside Risks:
If the dollar reverses or U.S.–China trade talks show progress, a drop below $3,200 may lead to pullbacks toward $3,190 and $3,170.
A deeper decline could trigger a broader correction toward $3,100 and $3,090, helping to reset overbought momentum on higher time frames or set the stage for a deeper downturn.
- Razan Hilal, CMT

XAUUSD - UniverseMetta - Signal#XAUUSD - UniverseMetta - Signal
H4 - Formation of double tops from the upper border of the diverging triangle. It is better to place the stop behind the maximum of the 1st wave.
Entry: 3209.786
TP: 3134.258 - 3100.990 - 3065.924 - 3025.462
Stop: 3251.931

the gold down as we expact before start to go upxauusd
enter=3195
TP1=3245
TP2=3363
TP3=3297
ST=3177

Daily Analysis: 14-04-2025Spot gold ended last week with a strong gain of 6.6%, closing at 3238 and recording a new all-time high at 3245. This morning, gold is witnessing profit-taking activity. These pullbacks are likely due to President Trump’s retreat from his previously hardline stance on tariffs, which boosted risk appetite and prompted some investors to take profits. On the other hand, the U.S. dollar continues to weaken.
In this context, as long as the 3200 support level is maintained, the 3260 resistance remains a potential target. However, if the 3200 support is broken, the levels of 3175 and 3150 may emerge as the next support zones.
GoldXAUUSD
- Consolidation Phase
- Break of Structure
- Ascending Triangle as an corrective pattern in short time frame
- Completed " 12345 " Impulsive Waves and " ABC " corrective pattern
- Falling Wedge in Short Time Frame

April 14, 2025 - XAUUSD GOLD Analysis and Potential OpportunitySummary:
Last week, gold continued to post new all-time highs, and the market was highly active. For short-term traders, both long and short setups provided profitable opportunities.
However, it’s important to respect the market and carefully evaluate every trade entry — especially after such a strong bullish run.
The previous high was 3245.5 — shorting near this level offers a favorable risk-reward. If the price breaks above and sets a new high, I’ll wait for a pullback before entering any new long positions.
Key Levels to Watch:
3250–3255: Bullish target zone
3246: ATH resistance
3234: Bullish/Bearish pivot line
3228: Support
3218: Key intraday support
3210: Final bullish defense
3088: Major historical support
Short-Term (15m) Strategy:
For Shorts: Enter a SELL if the price breaks below 3237. Watch 3234 first; if the decline continues, monitor 3230, 3228, and 3224.
For Longs: Enter a BUY if the price holds above 3246. Watch 3250 for confirmation; if bullish momentum continues, target 3255, 3260, and 3265.
👉 If my insights have been helpful to you, or if you traded based on my ideas, please consider giving a like — it’s a great encouragement for me! Thanks for your support!
Disclaimer: This is my personal opinion and not financial advice. Please manage your risk accordingly.
