xauusd down side viewIf the support zone is broken, XAUUSD will drop to the next zone as everyone buys the support level and the market will drop to their SL which will determine XAUUSD
XAUUSD.F trade ideas

GOLD MARKET UPDATE – Trend Breakouts and Market Structure Shift🟡 GOLD MARKET UPDATE – Trend Breakouts and Market Structure Shift
Gold has broken through both the parallel ascending channel and a narrow triangle pattern at the edges, resulting in a strong buying momentum (FOMO BUY). This move can be attributed to a mild positive shift in the US stock market yesterday, along with some upward momentum in the Asian and European markets today.
📉 Current Situation: It’s still unclear whether this movement is tied to positive news about tariffs, but an important level to watch is 3075 – 3077. If this level is breached, it may be time to reassess the outlook and consider shifting towards a BUY.
💡 Currently, there’s strong buying activity during the European session. It’s recommended to avoid jumping into BUY positions at these levels and to refrain from selling too aggressively.
📌 Scenario for Today: Look for potential BUY opportunities at the important levels 3030 – 3018 during the European session, and stay tuned for updates regarding FOMC tonight.
🔮 Be Cautious: The FOMC meeting will take place later today, which could lead to significant market movements. Be prepared for potential volatility and liquidity sweeps in less liquid areas.
🧭 Key Technical Levels:
🔺 Resistance: 3075 – 3090 – 3110
🔻 Support: 3030 – 3018 – 3000 – 2988 – 2974
🎯 Trade Setup:
🔴 SELL ZONE: 3074 – 3076
SL: 3080
TP: 3070 – 3066 – 3062 – 3058 – 3054 – 3050 – 3040
🟢 BUY ZONE: 2976 – 2974
SL: 2970
TP: 2980 – 2984 – 2988 – 2992 – 2996 – 3000
📌 Reminder: The market is currently very sensitive, so stick to risk management rules, ensure full TP/SL implementation, and avoid making hasty decisions.
Be cautious and watch the market movements closely!
— AD | Money Market Flow

Idea for Mon 14 Apr - Gold Short – Bear in a Bull OutfitOANDA:XAUUSD
Gold has been heavily influenced by recent developments in the trade war.
A 90-day pause on tariffs (excluding China) and the exemption of smartphones and computers from tariffs were announced on friday.
These headlines may temporarily calm markets and give stocks room to rise — which typically puts pressure on gold. If Dollar is rising again, could be a side effect too.
This could lead to a short-term pullback in gold prices.
A price gap was formed around $3175.51 during the opening session on Thursday, April 10th.
After a small bounce, i expect gold to move downward to fill that gap.
A potential support level is sitting near $3156, which could act as a bounce zone.
"Next week it’s a bear inside a bull outfit."
Despite a broader bullish structure, we could see the week start with a correction. A classic gap-fill setup for the short-term traders.
RSI and MacD are on top levels, but for how long?
-------------------------------------------------------------------------
This is just my personal market idea and not financial advice! 📢 Trading gold and other financial instruments carries risks – only invest what you can afford to lose. Always do your own analysis, use solid risk management, and trade responsibly.
Good luck and safe trading! 🚀📊

Gold fluctuates at a high level, how to choose the direction?This week, the gold market showed a high range oscillation pattern. After opening at 3210 on Monday, it quickly rose to the historical high of 3245, but the daily line closed with a negative cross needle, indicating that the long-short game intensified. The gold price fluctuated and fell in the Asian and NY periods. Although the NY period showed a short-term illusion of a high rise, it failed to break through 3227 and plunged to 3193 under pressure. The rebound in the late trading recovered some of the lost ground.
The current price of gold is running in the range of 3245-3193, and it continued to consolidate in a narrow range at 3215 today. It is worth noting that the market generally expects the unilateral 100-point market last week to reappear, but ignores the characteristics of this week's oscillation and energy storage. Blindly chasing ups and downs is easy to fall into passivity. From the technical form, the upper 3237-3245 constitutes a strong resistance zone, and the lower 3193-3188 forms a key support. It is recommended that everyone maintain the thinking of range operation, rely on support and resistance to choose the opportunity to buy low and sell high, and wait patiently for the market to clarify the direction before making trend layout.
Operation strategy 1: It is recommended to go short at rebound 3225-3230, SL: 3237, TP: 3200-3190.
Operation strategy 2: It is recommended to go long at callback 3190-3185, SL: 3177, TP: 3210-3220.

GOLD The chart shows price moving in a tight consolidation zone between the resistance area near 3,245 and support at3,213. While the price has tested the resistance multiple times, it has failed to break out decisively, indicating possible bearish weakness emerging.
---
🔍 Discrepation Zones (Key Conflicts):
1. Price vs. Resistance Reaction
- Expected: Breakout continuation above $3,245 due to repeated testing.
- Actual: Price rejected again after touching resistance.
- Discrepation: Buyers are unable to sustain upward momentum, revealing fading bullish strength despite frequent attempts.
---
2. Volume Behavior vs. Price Actio…
This hidden bearishness suggests sellers may be stepping in before each breakout attempt completes.
—
4. Target Discrepancy at3213.070
- While current price appears stable, the projection clearly anticipates a pullback to 3213.070.
- This level sits just above a major support block, marking a key imbalance between current consolidation and the expected move down.
—
🧭 Discrepation Summary Table:
| Element | Expected Behavior | Observed Behavior | Discrepation |
|————————–|——————————-|————————————-|———————————————|
| Resistance Test | Breakout after repeated tests | Another rejection | Buyers failing to gain momentum |
| Volume Analysis | Increased …
: Gold is showing signs of hidden bearish pressure. Although still inside a range, multiple failed breakout attempts, declining volume, and a projected drop to3213.070 point to a clear discrepation between expected bullish continuation and emerging bearish signals.
📌 Watch how price behaves near the $3,230 level. A decisive break could validate the bearish target, especially if volume increases on the move down.
Let me know if you want this turned into a social post or shorter caption!

a breakdown of the 6 month channel
"On the yearly chart, gold is near its trading high, and on the 6-month chart, it's near a support floor. There's a high probability of the support breaking."
Here's a slightly more formal way to phrase it, which might be used in a trading context:
"On the annual timeframe, gold is trading close to its resistance peak, while the 6-month chart shows it nearing a support level. The likelihood of this support being breached is quite high."

Hanzo | Gold 15 min Breaks – Will Confirm the Next Move🆚 Gold
The Path of Precision – Hanzo’s Market Strike
🔥 Key Levels & Breakout Strategy – 15M TF
🔥 Deep market insight – no random moves, only calculated execution.
☄️ Bullish Setup After Break Out – 3008 Zone
Price must break liquidity with high volume to confirm the move.
☄️ Bullish Setup After Break Out – 3060 Zone
Price must break liquidity with high volume to confirm the move.
🩸 15M Time Frame Confluence
————
CHoCH & Liquidity Grab @ 3059
Key Level / Equal lows Formation - 3014
Strong Rejection from 3014 – The Ultimate Pivot
Strong Rejection from 3060 – The Ultimate Pivot
Strong Rejection from 3082 – The Ultimate Pivot
🔥 1H Time Frame Confirmation
Twin Wicks @ 3055 – Liquidity Engineered
Twin Wicks @ 3060 – Liquidity Engineered
Twin Wicks @ 3014 zone – Liquidity Engineered
☄️ 4H Historical Market Memory
——
💯 3 Apr 2025 – Bullish Retest 3054
💯 27 march 2025 – Bullish Retest / Spike 3054
💯 26 March 2025 – Liquidity Grab Range 3016 : 3010
👌 The Market Has Spoken – Are You Ready to Strike?

GOLD: Long Trade Explained
GOLD
- Classic bullish setup
- Our team expects bullish continuation
SUGGESTED TRADE:
Swing Trade
Long GOLD
Entry Point - 3006.4
Stop Loss - 2998.0
Take Profit - 3024.8
Our Risk - 1%
Start protection of your profits from lower levels
Disclosure: I am part of Trade Nation's Influencer program and receive a monthly fee for using their TradingView charts in my analysis.
❤️ Please, support our work with like & comment! ❤️

CFD Gold Chart Analysis: Wave 4 in FocusHello friends, let's analyze the Gold CFD chart from a technical perspective. As we can see, the higher degree Cycle Wave III (Red) has completed, and we're currently in Cycle degree Wave IV (Red). Within Wave IV, we expect a Primary Degree ((A)), ((B)), and ((C)) in Black. Wave ((A)) has completed, Wave ((B)) is almost complete, and Wave ((C)) is expected to follow.
Within Wave ((B)) in Black, we have Intermediate Degree Waves (A), (B), and (C) in Blue. Waves (A) and (B) are complete, and Wave (C) is nearing completion. Once Wave (C) in Blue completes, Wave ((B)) in Black will end, and Wave ((C)) in Black should begin.
According to theory, Wave ((A)) came down and then wave ((B)) retraced upwards so now Wave ((C)) should move downwards, forming a zigzag correction. The equality level is around $2858. However, we don't know if it will reach this level or extend/truncate.
The invalidation level for this view is 3169.23. If the price breaks above this level, our analysis will be invalidated.
This analysis is for educational purposes only and not trading advice. There's a risk of being completely wrong. Please consult your financial advisor before making any trades.
I am not Sebi registered analyst. My studies are for educational purpose only.
Please Consult your financial advisor before trading or investing.
I am not responsible for any kinds of your profits and your losses.
Most investors treat trading as a hobby because they have a full-time job doing something else.
However, If you treat trading like a business, it will pay you like a business.
If you treat like a hobby, hobbies don't pay, they cost you...!
Hope this post is helpful to community
Thanks
RK💕
Disclaimer and Risk Warning.
The analysis and discussion provided on in.tradingview.com is intended for educational purposes only and should not be relied upon for trading decisions. RK_Charts is not an investment adviser and the information provided here should not be taken as professional investment advice. Before buying or selling any investments, securities, or precious metals, it is recommended that you conduct your own due diligence. RK_Charts does not share in your profits and will not take responsibility for any losses you may incur. So Please Consult your financial advisor before trading or investing.

keep aiming for new ATH next week✍️ NOVA hello everyone, Let's comment on gold price next week from 04/14/2025 - 04/18/2025
🔥 World situation:
Gold extended its remarkable rally for a third consecutive session on Friday, surging to a fresh record high of $3,245 amid intensifying US–China trade tensions. The precious metal posted impressive gains of over 2% as fears of a prolonged trade war and its potential fallout on the global economy sent investors flocking to safe-haven assets. At the time of writing, XAU/USD is trading around $3,233.
The North American session saw China retaliate with a 125% tariff on US imports, following President Donald Trump’s move to raise tariffs on Chinese goods to 145%. The heightened geopolitical strain triggered a flight to safety, propelling Gold higher. Further fueling the rally was a sharp decline in the US Dollar, which tumbled to a near three-year low, with the US Dollar Index (DXY) falling to 99.01.
🔥 Identify:
The huge growth shows no signs of stopping, gold prices continue to benefit from tariff policies, continue to find new ATH early next week
🔥 Technically:
Based on the resistance and support areas of the gold price according to the H4 frame, NOVA identifies the important key areas as follows:
Resistance: $3255, $3280
Support : $3157, $3070
🔥 NOTE:
Note: Nova wishes traders to manage their capital well
- take the number of lots that match your capital
- Takeprofit equal to 4-6% of capital account
- Stoplose equal to 2-3% of capital account
- The winner is the one who sticks with the market the longest

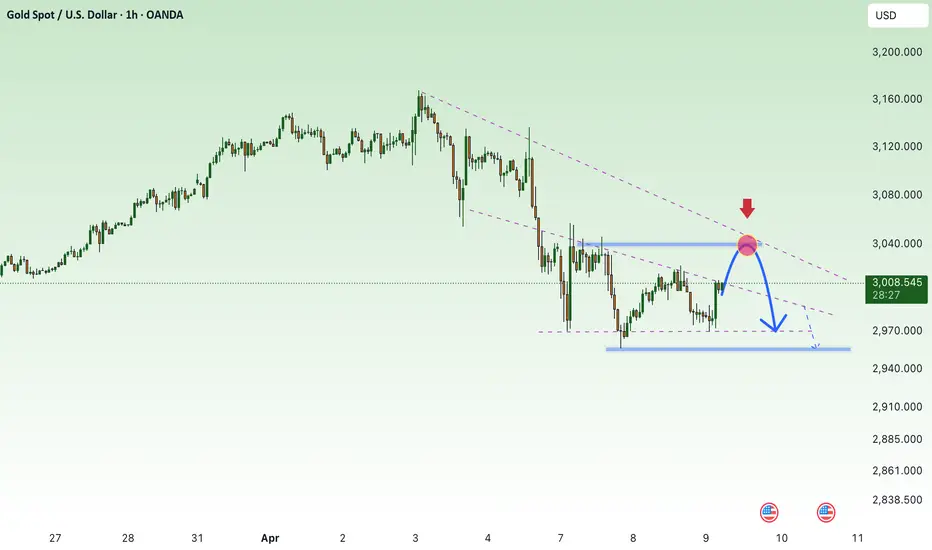
XAUUSD Daily Sniper Plan – April 8, 2025“Goldie’s mood swings: from drama queen to calculated killer.”
Gold decided to throw a tantrum after NFP and play peek-a-boo with everyone’s SL. But beneath the chaos lies structure—and we speak structure fluently. Let’s map this battlefield with sniper entries and cold logic. No guessing, just high confluence.
📌 Macro Context
🏛️ Geopolitical: Israel-Iran tensions still simmering. Headlines = spikes. Stay nimble.
💰 Fundamentals: Stronger USD post-NFP; Fed tone remains hawkish.
🔍 Technical Environment:
H1/H4 break of bullish structure
D1 printed a brutal engulfing candle
EMA 5/21/50 all pointing down on M30–H1, kissing goodbye to bullish hopes (for now)
“The spike was no accident. Smart money never sleeps.”
📉 Bias: Bearish intraday flow under OB 2980–3000
🔻 SELL SETUPS
🟥 SELL SETUP 1 – OB Rejection Sniper
📍 Entry: 2995–3000
🧠 Why: H1 valid OB + imbalance + bearish CHoCH on M5
🎯 TP1: 2960
🎯 TP2: 2915
🛑 SL: 3008
💬 Classic OB rejection. Look for a wick grab then drop on LTF.
🟥 SELL SETUP 2 – Stop Hunt Pop
📍 Entry: 3010–3015
🧠 Why: Liquidity sweep above 3000, into bearish FVG zone
🎯 TP1: 2975
🎯 TP2: 2940
🛑 SL: 3019
💡 Ideal on a fast pump, then M1 bearish structure shift confirmation.
🟥 SELL SETUP 3 – EMA50 Tap & Fade
📍 Entry: 3035–3040
🧠 Why: Confluence of bearish trendline retest + EMA50 (H1)
🎯 TP1: 2990
🎯 TP2: 2950
🛑 SL: 3046
🎯 Catch the fakeout bounce. Risk defined. Trend respected.
🟩 BUY SETUPS
🟩 BUY SETUP 1 – Deep Discount Bounce
📍 Entry: 2945–2955
🧠 Why: M30 OB + unmitigated FVG + 0.618 FIB
🎯 TP1: 2990
🎯 TP2: 3030
🛑 SL: 2938
💬 Only valid if 2960 gets flushed cleanly with momentum shift.
🟩 BUY SETUP 2 – Retest of Previous Demand
📍 Entry: 2905–2915
🧠 Why: Unmitigated H4 OB zone + previous bounce structure
🎯 TP1: 2960
🎯 TP2: 3000
🛑 SL: 2895
📈 Take this if we get heavy stop hunts early and DXY slows.
🟩 BUY SETUP 3 – Extreme Demand Sweep
📍 Entry: 2885–2895
🧠 Why: HTF demand zone + psychological 2900 + imbalance
🎯 TP1: 2950
🎯 TP2: 2980
🛑 SL: 2878
🧠 Perfect for the brave — sniper only on strong bounce confirmation (M5).
⚔️ Key Levels Recap:
🔸 3000–2980: Valid OB resistance zone
🔸 2960–2950: Discount reaction base
🔸 2915 / 2890: Deeper liquidity zones
🔸 3045: SL invalidation on bearish bias
🔸 2880: Final demand for aggressive longs
🧠 Strategy Notes:
Watch for manipulation moves into OB or imbalance before taking entries.
Wait for CHoCH or PA confirmation on M1–M5 before executing.
Don’t chase — sniper setups only.
💬 "Goldie might be emotional, but our setups aren’t."
🗣️ Let’s grow together!
🔥 If this sniper plan gave you clarity, drop a like & follow on TradingView 💬
Let’s grow a strong trading community built on structure, not signals.
Stay sharp & stay kind, legends! 💛
📌 No guessing. No chasing. Just smart money and structure.

GOLD DAILY CHART MID/LONG TERM UPDATEHey Everyone,
This is an update on our daily chart idea that we have been tracking for a while now and finally completed last week. However, I wanted to continue to share an update on this, as its still playing out by falling back into the range on Fridays drop in price.
Historically, whenever we see a breakout outside of our unique Goldturn channels; I always state that, when price does a correction, we look for support outside of the channel top. This is playing out to perfection with Fridays drop finding support on the channel top, as highlighted by us on the chart with a circle. This was done with precision!!
We will now look for a test above at 3052 and a body close above this will follow with continuation to 3103 or a break below inside the channel top wall with ema5 will re-activate the levels below inside the channel, which we can then continue to track back up level to level, like we did before. I have also updated the levels above the channel to cover the new range.
This is the beauty of our Goldturn channels, which we draw in our unique way, using averages rather than price. This enables us to identify fake-outs and breakouts clearly, as minimal noise in the way our channels are drawn.
We will use our smaller timeframe analysis on the 1H and 4H chart to buy dips from the weighted Goldturns for 30 to 40 pips clean. Ranging markets are perfectly suited for this type of trading, instead of trying to hold longer positions and getting chopped up in the swings up and down in the range.
We will keep the above in mind when taking buys from dips. Our updated levels and weighted levels will allow us to track the movement down and then catch bounces up using our smaller timeframe ideas.
Our long term bias is Bullish and therefore we look forward to drops from rejections, which allows us to continue to use our smaller timeframes to buy dips using our levels and setups.
Buying dips allows us to safely manage any swings rather then chasing the bull from the top.
Thank you all for your likes, comments and follows, we really appreciate it!
Mr Gold
GoldViewFX

Gold price accumulates below 3038, waiting for FOMC information⭐️GOLDEN INFORMATION:
Gold prices break a three-day losing streak but remain capped below the key $3,000 level, as rising US Treasury yields dampen the appeal of the non-interest-bearing metal. Despite optimism surrounding potential trade agreements among global partners, lingering tensions in the ongoing US–China trade conflict continue to keep investors on edge. At the time of writing, XAU/USD is trading flat around $2,980 per troy ounce.
⭐️Personal comments NOVA:
Gold price moves with large amplitude, in a downward correction phase. Continues to trade below 3040 waiting for the FED's move on interest rates and agreements on tariff levels of countries around the world.
⭐️SET UP GOLD PRICE:
🔥SELL GOLD zone : 3038 - 3040 SL 3045
TP1: $3028
TP2: $3015
TP3: $3000
🔥BUY GOLD zone: $2958 - $2960 SL $2953
TP1: $2975
TP2: $2990
TP3: $3010
⭐️Technical analysis:
Based on technical indicators EMA 34, EMA89 and support resistance areas to set up a reasonable SELL order.
⭐️NOTE:
Note: Nova wishes traders to manage their capital well
- take the number of lots that match your capital
- Takeprofit equal to 4-6% of capital account
- Stoplose equal to 2-3% of capital account
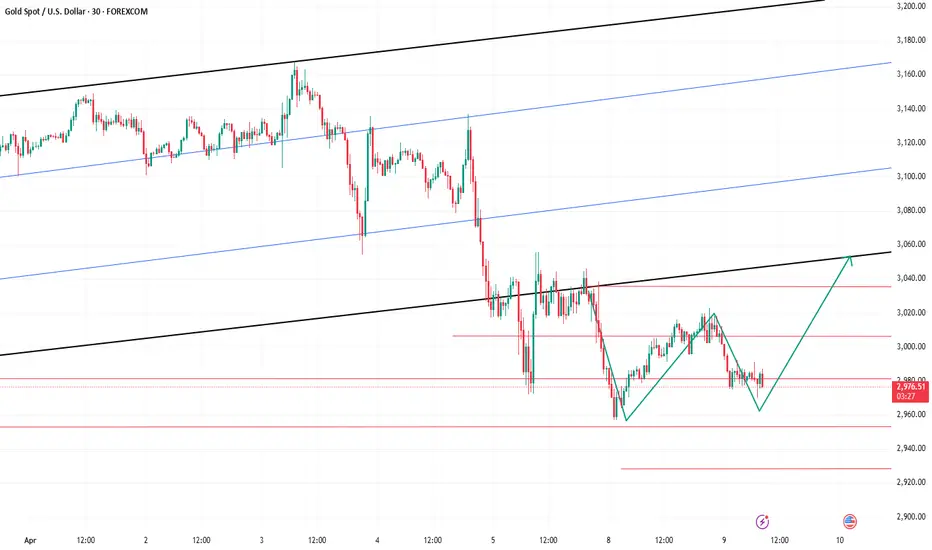
Gold 1H Intra-Day Chart 09.04.2025Gold is extremely bullish right now due to Tariff wars! So what's next?
Option 1: Gold rejects from CMP and drops down towards $3,040.
Option 2: Gold climbs a little higher towards $3,110 - $3,140 before dropping down.
Which scenario do you find more likely?

XAUUSD Analysis todayHello traders, this is a complete multiple timeframe analysis of this pair. We see could find significant trading opportunities as per analysis upon price action confirmation we may take this trade. Smash the like button if you find value in this analysis and drop a comment if you have any questions or let me know which pair to cover in my next analysis.

The impact of tariffs on goldThe 4-hour chart has a strong structure. In the future, we will focus on the attack and defense of the 61.8% node 3086. Below this, we will maintain a short-term mindset. If it breaks through, we will look back to the highs. The short-term support in the evening is 3052, and the strong support is 3044-3040; the short-term resistance is MA10-3070 on the daily chart, and the strong resistance is 3078-3082. In terms of operation strategy, it is recommended to follow the trend to 3086 and then adjust the direction.
Operation strategy:
1. It is recommended to buy gold near 3052, stop loss at 3042, and target at 3080;
2. It is recommended to sell gold around 3086, stop loss at 3096, and target at 3056;

Weak USD and expectations of Fed rate cuts support gold.📉 Technical Analysis (Short-Term):
Gold is in a strong uptrend.
Key resistance at $3250; breakout targets $3275+.
Support at $3215; a break below may lead to $3190–$3200.
Indicators (RSI & MACD) show strong momentum but slight pullback risk.
🧠 Fundamental Analysis:
Weak USD and expectations of Fed rate cuts support gold.
Global trade tensions increase safe haven demand.
Central banks and ETFs continue to accumulate gold.
💬 Sentiment Analysis:
Market is buying dips aggressively.
Confidence is high due to macro uncertainty.
Traders are watching $3250 breakout as a trigger for further upside.


Gold: Buy, Target 3004-3028On the 1H chart, the MACD is showing a bullish divergence, signaling a potential bottom. If gold can build a base around 2960-2980, bulls will have the upper hand from a technical standpoint.
While today's major macro news will hit during the U.S. session, technical analysis dominates the Asian and European sessions — which favors a buy-on-dip strategy.
The 3030 resistance, which wasn’t tested yesterday, may be reached today.
If the price drops unexpectedly, watch the 2946-2928-2916 zone for new buying opportunities — especially 2928-2916, which is a strong support zone.
Buy:2960 - 2980
TP:3004 - 3028
XAUUSD – 4H Key Levels Map (as of April 13, 2025)🔍 XAUUSD – 4H Key Levels Map (as of April 13, 2025)
🔼 Key Resistance Zone – 3,275–3,285 (Premium + Weak High Zone)
Why it matters: This is where price reached extreme premium and swept a weak high. It’s also the highest H4 imbalance zone.
What to watch:
Watch for rejection patterns: M5/M15 CHoCH, bearish OB rejections, or RSI bearish divergence.
If price closes above 3,285 with volume and EMA5 lock → watch for bullish continuation and potential new ATHs.
🟦 Mid-Level Liquidity Pocket – 3,221–3,233 (Previous H4 FVG zone)
Why it matters: This zone was the launchpad of the impulsive move. It still holds unmitigated imbalance.
What to watch:
First retest of this zone could offer a bounce.
If broken cleanly → invalidates recent push, opens path to deeper retrace.
Look for M15 CHoCH + bullish OB to validate reentry if we drop here.
🧊 Support Zone – 3,065–3,085 (Previous H4 BOS + FVG)
Why it matters: Clean BOS level where structure flipped bullish. Imbalance is also present.
What to watch:
Major zone for potential retracement buys.
If price rejects here on higher timeframe → signs of continuation.
EMA5/21 alignment above this zone supports bullish momentum.
🔽 Ultimate H4 Demand Zone – 2,958–2,972 (Discount Zone)
Why it matters: Previous accumulation range, massive unmitigated imbalance, and strong HL.
What to watch:
Extreme demand zone — only in case of full market correction.
Watch for long wicks or liquidity grabs with M15/M5 CHoCH confirmation.
✅ Summary:
Gold is still flexing bullish strength, but we’re deep into premium. Don’t rush — let the price talk. If we reject the highs, be ready at 3,221 and 3,065 for potential entries. Stay patient, stay sharp — the clean setups are always worth the wait.
💛 Friendly Note to Fellow Traders:
Take a deep breath, trust your levels, and don’t let FOMO drive your next click. Gold always gives another chance — if not today, then tomorrow. Happy trading, and if this helped, drop a like or comment — we’re all learning this magic together!

Gold to print historic 30% correction?On the above 2 week chart Gold price action has completed the much anticipated Cup and Handle forecast to $2700, which was where Without Worries dabbled with a “short” position and was promptly stopped out much to the bugs delight.
Price action has rallied 180% since the 2016 lows, amazing. The increased Money supply / Money printing is the reason I’m often given for this historic rally. The facts are the money supply has increased 68% since the 2016 lows and not 180%, which would price an ounce at $1750 today. Now I know someone will be quick to comment my being selective with dates. To that end we can go back further, 18 years since that fits over the well understood business cycle, which is approaching its peak. Since 2007 money supply has increased 195% with Gold price action 400%. This is a bubble.
This idea is not about fundamentals however, it is technical only.
1) Price action is in bubble territory. Look left, 50% above the 5 week Gaussian channel saw corrections of at least 30%.
2) Price action on the 2 week chart prints the strongest negative divergence since the positive divergence in December 2013 at 1190 an ounce.
3) The $2000 support breakout has never confirmed support.
4) On the weekly chart a bearish engulfing candle prints as price action enters the Bollinger Band. A correction to 2730 is now highly probable.
Is it possible price action continues up? Sure.
Is it probable? No.
Ww
5 week Gaussian channel
Weekly bearish engulfing

XAUUSD continues to fall sharplyHello everyone, it’s great to see you again in our discussion about gold prices today.
Last night, gold prices dropped sharply as investors took profits, U.S. bond yields rose, the USD strengthened, and gold plummeted. At one point, gold even touched the level of 2,955 USD; however, it quickly adjusted to limit the decline, although it has not yet managed to revive the trend.
At the time of writing, XAUUSD is moving around the 3,006 USD mark, achieving a recovery of over 200 pips. Accordingly, technical analysis shows that gold is forming waves according to Dow theory, with the correction target aimed at the 0.618 - 0.5 Fibonacci area before sellers regain control, as the current environment still puts gold at a disadvantage.

great win ratio take some riskgold well drop down from 3180 to have some correction
grear r:r take some risk
