Gold's Rollercoaster: From 3167 ATH to 2950 Support–What's Next?Since the beginning of the year, Gold has been on an impressive uptrend, gaining over 5000 pips, culminating with last week's ATH at 3167.
As I highlighted throughout last week's analyses, even though we're in a strong uptrend, the price was too far deviated from the mean, making a correction inevitable.
✅ Friday Recap:
After testing the resistance zone formed at 3135-3140, Gold dropped hard, closing the week 1000 pips lower from its peak during Friday's session.
📉 Recent Developments:
The correction continued yesterday, with Gold recently touching an important confluence support around 2950.
📈 What's Next?
I expect an upward movement and resumption of the uptrend, with targets at:
• 3050 zone 📌
• 3080 zone 📌
🎯 Plan:
Buy dips near support, aiming for the mentioned targets. The analysis would be negated if we see a clear break below 2950. 🚀
Disclosure: I am part of Trade Nation's Influencer program and receive a monthly fee for using their TradingView charts in my analyses and educational articles.
XAUUSD.P trade ideas

Your Best Trading Signal Formula Revealed (Forex, Gold)
If you are looking for a way to increase the accuracy of your trades, I prepared for you a simple yet powerful checklist that you can apply to validate your trades.
✔️ - The trades fit my trading plan
When you are planning to open a trade, make sure that it is strictly based on your rules and your entry reasons match your trading plan.
For example, imagine you found some good reasons to buy USDJPY pair, and you decide to open a long trade. However, checking your trading plan, you have an important rule there - the market should strictly lie on a key level.
The current market conditions do not fit your trading plan, so you skip that trade.
✔️ - The trade is in the direction with the trend
That condition is mainly addressed to the newbie traders.
Trading against the trend is much more complicated and riskier than trend-following trading, for that reason, I always recommend my students sticking with the trend.
Even though USDCHF formed a cute double bottom pattern after a strong bearish trend, and it is appealing to buy the oversold market, it is better to skip that trade because it is the position against the current trend.
✔️ - The trade has stop loss and target level
Know in advance where will be your goal for the trade and where you will close the position in a loss.
If you think that it is a good idea to buy gold now, but you have no clue how far it will go and where can be the target, do not take such a trade.
You should know your tp/sl before you open the trade.
✔️ - The trade has a good risk to reward ratio
Planning the trade, your potential reward should outweigh the potential risks. And of course, there are always the speculations about the optimal risk to reward ratio, however, try to have at least 1.3 R/R ratio.
Planning a long trade on EURNZD with a safe stop loss being below the current support and target - the local high, you can see that you get a negative r/r ratio, meaning that the potential risk is bigger than the potential reward. Such a trade is better to skip.
✔️ - I am ok with losing this trade if the market goes against me
Remember that even the best trading setups may occasionally fail. You should always be prepared for losses, and always keep in mind that 100% winning setups do not exist.
If you are not ready to lose, do not even open the position then.
✔️ - There are no important news events ahead
That rule is again primarily addressed to newbies because ahead and during the important news releases we have sudden volatility spikes.
Planning the trade, check the economic calendar, filtering top important news.
If important fundamentals are expected in the coming hours, it's better to wait until the news release first.
Taking a long trade on Gold, you should check the fundamentals first. Only after you confirm, that there are no fundamentals coming soon, you can open the position.
What I like about that checklist is that it is very simple, but you can use it whether you are a complete newbie or an experienced trader.
Try it and let me know if it helps you to improve your trading performance.
❤️Please, support my work with like, thank you!❤️
I am part of Trade Nation's Influencer program and receive a monthly fee for using their TradingView charts in my analysis.


Gold surged by $120 in a single day!Technically, after breaking through $3054 this week, the key resistance above moved up to the $3100 area. This position is the historical high and the dividing line between long and short positions. If it can stand firm, the gold price may further test the previous high and open up upward space. On the contrary, if the rebound encounters resistance and falls back, the 3050 line will become a short-term support belt, and breaking it may expand the adjustment range.
Gold recommendation: Go long when it falls back to around 3060-3065, stop loss 3053, target 3085

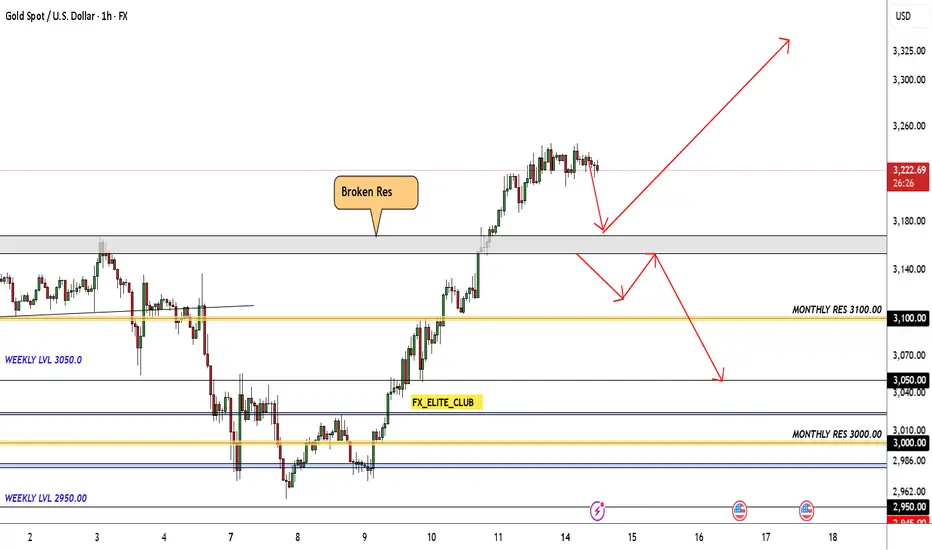
GOLD 2 Excepted Scenarios Very Clear , Which One You Prefer ? Here is my opinion on GOLD Chart , the price broke the highest Res , and continue to upside , so i think we have 2 ways in this pair right now , if the price go back to retest the broken res area and give us a good bullish Price Action we can enter a buy trade with smal lot size cuz the price at very high price , and if we have a clear closure below it , we can enter a sell trade with 500 pips target .
Has Gold established a bottom?04-07 was the ideal timing for a low, which proved to be correct.
From a cyclical standpoint, we need to break and close above the cycle-derived resistance line before a move toward new highs can be expected.
Why do cycles work? Because they define the natural boundaries of price energy. Just like everything in the universe moves in cycles, so does price. Mapping these cycles reveals order where there once appeared to be chaos.
Keep in mind that the potential for a larger FALSE MOVE to the downside still exists.

Has the gold tariff peaked?The 4H cycle failed to open upward. According to the general rule, there is a certain probability of a downward kill. The watershed below is still 3100. Only if it falls below this position can it gradually turn to short. At the same time, the current volatility is very large, and any fluctuation starts at ten points. It is recommended to reduce the position to trade; the current long structure of gold has not changed. The key support watershed below is still 3100. Above 3100, the strong bullish idea remains unchanged. Short-term operations rely on 3100 for defense, and enter the market near 3116 to gradually look up. Focus on the strength of the European session. If the European session rebounds and does not break the high, then short the US session at highs, and pay attention to the resistance of the 3148-50 area above.
Today's gold short-term operation ideas suggest that rebounding should be the main focus, and callbacks should be supplemented by longs. The upper short-term focus is on the first-line resistance of 3148-3150, and the lower short-term focus is on the 3100-3110 first-line support.
Short order strategy
Strategy 1: Short 20% of the gold position in batches when it rebounds to around 3148-3150, stop loss 6 points, target around 3135-3125, and look at 3115 if it breaks;
Long order strategy
Strategy 2: Long 20% of the gold position in batches when it pulls back to around 3115-3118, stop loss 6 points, target around 3130-3140, and look at 3150 if it breaks;

Bullish bounce off pullback suport?The Gold (XAU/USD) is falling towards the pivot which has been identifed as a pullback support and could bounce to the 1st resistance.
Pivot; 2,954.94
1st Support: 2,790.01
1st Resistance: 3,132.12
Risk Warning:
Trading Forex and CFDs carries a high level of risk to your capital and you should only trade with money you can afford to lose. Trading Forex and CFDs may not be suitable for all investors, so please ensure that you fully understand the risks involved and seek independent advice if necessary.
Disclaimer:
The above opinions given constitute general market commentary, and do not constitute the opinion or advice of IC Markets or any form of personal or investment advice.
Any opinions, news, research, analyses, prices, other information, or links to third-party sites contained on this website are provided on an "as-is" basis, are intended only to be informative, is not an advice nor a recommendation, nor research, or a record of our trading prices, or an offer of, or solicitation for a transaction in any financial instrument and thus should not be treated as such. The information provided does not involve any specific investment objectives, financial situation and needs of any specific person who may receive it. Please be aware, that past performance is not a reliable indicator of future performance and/or results. Past Performance or Forward-looking scenarios based upon the reasonable beliefs of the third-party provider are not a guarantee of future performance. Actual results may differ materially from those anticipated in forward-looking or past performance statements. IC Markets makes no representation or warranty and assumes no liability as to the accuracy or completeness of the information provided, nor any loss arising from any investment based on a recommendation, forecast or any information supplied by any third-party.

RSI 101: Revealing the Special Characteristics of RSIWhy does RSI have support and resistance levels at 40 and 60?
Why does divergence happen between RSI and price?
What is RSI momentum?
All the characteristics of RSI (that I know) will be explained here.
Formula and Meaning
If you are using TradingView, you probably already know what RSI is and what "overbought" and "oversold" mean. So, I won’t repeat it here. Instead, I’ll dive deeper into the true nature of RSI, giving you a different perspective.
You can skip the mathematical formula of RSI, it’s already discussed everywhere online. Just remember this ratio table:
Here’s how I explain the table:
At RSI = 50, the average gain equals the average loss (I'll call this the buy/sell ratio). This is a balanced point. Buyers and sellers are equally strong.
At RSI ~ 60 (66.66), the buy/sell ratio = 2/1. Buyers are twice as strong as sellers.
At RSI ~ 40 (33.33), the buy/sell ratio = 1/2. Sellers are twice as strong as buyers.
At RSI = 80, the buy/sell ratio = 4/1. Buyers are four times stronger.
At RSI = 20, the buy/sell ratio = 1/4. Sellers are four times stronger.
The formula shows that when RSI reaches 80 or 20, the buyer or seller is extremely strong — about four times stronger — confirming a clear trend.
At these levels, some Trading strategies suggest placing a Sell or Buy based on the overbought/oversold idea.
But for me, that’s not the best way. The right approach is: when a trend is clearly formed, we should follow it.
I'll explain why right below.
Look at this chart showing RSI changes with the buy/sell ratio:
When RSI > 50:
When RSI < 50:
You can see that the higher RSI goes, the slower it climbs, but the high buy/sell ratio makes price move up faster.
Similarly, when RSI goes lower, it drops slower but price drops faster.
That’s why at overbought (RSI=80) or oversold (RSI=20) areas, you need to be careful. Even a small RSI moving can lead to big price changes, easily hitting your stop loss.
On the other hand, if you follow the trend and wait for RSI to pull back, you will trade safer and more profitably.
RSI Key Levels
Here are some special RSI levels I personally find useful when observing FX:XAUUSD :
(These levels are relative. They might vary with different timeframes or trading pairs. Check historical data to find the right ones for you. On bigger timeframes like M15 or above, the accuracy is better.)
RSI = 20
When RSI hits 20, sellers dominate. This confirms a trend reversal to bearish.
RSI = 80
When RSI hits 80, buyers dominate. This confirms a trend reversal to bullish.
RSI = 40
This is a sensitive level. Sellers start gaining the upper hand (sell/buy = 2/1).
If buyers lose 40, they lose their advantage.
So RSI >= 40 is "buyer territory". In an uptrend, RSI usually stays above 40.
RSI = 40 acts as support in an uptrend.
RSI = 60
Same idea. RSI <= 60 is "seller territory".
RSI = 60 acts as resistance in a downtrend.
40 and 60 are considered the key levels of RSI.
Now you guys know why RSI has support/resistance around 40/60!
RSI Range
As you know, RSI moves between 0 and 100.
Since RSI >= 40 is buyer territory, we can see the relationship between price and RSI:
When RSI stays above 40, price tends to move in an uptrend:
When RSI stays below 60, price tends to move in a downtrend:
When RSI stays between 40 and 60, buyers and sellers are balanced, and price moves sideways in a box:
When RSI is moving, It creates a RSI Range.
Whenever the trend switches between the three states — uptrend, sideways, and downtrend — a Range Shift is formed.
At first, RSI moves in 40-60 range, price moves sideways. A strong price move pushes RSI to 80. Later, RSI stays above 50, helping price grow strongly. When momentum fades, RSI returns to 40-60 and price moves sideways again.
Note:
RSI reflects Dow Theory by showing the stages of accumulation, growth, and distribution.
And as you see, when RSI touches key levels, the trend often pulls it back.
RSI Momentum
Price momentum means how fast price changes.RSI momentum represents the change in the strength between buying and selling forces.
When RSI > 50:
If price falls, RSI shows high momentum — RSI drops fast but price drops slowly.
If price rises, RSI shows low momentum — RSI rises slowly but price rises fast.
For example, at first RSI is above 50.
Price drops from (a) to (b) by 44 units, RSI drops from (Ra) to (Rb) by 25 units.
Later, RSI drops from (Rb) to (Rc) (also 25 units) but price drops from (b) to (c) by 73 units.
When RSI < 50:
If price falls, RSI has low momentum — RSI drops slowly but price falls fast.
If price rises, RSI has high momentum — RSI rises fast but price rises slowly.
RSI and Price Divergence
Divergence happens when price and RSI move in opposite directions:
Price goes up but RSI goes down, or vice versa.
Why does divergence happen?
In a strong downtrend, price forms a bottom at point (1), and RSI drops to level (r1).
When a price pullback happens, price pushes up to a peak at point (2), and RSI also bounces back to level (r2).
Because the downtrend is strong, after completing the pullback (1-2), price continues to make a lower bottom at point (3).
At this point, remember the behavior of RSI momentum when RSI is below 50:
It takes a large price drop (from 2 to 3) to cause a small RSI drop (from r2 to r3).
Meanwhile, even a small price increase (from 1 to 2) causes a large RSI rise (from r1 to r2).
Since the distance (1-2) is smaller than (2-3), but the RSI move (r1-r2) is bigger than (r2-r3), divergence is created.
Divergence shows that the current trend is very strong, not a complete signal of a trend reversal.
(I might share with you how to spot a complete RSI reversal signal in future posts.)
As shown in the example above, after forming bottom (5) and creating a bullish divergence between (3-5) and (r3-r5), price still kept dropping sharply while RSI kept rising.
In these areas, if you keep trying to catch a reversal just based on divergence, you will likely need to DCA or cut your losses many times.
That’s why the most important thing in trading is always to follow the trend.
RSI Exhaustion
RSI Exhaustion happens when RSI keeps getting rejected by a resistance or support zone and can’t break through.
After a strong downtrend, RSI recovers but stalls around the 5x zone.
It tries many times but fails, showing buying power is weakening.
Then the downtrend continues:
Exhaustion near high or low RSI levels creates stronger divergences than exhaustion in the middle range:
Double or triple tops/bottoms on RSI (M or W shapes) basically indicate RSI exhaustion.
RSI Can Identify Trend Strength
In an uptrend:
If RSI pulls back to a higher level before going up again, the trend is stronger.
The pullback should not fall too deep (below 40).
Example:
First rally: RSI drops to 60 before rising again → strong rally (273 units).
Second rally: RSI drops to 50 before rising again → weaker rally (94 units).
Same idea for a downtrend:
If RSI pullbacks to 50 then drops again, the downtrend is stronger than if it pullbacks to 60.
RSI Support and Resistance
Besides 40-60 acting as support/resistance, RSI also reacts to old tops and bottoms it created.
Why does this happen?
RSI is calculated from closing prices.
On a higher timeframe, the candle close price is a high/low or support/resistance price on lower timeframes.
When RSI moves in a trend on a higher timeframe, it maintains a buy/sell ratio, forcing lower timeframe RSI to oscillate within a range.
Example:
On H4, RSI stays above 40 → uptrend.
It makes H1 RSI move between 30-80.
Sharp RSI tops/bottoms react even stronger because they show strong buying/selling forces.
Summary
When looking at the price chart, we can see that price can rise or fall freely without any defined boundaries.
However, RSI operates differently: it always moves within a fixed range from 0 to 100.
During its movement, RSI forms specific patterns that reflect the behavior of price.
Because RSI has a clear boundary, identifying its characteristics and rules becomes easier compared to analyzing pure price action.
By studying RSI patterns, we can make better assumptions and predict future price trends with higher accuracy.
I have shared with you the core characteristics of RSI, summarized as follows:
Besides overbought (80) and oversold (20), RSI respects 40 and 60.
40 is support level in an uptrend. 60 is resistance level in a downtrend.
In an uptrend, RSI stays above 40.
In a downtrend, RSI stays below 60.
An RSI Range-Shift leads to a trend change.
RSI Divergence shows strong trends.
Double or triple tops/bottoms show RSI exhaustion → potential reversals.
The higher the RSI level, the slower it moves, but the faster the price rises.
The lower the RSI level, the slower it moves, but the faster the price falls.
A strong uptrend can be identified when RSI moves within a higher range or shows continuous bearish divergences.
A strong downtrend can be identified when RSI moves within a lower range or shows continuous bullish divergences.
RSI reacts to its old tops and bottoms.
Sharper RSI peaks show stronger selling.
Sharper RSI bottoms show stronger buying.
In the next parts, I’ll show you how to apply these RSI's Characteristics to trend analysis, multi-timeframe analysis, and trading strategies, that you might have never seen before.
I trade purely with RSI. Follow me for deep dives into RSI-based technical analysis and discussions!

Gold fluctuates and adjusts at a high level!Gold opened lower and bottomed out and rebounded without breaking the 3245 line. Today's trend tends to fall back and adjust. Intraday trading can be kept high and low! Today, we will focus on the previous high-altitude suppression. Below, we will focus on whether it can effectively stabilize at 3200-3190. If it stabilizes, we will continue to look at the integer 3300 mark for long positions. The overall bulls are still strong, but gold fluctuates greatly during the day. If the position ratio is not done well, both long and short positions are easily damaged. Therefore, in recent transactions, we mainly focus on the area and position control ratio, and strictly stop losses in the short term during the day. On the whole, today's short-term operation strategy for gold is mainly to do more on pullbacks and short on rebounds. The short-term focus on the upper resistance of 3240-3245 is 3240-3245, and the short-term focus on the lower support of 3210-3187 is 3210-3187.
Short order strategy: Short in batches near the rebound of 3240-3243, stop loss of 6 points, target near 3210-3200, break to see the 3190 line;
Long order strategy: Long in batches near the pullback of 3187-3190, stop loss of 6 points, target near 3215-3235, break to see the 3245 line;

XAUUSD Today's strategyYesterday, the market trend on the trading chart continued to decline. However, it did not set a new low compared to the previous low point. Instead, the lows gradually showed an upward trend. Today, the crucial price level of 3,025 US dollars requires our close attention. Once it is successfully broken through, the market will continue to make an upward assault on the range between 3,045 and 3,055 US dollars. Overall, the current market is mainly characterized by a washout and sideways movement, and it is still too early for the price to reach its peak. Given the continuous impact of the trade conflicts, this will serve as a powerful factor driving the price of gold to new heights rather than causing the price of gold to collapse.
In particular, we must keep a close eye on the breakthrough of the 3,025 US dollars level. After this price level is broken through, we should focus on the pullback and confirmation movement. If the pullback does not break below this level, we can set the area below 2,980 US dollars as the stop-loss line. Under this premise, we can consider entering the market to go long, with the target set at the range between 3,040 and 3,045 US dollars, so as to capture the profit opportunities brought about by the rebound.

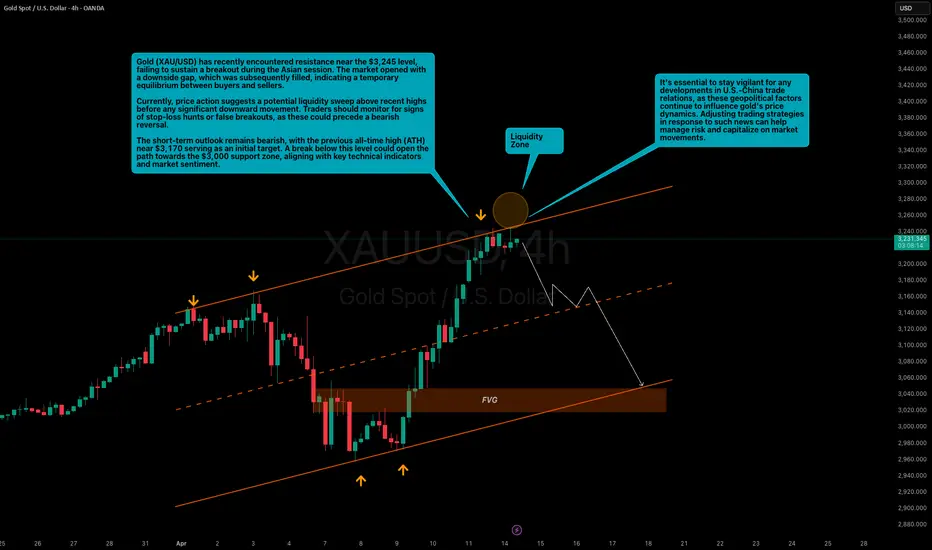
Resistance Holds at $3,245; Bearish Targets in FocusGold (XAU/USD) has recently encountered resistance near the $3,245 level, failing to sustain a breakout during the Asian session. The market opened with a downside gap, which was subsequently filled, indicating a temporary equilibrium between buyers and sellers.
Currently, price action suggests a potential liquidity sweep above recent highs before any significant downward movement. Traders should monitor for signs of stop-loss hunts or false breakouts, as these could precede a bearish reversal.
The short-term outlook remains bearish, with the previous all-time high (ATH) near $3,170 serving as an initial target. A break below this level could open the path towards the $3,000 FVG as well as support zone, aligning with key technical indicators and market sentiment.
It's essential to stay vigilant for any developments in U.S.-China trade relations, as these geopolitical factors continue to influence gold's price dynamics. Adjusting trading strategies in response to such news can help manage risk and capitalize on market movements.
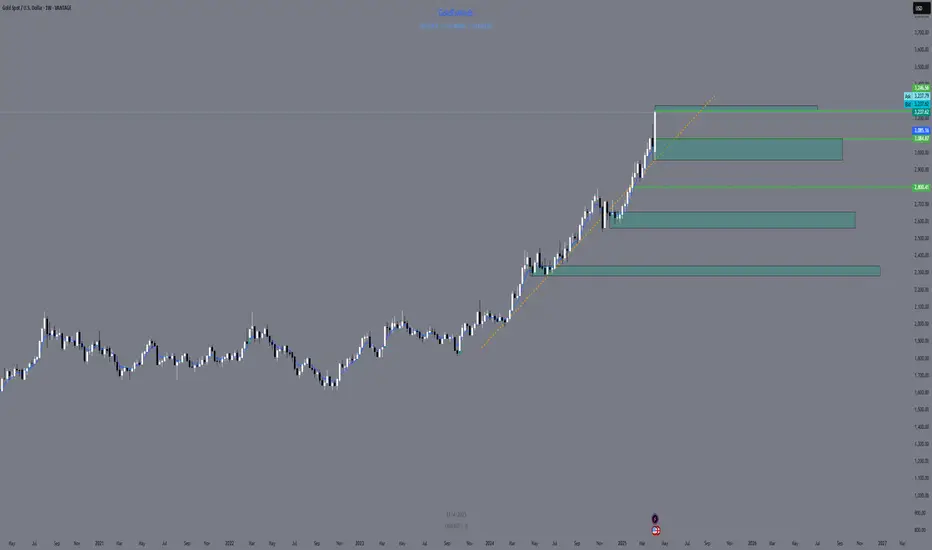
Weekly Outlook – XAUUSD Key Levels Map🟩 Weekly Outlook – XAUUSD Key Levels Map
📍 Premium Supply Zone:
‣ 3246 – 3275 → Price currently testing this premium area; potential reaction zone.
📍 Wick High / Liquidity:
‣ 3246.07 → Weekly wick = clear liquidity, useful for sweep/rejection monitoring.
📍 Weekly FVG (Fair Value Gap):
‣ 3085.16 → First key imbalance zone below current price, valid draw for bearish correction.
📍 Equilibrium Zone (Macro Weekly):
‣ ~2800 → Midpoint between recent major swing low and swing high = macro balance area.
📍 Origin of Macro CHoCH:
‣ 2372.54 → Anchored zone for deeper corrections; institutional footprint from structural shift.
Gold's Next Move?This analysis examines Gold’s current price action in the context of cyclical projections. As price appears poised to close above a key resistance level, two scenarios come into focus: a continued rally toward the weekly cyclical target, or a short-term pullback to retest the resistance level as support. A successful retest followed by new highs would likely confirm a bullish continuation near term.

GOLD short-term analysis and buying planThe key guidance for gold's trend this week is undoubtedly focused on every subtle change in the tariff news.
In this market, the influence of a tariff news is so great that all previous technical-based analysis and forecasts are instantly invalid. Looking back at the recent market, we can clearly see that in just three days, the price of gold first fell sharply by $211, and then rebounded rapidly, soaring by $275 in three days. Such drastic and frequent price fluctuations are almost entirely driven by various news, which once again highlights the decisive role of news in the current gold market.
From a purely technical analysis perspective, the strong performance of the weekly surge clearly shows that the current market structure is controlled by the bulls. It is worth noting that in the past month or so, the Asian market has formed a unique opening must rise rule. In-depth details of the market, we can find that the low point of gold in the US market, 3220-3215, has become a key watershed between the strength of longs and shorts. When the price runs above this area, the market shows obvious strong characteristics; once the price falls below this area, the market is very likely to turn to a weak pattern.
Similarly, the Asian session retracement low point of 3185-3190 area also constitutes an important dividing line between long and short positions. If the price remains above this area, the bulls will dominate; if it unfortunately falls below, the market is likely to quickly switch to the short mode, and even trigger a rapid plunge. For the upper long target, there is still great uncertainty. Investors can focus on the new high breakthrough in the 3245-3250 area, followed by the 3265-3260 area and the psychologically important $3,300 mark.
As the tariff war continues to deepen, the market generally expects that in the next 1-2 weeks, the gold market will usher in more crazy fluctuations, and its rise and fall is expected to set a new record. We need to be vigilant at all times and respond cautiously to market changes.
Key points:
First support: 3210, second support: 3202, third support: 3192
First resistance: 3246, second resistance: 3263, third resistance: 3300
Operation ideas:
Short-term gold 3206-3209 long, stop loss 3198, target 3240-3250;
Short-term gold 3260-3263 short, stop loss 3272, target 3220-3210;

Gold may break support level and continue to decline nextHello traders, I want share with you my opinion about Gold. The price started to grow from the buyer zone between 2885–2905 points, forming a clean bullish impulse and entering a broadening wedge structure. During the uptrend, Gold made several rebounds from the support line and broke above the current support level at 3070, which later became a key point in the price structure. After reaching the resistance line of the wedge, the price turned around and began a downward correction. The decline brought it back into the support area between 3087–3070 points, but this zone has already failed to hold the momentum. Currently, XAU is trading below the upper boundary of the support area and showing clear signs of weakness. The breakout to the downside from the wedge structure has already taken place, and the price is starting to form a local pullback. I expect this pullback to be short-lived, followed by a continuation of the downward movement. My target for this move is the 2990 level, which aligns with the support line of the broadening wedge and serves as the next strong reaction zone. Given the failed rebound from resistance, the breakdown of the support area, and the structure of the broadening wedge, I remain bearish and expect Gold to continue declining toward TP 1 — 2990 level. Please share this idea with your friends and click Boost 🚀

Gold roller coaster market is in a state of chaos!There are also signs of bottoming out at the 4-hour level. Bollinger has also closed temporarily, forming a head and shoulders bottom pattern at 2955 and 2970. Today, we will focus on the gains and losses of the double top at 3055, and then see whether it can form a unilateral surge. If the European session cannot break through 3055, you can go short in the 3050-3052 area below 3055. For gold today, it is still viewed as a shock. The rebound stabilizes above 3000, and the European session may continue. The support below is at the 3000 mark, and the pressure above is 3052-3055, with strong pressure at the 3055 line. If the European market still fluctuates sideways and has no performance like yesterday, then beware of repeating yesterday's trend and turning downward.
Today's short-term gold operation ideas suggest that callbacks should be the main focus, and rebound shorts should be supplemented. The upper short-term focus is on the 3035-3045 first-line resistance, and the lower short-term focus is on the 2975-2970 first-line support.
Short position strategy:
Strategy 1: Short 20% of the position in batches when gold rebounds to around 3050-3052, stop loss 6 points, target around 3030-3010, and look at the 3000 line if it breaks;
Long position strategy:
Strategy 2: Long 20% of the position in batches when gold falls back to around 2998-3000, stop loss 6 points, target around 3025-3040, and look at the 3050 line if it breaks;

Gold's safe-haven demand surgesThis week, concerns over a global economic slowdown have swept across Wall Street, becoming the dominant market sentiment. In this context, U.S. President Trump's erratic messaging on tariff policies has triggered a panic sell-off in U.S. stocks, bonds, and the dollar, highlighting gold's position as a safe-haven asset. Gold prices have surged sharply, breaking through all previous resistance levels and maintaining an upward trend. Given the ongoing risk-off sentiment, the bullish momentum in gold remains strong, and the market may continue to trend higher in the near term.
In this market environment, it is recommended that investors take long positions near $3220 and consider taking profits around $3230 to fully capitalize on the current uptrend in gold. For additional trading signals, Please stay tuned.

It is hard not to make a profit by trading CPI like thisI have to say that gold is indeed in a bullish pattern at present. After all, gold did not even fall below 3110 during the correction process. However, the current fluctuations are relatively cautious, and we are waiting for the guidance of CPI data, which may exacerbate short-term fluctuations!
To be honest, although gold is in a bullish pattern, the resistance above cannot be ignored, especially the 3150-3155 area and the previous high of 3167. It is not ruled out that gold will form a secondary high during the rise and form a double-top structure with the previous high of 3167, so I will not be a radical in the short term and set the target at 3200.
In addition, during the CPI data period, it is not ruled out that gold will rise and then fall back, so I do not advocate blindly chasing gold. On the contrary, I will definitely try to short gold in the 3050-3060 area. However, the market's long sentiment is high, and it is not advisable to have too high expectations for the magnitude of the correction in short-term trading. The first retracement target area is: 3105-3095, followed by 3080!


Gold (XAU/USD) Bullish Breakout Trade Setup – Targeting 3,130Chart Analysis
Trend & Structure
CHoCH (Change of Character): Marked on the chart, indicating a potential trend reversal from bearish to bullish.
The price has broken above a descending trendline and is forming higher highs and higher lows, supporting a bullish bias.
EMAs
EMA 30 (red) and EMA 200 (blue):
EMA 30 has crossed above EMA 200, which is often considered a bullish signal.
The price is currently trading above both EMAs, reinforcing the upward momentum.
---
Trade Setup
Entry Zone
The purple highlighted area between ~3,026 and 3,035, acting as a potential demand zone (previous

Waiting for the right Gold setupWe need to watch how gold handles the 3137 level, which is acting as strong resistance. At the moment, it’s neither a buy nor a sell.
For a buy, the upside is too low—the risk-reward ratio isn’t great. For a sell, there’s no confirmation for a short yet.
On both the daily and weekly charts, there’s still no confirmation for either a long or a short. So for now, we observe and wait for a potential setup to form.
If you didn’t participate in this rally, don’t get hung up on it! There have always been and will always be new opportunities to make money in the market. The key is to stick to your plan, look for the best and safest setups—those with high upside and low risk. Learn to wait for your trades. There are days and even weeks when it’s better not to trade. But then, boom—your clear and solid setup appears, and you make money on it.


GOLD ( XAU/USD) likely to move up from here Take this with a grain of salt. I am no expert, and this is not financial advice.
Technical Analysis (TA):
As we look at the hourly (1hr) timeframe, we can see a strong upward movement followed by a temporary consolidation creating a bullish pennant pattern suggesting a trend continuation. A conservative target puts us at around $3,350 per troy ounce of gold, but we could go as high as $3,494.63 to be exact.
Fundamentals Analysis (FA):
Macroeconomic Uncertainty: I can go into great detail about what is happening, but I would be writing an essay the size of 10 pages, and I don't want to do that now, so here is a quick and simple overview:
Tarrif War between the United States of America and China (as well as other countries) could lead to economic slow downs as well as poor revenue's for companies.
Start-ups are dead. As of today, there has been an alarming rate of start-ups which has been failing and unable to secure funding, and yes I am aware start ups fail all the time and funding dries up, just at the current rate it is scary how many are actively failing where a year back they were alive and well with bright futures and investment potential, investors are running to safe havens such as GOLD to keep their funds safe.
Central banks are expected to pause or even cut rates, which is typically bullish for gold, as lower rates reduce the opportunity cost of holding non-yielding assets.
Geopolitical Tensions: War War War :(
