XAUUSD.P trade ideas
XAUUSD Analysis todayHello traders, this is a complete multiple timeframe analysis of this pair. We see could find significant trading opportunities as per analysis upon price action confirmation we may take this trade. Smash the like button if you find value in this analysis and drop a comment if you have any questions or let me know which pair to cover in my next analysis.
Gold is about to test the 3000 supportGold is about to test the 3000 support
From the current market, gold continued to fall on Friday and encountered a large amount of selling. It has now hit a low of 3016.
Source:
The non-agricultural data of the US market will be released tonight, which is obviously bearish, and the gold price has fallen from a high level.
At present: the weekly moving average of gold price is suppressed and blocked. After testing the resistance, a short-term long-short reversal is formed, and it retreats and breaks the intraday low.
From the overall trend: there is no doubt that the weak pattern of gold is reasonable. It is reasonable to continue to be under pressure and fall.
Current pressure: 3050-3055 area, continue to look up to 3060-3070 area,
Current support: 3000 mark, there will be a rebound above, and a new round of downward space will be opened below.
Upper resistance: focus on 3055 first, and then focus on 3068.
If the bulls break through strongly, the gold price is expected to return to 3080.
Of course, the possibility of a short-term rise is not great. After all, in the strong and repeated trend, the double top structure formed by 3135 and 3080 has been confirmed.
It is expected to continue to break through next week and test the 3000 integer mark.
Overall:
Gold short-term operation ideas:
Short-term focus on the upper side: 3050-3055 resistance
Short-term focus on the lower side: 3000-3015 support.
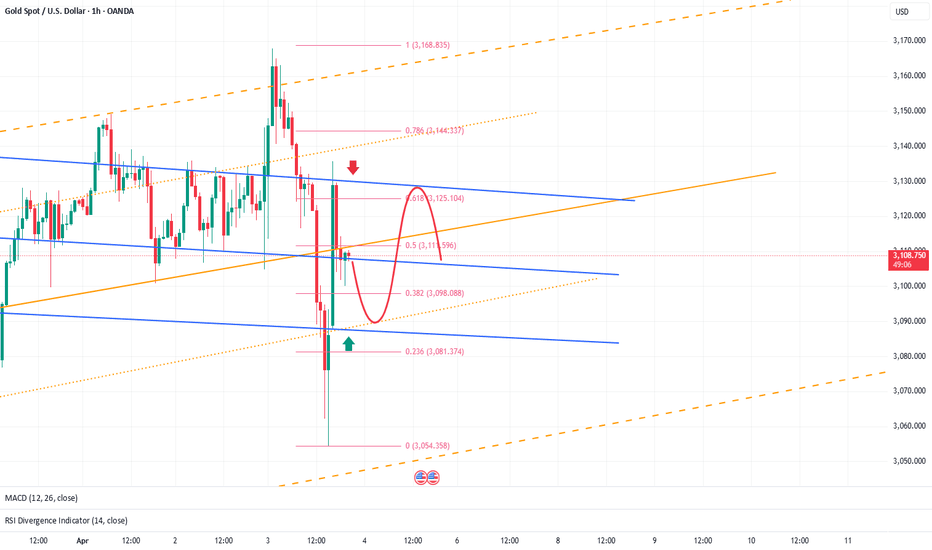
XAUUSD: Buy or Sell?Today's gold market can be said to have the largest intraday volatility since 2025! After experiencing violent fluctuations, the current trend of gold has once again become anxious.
However, from the perspective of range conversion, it is certain that gold is currently operating in a weak position, and after the brutal and violent fluctuations, the market also needs to recuperate. And there will be NFP tomorrow. It is expected that before NFP, it will be difficult for gold to form a new unilateral market again. So in the process of shock, I think both long and short sides have a certain profit space.
First of all, pay attention to the resistance of 3125-3135 area on the top. If gold touches this area during the shock process, we can still short gold;
And the first focus on the 3095-3085 area on the bottom is that if gold touches this area during the shock process, we can still consider going long on gold.
The trading strategy verification accuracy rate is more than 90%; one step ahead, exclusive access to trading strategies and real-time trading settings
Gold-----Buy near 3140, target 3160-3180Gold market analysis:
The international situation is very unstable, the situation in the Middle East, the situation in Russia and Ukraine, plus Trump's trade war, it is difficult for gold to show a weekly decline. The tariffs were released again last night, causing gold to rise strongly. Today's thinking is undoubtedly to continue to be bullish. Today we will first look for structural support to go long. There was a decline in the Asian session, and the daily moving average began to rise. Today, it will be repaired first and then pulled up.
In terms of gold pattern, 3134 is the strong pattern support in the Asian session, and the small support is around 3140. Bulls will play at this position. We estimate that there will be a few pulls in the Asian session today. The range of getting on the train is around 3134-3140. The strong support has reached around 3110. If this position is not broken, it is basically difficult to change the buying trend during the day. In addition, tomorrow is the non-agricultural data, and we estimate that such buying will reach the non-agricultural data.
Support 3134-3140, strong support 3120 and 3110, strong pressure is invisible, small pressure today's high point, the strength and weakness watershed of the market is 3134.
Operation suggestion:
Gold-----Buy near 3140, target 3160-3180
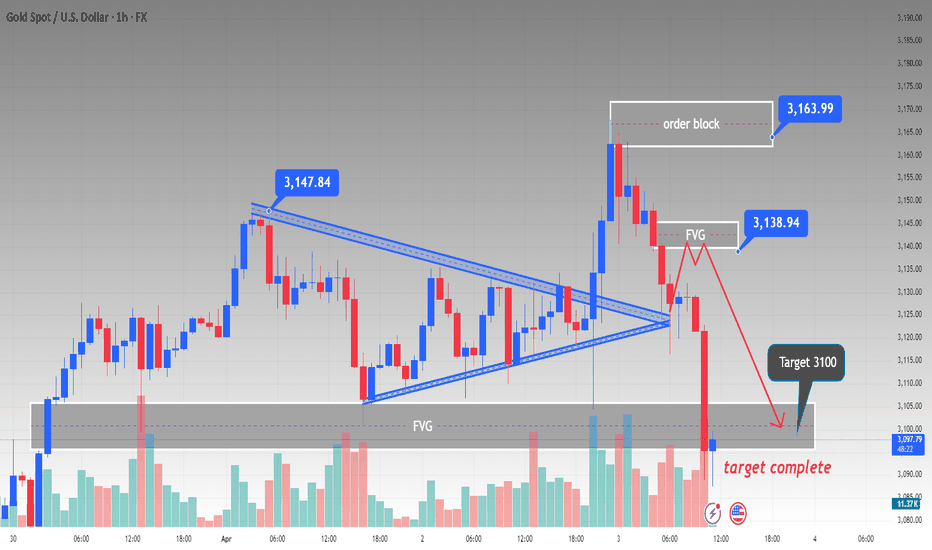
XAUUSD SELL TARGET SUCCESSFUL HITTING READ IN CAPTIONSThis chart shows Gold (XAU/USD) on a 1-hour timeframe, with various key technical levels identified, including order blocks, FVG (Fair Value Gap), and target zones. Here's an analysis based on the chart:
Key Observations:
1. Price Action:
- The price of Gold has been moving in an ascending triangle pattern (denoted by the blue trendlines). Ascending triangles are typically bullish continuation patterns, where the price makes higher lows while encountering resistance at the top. In this case, the price is pushing upwards but facing resistance at around 3,147.84.
- The price recently tested the FVG gap near 3,138.94, suggesting that the market might be filling an imbalance before continuing its movement.
2. FVG (Fair Value Gap):
- The FVG identified between 3,138.94 and 3,147.84 represents an area where the price imbalance exists. In many cases, the market tends to revisit this gap to "fill" it before continuing its direction. The price has already started filling the gap, and traders often look for reversals in these areas.
3. Order Block:- The order block located around 3,163.99 indicates a zone of heavy selling pressure or institutional activity. This is an area where price previously faced rejection, making it a potential resistance zone. It might play a significant role if the price tries to move upward again.
4. Downward Move & Target:
- After filling the FVG, the price has made a sharp downward movement, indicating that the bearish pressure has taken over. The target for this move is set at 3,100, which could be the next area of support. If the price continues its downward trajectory, it may eventually test this target area.
- The target completion at 3,100 was reached, showing a strong bearish reaction after filling the gap.
5. Volume Analysis:
- The volume bars indicate increased selling volume during the downward movement, especially around the time the price hit the FVG gap. This suggests that the market is more willing to sell after filling the gap, signaling strong selling interest.
Potential Scenarios:
1. Bearish Continuation:
"Gold (XAU/USD) Resistance & Support Analysis"This chart represents an analysis of Gold (XAU/USD) price action, focusing on key resistance and support levels. The resistance zone is identified at approximately 3,136.62, where price action has previously struggled to break higher. Meanwhile, the support zone is marked around 3,100.95, acting as a potential area where buyers may step in to prevent further declines.
The chart suggests a potential rejection at the resistance level, leading to a price decline toward the support zone. The projected movement involves price testing the resistance level, forming a possible consolidation or double-top pattern before initiating a downward trend. This scenario aligns with a bearish outlook, where traders may seek confirmation signals, such as bearish candlestick patterns or momentum indicators, before considering short positions.
However, if price action breaks above the resistance level with strong momentum, the bearish outlook may be invalidated, potentially signaling a continuation of the bullish trend. Traders should apply proper risk management strategies, including stop-loss placement above resistance, to mitigate potential losses.
Overall, this technical setup provides a structured approach to analyzing gold price movements, offering traders insights into possible market behavior based on historical price action.
GOLD - 1H UPDATEThere are 2 options on how I think Gold will complete its ‘Ending Diagonal’ pattern of the EW Theory & drop.
Option 1: We see a move higher towards $3,162 - $3,174 as a final LQ grab, before sellers kick in.
Option 2: Sellers kick in from CMP & slowly drag price back down.
Either way, I’m NOT LOOKING TO SELL until a strong confirmation at $3,057.
Gold H1 | Potential bullish bounceGold (XAU/USD) is falling towards a pullback support and could potentially bounce off this level to climb higher.
Buy entry is at 3,113.30 which is a pullback support that aligns with the 23.6% Fibonacci retracement.
Stop loss is at 3,087.00 which is a level that lies underneath a pullback support and the 38.2% Fibonacci retracement.
Take profit is at 3,161.57 which is a level that aligns with the 100.0% Fibonacci projection.
High Risk Investment Warning
Trading Forex/CFDs on margin carries a high level of risk and may not be suitable for all investors. Leverage can work against you.
Stratos Markets Limited (www.fxcm.com):
CFDs are complex instruments and come with a high risk of losing money rapidly due to leverage. 63% of retail investor accounts lose money when trading CFDs with this provider. You should consider whether you understand how CFDs work and whether you can afford to take the high risk of losing your money.
Stratos Europe Ltd (www.fxcm.com):
CFDs are complex instruments and come with a high risk of losing money rapidly due to leverage. 63% of retail investor accounts lose money when trading CFDs with this provider. You should consider whether you understand how CFDs work and whether you can afford to take the high risk of losing your money.
Stratos Trading Pty. Limited (www.fxcm.com):
Trading FX/CFDs carries significant risks. FXCM AU (AFSL 309763), please read the Financial Services Guide, Product Disclosure Statement, Target Market Determination and Terms of Business at www.fxcm.com
Stratos Global LLC (www.fxcm.com):
Losses can exceed deposits.
Please be advised that the information presented on TradingView is provided to FXCM (‘Company’, ‘we’) by a third-party provider (‘TFA Global Pte Ltd’). Please be reminded that you are solely responsible for the trading decisions on your account. There is a very high degree of risk involved in trading. Any information and/or content is intended entirely for research, educational and informational purposes only and does not constitute investment or consultation advice or investment strategy. The information is not tailored to the investment needs of any specific person and therefore does not involve a consideration of any of the investment objectives, financial situation or needs of any viewer that may receive it. Kindly also note that past performance is not a reliable indicator of future results. Actual results may differ materially from those anticipated in forward-looking or past performance statements. We assume no liability as to the accuracy or completeness of any of the information and/or content provided herein and the Company cannot be held responsible for any omission, mistake nor for any loss or damage including without limitation to any loss of profit which may arise from reliance on any information supplied by TFA Global Pte Ltd.
The speaker(s) is neither an employee, agent nor representative of FXCM and is therefore acting independently. The opinions given are their own, constitute general market commentary, and do not constitute the opinion or advice of FXCM or any form of personal or investment advice. FXCM neither endorses nor guarantees offerings of third-party speakers, nor is FXCM responsible for the content, veracity or opinions of third-party speakers, presenters or participants.
GOLD: What to do if you Hold a Short position?Gold is rebounding. Pay attention to the resistance above 3020. At present, we can see obvious selling pressure on the 2H chart. MACD has formed a divergence. 2H is a larger period. Its form is short, which means that tomorrow or the day after tomorrow, the market will fall sharply.
In addition, the divergence of MACD is sometimes repaired by shock market. This situation is not uncommon, so when trading, we need to focus on the support.
Judging from the current candlestick chart arrangement, there is support near 3100, followed by the 3096-3088 range. If a larger divergence pattern is to be formed, the price may reach the 3036-3048 range. At that time, there is no need to hesitate too much, just sell it.
sell at 3125 and buy at 3090 goldafter buying gold in my previous analysis and hiting TP,i sold gold in 2 steps 3120-3125 and i will hold them until TP hit...after that i will buy gold for catching wave 5 of 5 of 5!!!so trade wid SL and do money management guys...now sell and then buy....sell at 3120-3130 and buy at 3085-3075 prices in two steps...u will make profit guys
Stay Focus. Gold Hits New Highs: Monthly Close Gains Momentum.The early-session pullback turned out to be another "dip for buying" opportunity in gold's new uptrend. After retreating to a low of 3076, prices broke to new highs again, reaching an exaggerated level of 3112 as of now. The market's long-awaited dream of gold reaching 1000 is now within reach.
Given such a frenzied market right at the week's open, should traders aggressively chase the rally or short it?
First, the daily chart shows three consecutive bullish candles, clearly indicating a strong uptrend. If today's rally holds firmly above 3100, there is still room for further gains—otherwise, the opposite may occur.
On the hourly chart, the morning pullback low serves as today's key support level. If prices retreat again
Buy on dips between 3090-3100, stop loss at 3085, target 3120-3130 (upper resistance not predicted for now).
"Gold (XAU/USD) Approaching 3,110 – Sell Setup in Play?"The price is in an uptrend, making higher highs and higher lows.
A potential reversal zone is identified around $3,110, marked as a possible sell entry.
The chart suggests that after reaching $3,110, the price may decline towards the support zone at $3,010 - $2,999.
Confirmation of the sell trade can be considered if price action forms a bearish structure around resistance.
Key support levels are at $3,010, $2,999, and $2,981, which could act as potential take profit targets for short positions.
Trading Strategy:
Sell Entry: Around $3,110, if resistance holds.
Target: $3,010 - $2,999 zone.
Stop Loss: Above $3,120 to manage risk.
This idea follows technical price action, making it crucial to watch for confirmation signals before executing a trade. 🚀📉
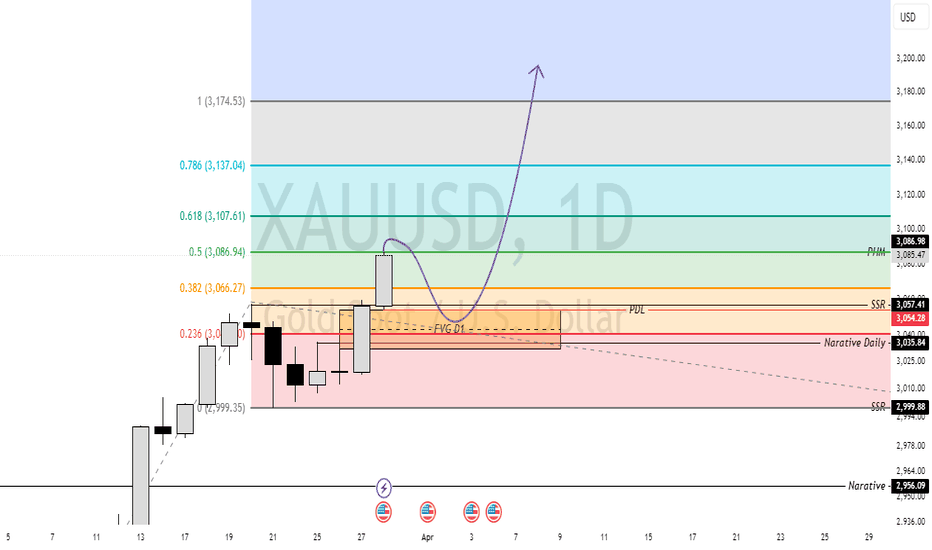
XAUUSD 31-03-2025🚨 This is just an opinion.
We expect prices to open higher during the Asian session. For now, focus on the liquidity sweet spot around ~3086. After that, a downward trend is likely towards the 1-hour Fair Value Gap (FVG) between 3055 and 3062. Keep in mind that during crucial moments, a liquidity sweet spot must form, and the price should also break through Sell-Side Liquidity (SSL).


