BTCUSD 15 MIN BEARISH RSI DIVERSION Btcusd 15 min bearish RSI diversion
2 tgt are pending down side
1 tgt done 50% quantity
2 tgt all quantity exit
Lets see what's happened in market
XBTUSDT.P trade ideas

BTCUSDT (11/10/24) I Bet Bottoming HereBINANCE:BTCUSDT
BTCUSDT is set to pump in the coming months.
I'm willing to bet that the bottom already occurred yesterday.
Reasons:
There is a SMT with ETH.
It's entering the OB (Order Block) zone.
Liquidity is tight above, with the closest level at 66,705.
It's also a good time to look for interesting altcoins.
To be honest, the analysis is still on track (just missed the sniper entry, lol).
Additional reasons:
Many telegram airdrops and token listings on October 31st.
NFA
DYOR

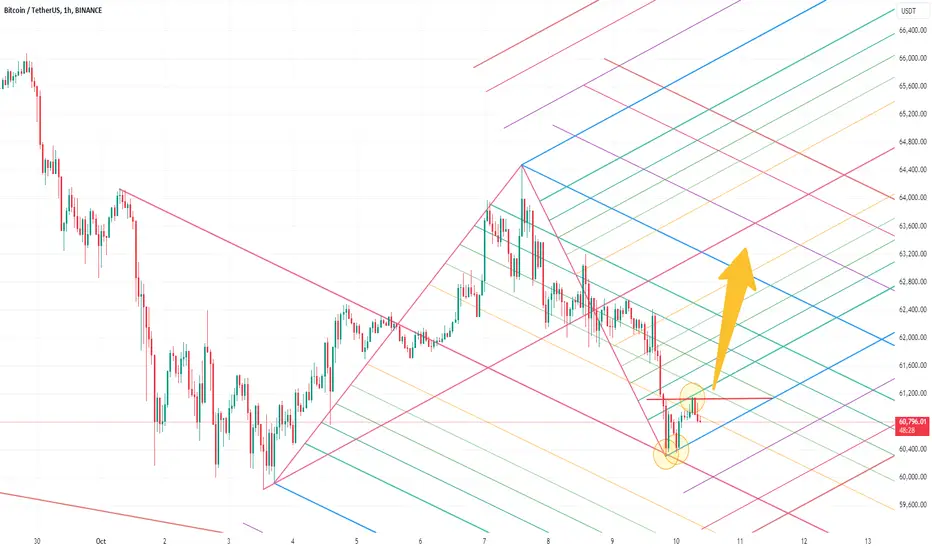
#Bitcoin Update – Friday, 11.10.2024As-salamu alaykum and Good Morning to All Brothers and Sisters!
#Bitcoin has finally reached our daily retracement level (Arrow #6) and the key level of 59,191, just as predicted in my previous analysis. This is a crucial point for the market, and now we must see what happens next.
**What's Next?**
At this point, there’s a strong chance that Bitcoin could reverse and change its trend. We’ve already broken through the first resistance on the 4-hour timeframe (marked by the blue trendlines), which is a promising signal for a reversal. However, it’s still early to celebrate, as we need the price to retest and break through the second resistance. If everything unfolds as expected, we could soon see the price breaking through the yellow area, indicating a shift towards a bullish trend.
**Bearish Scenario**
The bearish scenario is quite straightforward: if the price reverses after touching the blue lines, it will confirm the bearish trend. In that case, we would be looking for a break below the black line (Arrow #6). The worst-case scenario would be if the price also breaks below the 59,191 level, which would signal the start of a deeper downtrend. This is the critical point where caution is key.
**#Alts (Altcoins)**
With Bitcoin touching the yellow area, several of our altcoin trades have unfortunately hit their stop-losses. However, many trades are still valid, and we’re patiently waiting for the market to stabilize. Once Bitcoin confirms the breakout of the first resistance, I will resume updating the signal list with new trade opportunities. Insha'Allah, we will be ready to seize the moment when the market turns in our favor.
Stay positive, stay focused, and keep an eye on the charts. I wish you all a profitable and successful week ahead!
Have a great day and stay tuned for more updates!

BTC Trading setups to be forming!There are a couple of setups to be developed.
Current trend indicating potential long setup to first "line" or even short zone. Waiting for nice candle to confirm the idea.
And from the line or short zone obviously sell setup. Waiting for a Bearish HTF closure. INVALIDATION = If we print strong bullish HTF candle, then I will let long setup ride.
Will take partials/manage my position around the trouble area as we can get another long setup.
The ideal scenario is we go from the short zone all the way down to the lows, that's my perfect play but there are many setups for me in this "range". Trade safe!

BTC/USDT 1D chart reviewHello everyone, let's look at the current BTC situation considering the one-day interval. In this situation, we can see the price rebounding from the resistance, but we are still above the upward trend line.
Let's start by setting goals for the near future, which include:
T1 = $67,494
T2 = $69,814
T3 = $72,930
Now let's move on to the stop-loss in case the market continues to decline:
SL1 = $64,918.
SL2 = $63,212.
SL3 = $61,933.
SL4 = $60,228

Bitcoin Cry LevelWe've wicked up to 64.4k region and faced a strong rejection at wVWAP/wPOC
Immediate resistance remains at 62.8k
The nearest support level is at 59k coincides with yVWAP and previous Monthly Open
It's a critical level to hold, a breakdown of 59k might lead us back below the equilibrium of this multi-month range

13% profit 30% in total, bitcoin might do a new higher high Recap: first off all congratulations to everyone who followed my signals, we are on our second trade the first one made more than 16% profit and the second since September 1st made more than 13% and still going strong
Since September 1st I've guided my followers through entry and exit points and thanks to my perfect entry the last panic sale didn't put us in the red even thought I've pleaded every trader to buy Bitcoin and that it will at least go above 65858$ and I've been trolled for saying that now the joke's on you
Bitcoin will continue it's uptred and might do a new higher high

BTC BIG PICTURE One of the lagre picture that I am following in the coming months. Everyone expects 100k, which is possible because you see targets 1 and 1,618, but since the first wave was impulsive, I don't believe it will have a big extension.
Targets 74k and 95k until the price tells me otherwise. As for the smaller tf, I will comment below
First look at the smaller time frame , I expect price to make 3-3-3-3-3 and confirm the final diagonal.
Another view is that this move has already started its third impulsive wave. Disability zones 62k-63k where I will know which side it will go after price test those levels

BTCUSDT BULLSIH FLAG PATTERN BTCUSD weekly chart shows a bullish flag was formed and the price did not close below the 50 EMA .price formed a weekly candle with long wick and managed to close inside the channel and above 50 EMA which indicate that a strong bullish momentum was started followed by the bearish indecision candle due to market fear and greed's and uncertainty but its low was not below the 50% of the previous week. The the next weekly candle was showing strong bullish momentum again but the price is still below the POC and upper channel trend line and MFI is below the 50 level.
If the price closes above 64628 and able to continue that for next seven days and as long as monthly MFI is above 50 level we will have a monthly bullish candle as a confluence.
On a weekly chart , if the price manages to break up above the POC and the channel while MFI is above the 50 level then the uptrend will continues strongly . 21/50/100/200 EMA's shows that the bullish momentum is increasing .
Upper Fib extension levels can be used as price target after breakout .
Invalid On Chart
Good LUck

Bitcoin Set for Big Breakout: Uptrend Confirmed!Bitcoin (BTCUSDT) is currently trading within a long-term falling wedge pattern, a common consolidation signal before a major breakout. The market structure remains positive, despite BTC experiencing short-term corrections. However, if you look closely at recent price action, you will see that the downtrend is weakening, and buying pressure is increasing as BTC approaches key support levels.
Macro factors such as increased institutional participation and clearer crypto regulations have created momentum for a potential rally. If BTC breaks above key resistance, we could see the return of large buyers, pushing the price higher.
In my view, and when this happens, we could see BTC break out strongly towards the next resistance levels. The rally could extend to $66,528 and even higher if the market momentum continues. Recommend buying strategy at key support zones, with medium term targets at TP1 and TP2.

BTCUSDTBTC is currently trading at the recistance zone.
Is it going to break it, or already time to short (again)?
Let's wait for confirmation..

BTCUSDT : We are still bullish - and it’s time to loot sellers Stay tuned and for sellers: God bless you
Short term you can try your full leverage - wait for 65700-65500 to long with SL of 65400 & TP 67200 . Thanks me later .

Bitcoin hedge short oppurtunity I'm looking some shorts between 64000$-62610$ on #BTC . It is gonna be hedge short for my current long altcoin positions and possible hedge for Isreal retaliation agaisnt Iran during weekend. Im still bullish overall.
I will be looking for strength-confirmations in order to close shorts and open longs in the marked area between 61300$-59000$ on #bitcoin . I am still bullish. We are coming from the daily bullish structer. I am positioning myself to possible weekend drop. #BTCUSD #cryptotrading

BTC - Testing Key LevelAfter our predicted breakout from our last post on the weekly we can now examine the 1D timeframe to determine the immediate impact of this move on the trend.
We are fighting our critical resistance trendline. Most likely this will break this time due to our higher timeframe confirmations. If we are able to close a daily candle above this red line + create a higher high above our last micro high at 66.5k this should give us the signal that the $70-72k range will be tested.
Even if we get rejected at the higher range in the short term, this resistance level that price is battling with right now will act as new support for any "buy the dip opportunities".


Huge divergenceIn high and long-term time frames, a very large divergence can be seen in the Bitcoin chart, which probably signals a deeper price correction. Be careful for buy deals!

DID YOU LONG THAT? CONGRATULATIONS - MY NEXT TRADEHere are the levels that immediately stand out, we have had a very easy long trade given during yesterday's stream
Are we headed for the range high? Are we headed for the trend line, or will we rotate back down?
If I have time today, I will do an explanation video, but otherwise trade responsively.
For any of these plays, I want to see a flip in structure on the 10-minute chart or higher before entering. Let’s be ready!
Make sure to follow for regular updates and insights! 🔔💡
🔔Enquire for 121 lessons / academy
#500FOLLOWERS 🎉 #500GIVEAWAY 🎁

Bitcoin will break 7 month Bullish Flag?Hey traders!
Here we are, as we thought we touched 59K and we came up.
And we're still moving in a long 229 day bullish flag, and hopefully we could break it soon.
The next resistance target is around 68K and if we're going to break this level, plus volumes will confirm and will see short correction if RSI will be oversold we can go upwards strongly!
But don't forget to pay attention for 1 Day MA which is still bearish, volumes that are still descending and RSI.
What's your thoughts?

BTC Just broke it's June's resistance, Now aiming at the March'sHello All,
No need to explain, just look at the chart

BTC 4h SpeculationBTC is showing a strong upward trend, about 6%,
currently at higher VPVR volume
and going into the supply zone and 0.618 fib
Volume is falling, Delta sell volume seems stronger so far.
Economic news is neutral,
but USA has some nature problems.
Big ask orders on 62500 (1.2k BTC)
Big bid orders on 62050 (640 BTC

BTCUSDT updateDo you still doughting my I deas or you are enjoying the ride,if you are enjoying I would like you to follow all stock markets I analyze,because today is my birthday 🎂 I bought more of bitcoin n adding more positions in Microsoft enjoy the winning seasons.

BTCUSD 15 MIN RSI DIVERSION CLOSE PREV. SWING LEVELbtcusd 15 min bearish diversion
tgt are pending down side
lets see whats happen in mkt
