XBTUSDT.P trade ideas

How to Use Trading Zones in CryptoHello, Skyrexians!
Last two articles were the deep dive into the Awesome Oscillator and Acceleration Deceleration indicators by Bill Williams. In conjunction with the fractals and the alligator these indicators are the powerful concept in cryptocurrency trading. It can significantly boost your cryptocurrency trading strategy, crypto trading algorithm or you can implement it into trading bot. Today we will expand this concept with the trading zones - the periods on the market with the bullish or bearish superiority.
Trading zones is not the popular concept in comparison to Awesome Oscillator, that's why using it can give you a huge advantage in crypto trading because even top crypto traders don't use it in their trading routine. Let's go through its concept.
Before start observing the trading zones concept we have to understand what are the Awesome Oscillator and Acceleration/Deceleration. Awesome oscillator is the approximation of the market's driving force. Usually it starts moving before the price if this is an impulsive wave. During corrections it can flash the false signals. Before the driving force starts moving the acceleration changes its direction. That's why combination of these indicators is so important.
What is the trading zone?
As you know from AO and AC descriptions they can have 2 conditions: increasing (greed bars) and decreasing (red bars). According to this we can define 3 marker conditions:
Green zone. Both AO and AC have the increasing columns. This is the strong bullish phase. Only long trades are allowed.
Red zone. Both AO and AC have the decreasing columns. This is the strong bearish phase. Only short trades are allowed.
Gray zone. AO and AC have the different directions. No signals can be generated by this trading zone

BITCOIN - Detailed important scenario of the last crashOctober 2024 will be the lowest price achieved by Bitcoin in the next 6 months,
The this correction is the latest correction,
The inflation data that was released recently came in at 2.4, higher than expectations, which were 2.3, but lower than the previous reading.
Summary Inflation is falling, but at a slower pace than expected I mean, neither strongly negative nor strongly positive, remember Every correction is a new opportunity
I expect this correnction will continue to the area between 57k - 53k (0.236 fib - 0.382 fib) as shown in chart.
This will not happen directly because before this decline, Bitcoin will rise again to test the 0.618 level 61k shown in the chart, and I will be attacked because positivity will prevail in the atmosphere , but this will be a trap.
When this happens, most currencies will fall at least 20% from this point
Because throughout the history of Bitcoin, the month of October has always been a month of strong rise for Bitcoin and currencies..
Many have high hopes and wait for profits. The US elections are approaching too, and Trump's victory will make all markets rebound then btc will be negative in october positive in November!
To break the myth of uptober
Best regards Ceciliones🎯

Long position for BitcoinIf you get confirmation in 1 hour time, it is better and you can take the long position with more confidence

Trading Signal For BTCUSDT BitcoinTrading Setup:
A Trading Signal is seen in the BTCUSDT Bitcoin (Futures) (1h)
Traders can open their Sell Trades NOW
⬇️ Sell now or sell on 61555.0
⭕️SL @ 62400.0
🔵TP1 @ 59300.0
🔵TP2 @ 57900.0
🔵TP3 @ 55500.0
What are these signals based on?
Classical Technical Analysis
Price Action Candlesticks Fibonacci
RSI, Moving Average , Ichimoku , Bollinger Bands
Risk Warning
Trading Forex, CFDs, Crypto, Futures, and Stocks involve a risk of loss. Please consider carefully if such trading is appropriate for you. Past performance is not indicative of future results.
If you liked our ideas, please support us with your likes 👍 and comments .

58000 important support area of BitcoinWe should wait for Bitcoin's reaction after reaching the support range of 57000 to 58000.
The importance of this support has a great impact on the short-term trend, and if the trend curve is broken, there is a possibility of seeing the range of 39,000 to 41,000.
Share your opinion with me.
Don't forget to boost and follow

Long trade
BTCUSD trade setup is based on various technical indicators, a multi-timeframe analysis, along observations of price action during the NY and Tokyo sessions.
Time: 4:00 AM NY time, during the London session.
Pair: BTCUSD.
Entry Strategy:
Observations of price action in both the New York and Tokyo sessions.
Break of Structure (BOS) in a 15-minute timeframe.
The buy/sell side liquidity balance was observed in a 15-minute timeframe (ICT concept).
Upward accumulation was observed in the 15-minute timeframe.
VWAP, 100WMA, and 50EMA cross are seen in the 4-hour timeframe.
RSI is showing a regular bearish divergence at 64.97.
Entry price: 62,793.38.
Profit target: 63,251.53 (+0.73%).
Stop loss: 62,563.33 (-0.37%).
Risk-to-reward ratio: 1.99.

Next BTC/usdt move Look at this beauty…
Entry: 60250
Tp: 63000
Sl: 60000
We see what Bitcoin does after this move is completed

BTCUSDT 1D for me a long cup of coffeeBTCUSDT 1D for me a long cup of coffee
If you like my AT, and you agree with the approaches, please FOLLOW ME and press BOOST so we can share it with more people. We are working on an automated Trading tool so that everyone can apply their strategies VISUALLY and PROFESSIONALLY, as we present in the analysis.
Thank you!
____________________________________________________________________
BTCUSDT 1D for me a long cup of coffee
Right now we are in an erratic zone in BTC where anything can happen within the handle formation.
It could fall again until it touches the base of the dynamic support and rise again until it reaches the neck of the cup or resistance zone at 70k.
If 49k was the lowest part of the handle, we have to start building ascending lows and break the flag resistance. That is what we have to watch out for.
:GOAL: 120000
To see the forest as a whole, we cannot be inside the forest, because there we will only see trees :)
__________________________________________________________________
Automated Cryptocurrency Trading Bots:
All these strategic alternatives can be configured with TradeX BoT, since it will allow you to position in both directions without having to block any amount per position. It will only be necessary for the conditions to be met, either downward or upward, for the orders to be executed in one direction or another, taking the necessary deposits from your portfolio.
TradeX BoT (in development): Tool to automate trading strategies designed in TradingView. It works with both indicators and technical drawing tools: parallel channels, trend lines, supports, resistances... It allows you to easily establish SL (%), TP (%), SL Trailing... multiple strategies in different values, simultaneous BUY-SELL orders, conditional orders.
This tool is in the development process and the BETA will soon be ready for testing.
FOLLOW ME and I will keep you informed of the progress we make.
I share with you my technical analysis assessments on certain stocks that I follow as part of the strategies I design for my portfolio, but I do not recommend anyone to operate based on these indicators. Get informed, train yourself and build your own strategies when it comes to investing. I only hope that my comments help you on your own path :)

How to trade after #BTC surges?📊How to trade after #BTC surges?
🧠Although my subjective opinion is bullish, I didn't expect it to rise so sharply yesterday, and without any structure as support, the possibility of a subsequent pullback has increased.
Yesterday we tried to place some short orders in the resistance zone. We originally wanted to make a short-term pullback, hoping to build a bullish long structure and then participate in new long transactions, but the final development was not as expected. Therefore, our short orders were closed near the cost price, and we did not lose money. It was a pity that our long orders were closed in advance, but trading is like this.
➡️The trading volume will be much lower on the weekend, and it is likely to be a complex consolidation stage again. From a structural perspective, the short structure at the 4-hour level has not been broken, so there is still an expectation of a decline. If you want to short, you can only focus on the heaviest resistance area around 64,000
➡️If we fall early from here, the support area we can focus on is around 60,000-61,000
Let's see👀
🤜If you like my analysis, please like💖 and share💬
💕 Follow me so you don't miss out on any signals and analyze 💯
BINANCE:BTCUSDT.P


Bitcoin to Break All Time High? Very likelyIn the coming weeks we can anticipate Bitcoin to Rally to and through the All Time High.

Bitcoin daily chart level wave countBitcoin daily chart level wave count: On November 21, 2022, a divergence point appeared at 15438. At that time, I accurately caught the bottom at this place. The views expressed on November 25, 2022, I remember what I published at that time It first breaks through the previous high, then pulls back and then breaks through the previous high. At that time, judging from the waves, it was the end of a correction wave on the daily chart. Then after the correction wave ends, there must be a rise in the Wulang wave, that is, the yellow five wave in the picture (this is a personally defined color). At present, it seems that the yellow fourth wave correction is over. The previous yellow second wave correction is very simple. According to the characteristics of wave alternation, the yellow fourth wave correction is much more complicated. The green WXY Union it went ended at 49,000. The yellow fifth wave is starting to run. At the same time, the wind is consolidating and going in the opposite direction, and it is time

BTC scalp tradeIf 30 min candle closes below 62,300 than short with tp 61,300
Stop loss above the candle which closes below support

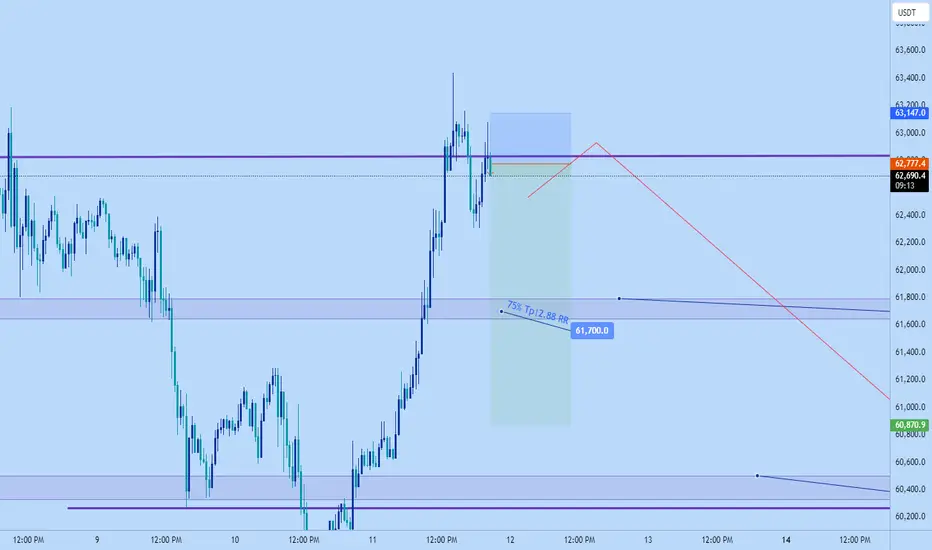
Bitcoin short back to $61700 or lowerJust opened a Bitcoin short.
Am anticipating that we'll still close the week bearish.
This short target is conservative at $61700. I'll look to take 75%
Leaving 25% just incase we break down a lot lower.
Bitcoin: Waiting for Reaction at Key Resistance!BTCUSDT has been in a downtrend channel for the past few days, currently facing a strong resistance zone of $61,200 - $61,500. This area coincides with the EMA 34 and EMA 89, representing a strong resistance for the price. Accordingly, the trading volume is not strong enough to push the price through, so the possibility of another decline is very high.
Correction Expectation:
-If the price fails to break this resistance zone, it may fall to the $58,400 - $57,900 area.
Trading Strategy:
-Sell Position: Consider selling at the resistance zone of $61,200 - $61,500, with a target of $58,400 - $57,900.
-Stop Loss: Place just above $61,500.
Edward's Final Word: "Don't let FOMO blind you, discipline is the deciding factor!"

BTC LongShort term sentiment for price trend is upwards after strong bullish action yesterday. ADX confirms this with PlusDI above MinusDI and ADX value at 55 (strong uptrend).
Price retraced back to demand zone between 62420 and 62000 on 30 min chart triggering long position entry.
Target resistance area : between 68K and 70K. I maintain my original view still though that price is poised to attack 75K .

BTCUSDT-2024-10-12There is a potential bearish harmonic pattern in BTC at present, which has broken through point C and will continue to go short with a retracement

Margin Zones SetupOn the D1 chart, an accumulation with a Point of Control (POC) at 63246 is forming. This is key for predicting the following swings. The marginal zones outline two trading areas:
Buying in the range of 54183-57204.
Selling in the range of 67777-69287.
Considering the previous accumulation at POC 59604, the realization of the first scenario is more likely, as the second marginal target has not been met.
The advantage of the second scenario is the possibility of forming a Diagonal wave pattern, which would increase predictability for the coming months.

Next Volatility Period: Around November 4th
Hello, traders.
If you "Follow", you can always get new information quickly.
Please click "Boost" as well.
Have a nice day today.
-------------------------------------
The next volatility period is around November 4th.
At this time, the point to watch is in which direction it deviates from the range of (54.7K-56.1K) ~ (64.7K-66.6K).
-
This volatility period is about to end.
We need to check if it can be supported around 62856.30.
If it receives support near 62856.30, it will enter the box section of the HA-High indicator on the 1D chart, so it is expected to lead to an upward trend to break through the 64748.70-65920.71 section.
Otherwise, if it falls, we should check whether there is support near 61099.25.
In particular, if the price is maintained above 61759.99, it is expected to show an additional upward trend as it will maintain the state of M-Signal on the 1D chart > M-Signal on the 1W chart.
In any case, in order for a full-fledged upward trend, a stepwise upward trend, to begin, the price must be maintained above 64748.70-65920.71.
Since the BW indicator is expected to create a horizontal line at the lowest point (0), the point of observation is whether there is support at the BW line point that is created this time.
-
(Chart under test)
(BTCUSDT.P 1D chart)
This is a chart for use below 1D charts, but the trend of the 1D chart is important, so be sure to check it before starting a trade.
The mandatory items in the BW+ indicator are BW 100, BW 0, and Mid (50).
The High (80 Down), Low (20 UP) indicators are optional.
The core interpretation method of the BW+ indicator is
1. Buy (LONG): Start trading at the BW 0 line and end trading at the BW 100 line.
2. Sell (SHORT): Start trading at the BW 100 line and end trading at the BW 0 line.
3. The Mid (50) line is the position conversion line.
Therefore, since the current BW 100 line has been created, it is time to liquidate the long position entered at the BW 0 line.
However, you can decide whether to completely close the transaction by selling 100% or to sell in parts and watch the situation.
-
Since the BW 100 line has been created, you can proceed with selling (SHORT) as the second key interpretation method.
However, as I mentioned earlier, the trend of the 1D chart is important.
Currently, the M-Signal indicator of the 1D chart has risen above the level and is showing signs of turning into an upward trend.
Therefore, a short and quick response is required when entering a short (SHORT) position.
This is because you will be trading against the trend of the 1D chart.
-
Since it is a futures transaction, you may think that you should trade on a low time frame chart, but that is not necessarily the case.
The lower the time frame chart, the more frequent the fluctuations, making it difficult to maintain a position.
Therefore, it is important to select an appropriate time frame chart according to the leverage and funds you have chosen.
--------------------------------------
A gap down occurred in USDT.
We need to check if the gap down occurs continuously.
We need to check if USDC is maintained above 26.153B and if the gap downtrend stops.
Although the coin market is trend-following, the volatility caused by the movement of funds has a great influence on forming a trend.
Therefore, I think that chart analysis should not be done only with trends.
----------------------------------------
(NAS100USD 1D chart)
BW line was created at 20287.1.
Therefore, if it fails to rise above 20313.8, it is expected to fall.
The important support and resistance area in the decline is around 19582.6.
-
Have a good time.
Thank you.
--------------------------------------------------
- Big picture
The full-scale uptrend is expected to start after rising above 29K.
The area expected to be touched in the next bull market is 81K-95K.
#BTCUSD 12M
1st: 44234.54
2nd: 61383.23
3rd: 89126.41
101875.70-106275.10 (overshooting)
4th: 134018.28
151166.97-157451.83 (overshooting)
5th: 178910.15
These are points where resistance is likely to occur in the future.
We need to check if these points can be broken upward.
We need to check the movement when this section is touched because I think a new trend can be created in the overshooting section.
#BTCUSD 1M
If the major uptrend continues until 2025, it is expected to start forming a pull back pattern after rising to around 57014.33.
1st: 43833.05
2nd: 32992.55
-----------------

BTC 1H update - Oct 11 2024After dropping to 58,800 zone, #BTC has been pumping on Friday. Having reached 63,500 level, it's possible to see some negative reaction to the mentioned level. BTC might re-touch 60,600 zone following the possible negative reaction. There's still no bearish structure visible on the chart so we'll have to keep watching it.

Bitcoin Quick update BINANCE:BTCUSDT Bitcoin is now trading above 63000$, after taking correction of 58900$ an accurate retest of support i market in my bitcoin chart, Now the key price for bitcoin to keep your eyes on is the range of 63700$-64200$ if bitcoin breakout this higher selling area, we might see bitcoin at 68k$ again.. don't forget to like comment and share if my updates help you.

#BTC will continue to fall?📊#BTC will continue to fall?
🧠We continued to break the support after rebounding in the support zone yesterday, so the support zone turned into a resistance zone. We are currently in an hourly downtrend, and the ideal target zone (57888-59433) of the short structure has not been achieved, so there is an expectation of continued decline.
➡️If we want to reverse the downward trend, we need to build an hourly long structure in the stage support zone (59663-60493), otherwise don't be too optimistic.
⚠️There is a long structure at a larger level, so don't rush to short. Even if you want to short, you need to wait until the price reaches the resistance zone before trying.
Let's see👀
🤜If you like my analysis, please like💖 and share💬
💕 Follow me so you don't miss out on any signals and analyze 💯
BINANCE:BTCUSDT.P
