Bearish Divergence on $COPPER - Short to $3.80It costs 2 pennies to make one penny, copper isn't needed for money in the U.S, scrappers are at an all-time high and demand is outweighing need
XCUUSD trade ideas

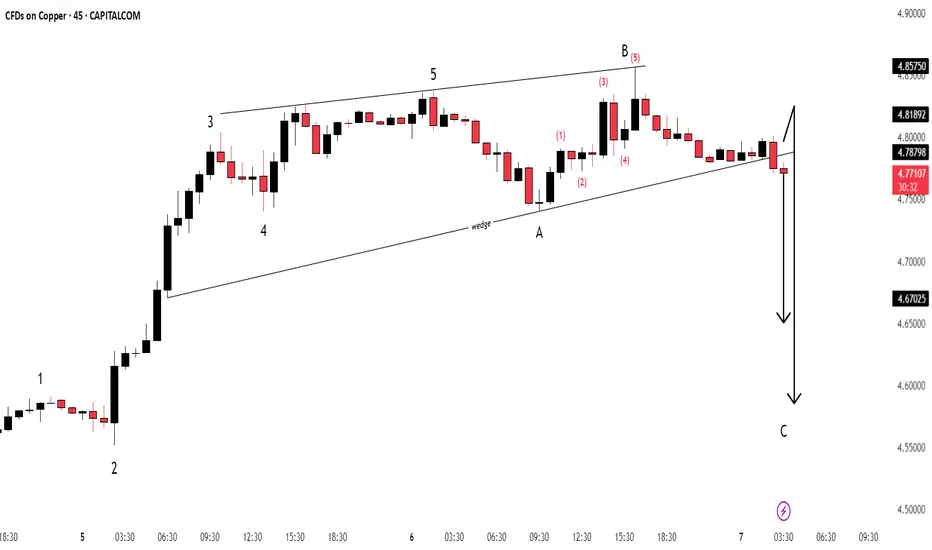
CopperXCUUSD ( Copper / U.S Dollar )
This Analysis is based on these Factors :
1. Change of Characteristics
2. Demand Zone
3. Elliot Waves
4. RSI - Divergence
5. Rising Wedge
COPPER at Key Resistance: Will Sellers Push Toward 4.5230?PEPPERSTONE:COPPER has reached a significant resistance level, marked by prior price rejections and strong selling pressure. This area has historically acted as strong supply, suggesting the potential for a bearish reversal if sellers regain control.
If the price confirms a rejection within this supply zone, I anticipate a move downward toward the 4.5230 level. This setup suggests the possibility of a retracement after the recent upward movement.
Traders should look for bearish confirmation signals, such as bearish engulfing candles or strong rejection wicks, before entering short positions.

Copper is gonna to complete the 2nd leg??Hi all trading lovers and copper buyers...
Seems that after BREAKOUT from Descending Triangle and Pullback to breakout level, price is going to complete the 2nd BULLISH Leg in Weekly uptrend with a round level target (5.5555)...
(Pullback could be a bit deeper...)
PLEASE NOTE THAT IS ONLY AN ANALYSIS AND COULD BE WRONG...
MARKET IS BASED ON POSSIBILITIES AND UNCERTAINTIES...
MANAGE YOUR RISK...
#Forex #Trading #Analysis #Copper #Chart #Spike #Wedge #Uptrend

COPPERXCUUSD ( Copper / U.S Dollar )
Point of Interest
Completed " 12345 " Impulsive Waves and " AB " Corrective Waves
Break of Structure
RSI - Divergence
Symmetrical Triangle as an Corrective Pattern in Short Time Frame

Copper is finding it's way to 5.5555...Hi all trading lovers and copper buyers...
Seems that copper is continuing its uptrend targeting 5.5555...
PLEASE NOTE THAT IS ONLY AN ANALYSIS...
MARKET IS BASED ON POSSIBILITIES AND UNCERTAINTIES...
#Forex #Trading #Analysis #Copper #Chart #Spike #Wedge #Uptrend

CopperHello traders, please feel free to share your trading ideas, and please give a Boost if you agree with my trading plan. My trading strategy is Price Action, which is the simplest strategy of trading on the price movement. A key part of my discipline is Stop Loss set when opening a trading position, which ensures every trading is risk managed. My 1 to 1 trading training is available, please message. Trade well and good luck!

Copper The Week Ahead 10th March '25Copper maintains a bullish sentiment, supported by a longer-term uptrend. However, the recent price action suggests a corrective pullback toward a key support zone, which could determine the next major move.
Key Levels to Watch
Resistance Levels: 9440 (200 DMA), 9650, 9950
Support Levels: 9260, 9160 (50 DMA), 9060
Bullish Scenario
A successful retest and bounce from the 9260 support level, which aligns with the rising trendline and previous consolidation zone, could reaffirm bullish momentum. If this level holds, Copper could target the 9440 resistance (200 DMA), with further upside potential toward 9650 and 9950 in the longer term.
Bearish Scenario
A confirmed breakdown below 9260, with a daily close beneath this level, would weaken the bullish outlook. This could lead to a deeper retracement toward the 9160 support (50 DMA), with extended downside risk toward 9060 if selling pressure persists.
Conclusion
While Copper remains in a broader uptrend, the 9260 level serves as a key pivot point. A bullish bounce from this level could signal trend continuation, while a breakdown below it may indicate further corrective weakness. Traders should monitor these levels closely for confirmation of the next directional move.
This communication is for informational purposes only and should not be viewed as any form of recommendation as to a particular course of action or as investment advice. It is not intended as an offer or solicitation for the purchase or sale of any financial instrument or as an official confirmation of any transaction. Opinions, estimates and assumptions expressed herein are made as of the date of this communication and are subject to change without notice. This communication has been prepared based upon information, including market prices, data and other information, believed to be reliable; however, Trade Nation does not warrant its completeness or accuracy. All market prices and market data contained in or attached to this communication are indicative and subject to change without notice.

COPPER Long1)Trend defined. Daily uptrend.
2)Contradictory market entry. After the recovery of the pullback at the 26-day EMA.
3)Default loss. Below the nearby key level.
4)Target not set. Multiple targets.
5)Risk <= 3%.
6)Singular trade.
7)Trades placed today <= 5.

Copper - my favorite product! just follow the price Copper is my favorite product! Please just follow the price movement, then buy and sell then TP it.
Hello traders, please feel free to share your trading ideas, and please give a Boost if you agree with my trading plan. My trading strategy is Price Action, which is the simplest strategy of trading on the price movement. A key part of my discipline is Stop Loss set when opening a trading position, which ensures every trading is risk managed. My 1 to 1 trading training is available, please message. Trade well and good luck!

Copper Overbought uptrend, The Week Ahead 03rd March ‘25Copper maintains a bullish sentiment, supported by a longer-term uptrend. However, the recent price action suggests a corrective pullback toward a key support zone, which could determine the next major move.
Key Levels to Watch
Resistance Levels: 9440 (200 DMA), 9650, 9950
Support Levels: 9260, 9160 (50 DMA), 9060
Bullish Scenario
A successful retest and bounce from the 9260 support level, which aligns with the rising trendline and previous consolidation zone, could reaffirm bullish momentum. If this level holds, Copper could target the 9440 resistance (200 DMA), with further upside potential toward 9650 and 9950 in the longer term.
Bearish Scenario
A confirmed breakdown below 9260, with a daily close beneath this level, would weaken the bullish outlook. This could lead to a deeper retracement toward the 9160 support (50 DMA), with extended downside risk toward 9060 if selling pressure persists.
Conclusion
While Copper remains in a broader uptrend, the 9260 level serves as a key pivot point. A bullish bounce from this level could signal trend continuation, while a breakdown below it may indicate further corrective weakness. Traders should monitor these levels closely for confirmation of the next directional move.
This communication is for informational purposes only and should not be viewed as any form of recommendation as to a particular course of action or as investment advice. It is not intended as an offer or solicitation for the purchase or sale of any financial instrument or as an official confirmation of any transaction. Opinions, estimates and assumptions expressed herein are made as of the date of this communication and are subject to change without notice. This communication has been prepared based upon information, including market prices, data and other information, believed to be reliable; however, Trade Nation does not warrant its completeness or accuracy. All market prices and market data contained in or attached to this communication are indicative and subject to change without notice.

If you can digest some down side..If you can digest some downside..
Which may not come..
Tgt possible 5.2$
COPPERWeekly out look on COPPER I see the copper market on bullish for a long run if DXY continues to dump

Copper - this is how my plan works. Hello traders, please feel free to share your trading ideas, and please give a Boost if you agree with my trading plan. My trading strategy is Price Action, which is the simplest strategy of trading on the price movement. A key part of my discipline is Stop Loss set when opening a trading position, which ensures every trading is risk managed. My 1 to 1 trading training is available, please message. Trade well and good luck
COPPER above 200DMA, The Week Ahead 24 Feb ‘25 The COPPER price action sentiment appears bullish, supported by the longer-term prevailing uptrend. The recent intraday price action appears to be a corrective pullback towards the previous consolidation price range and also the rising support trendline zone.
The key trading level is at the 9260 level, the previous consolidation price range and also the rising support trendline zone. A corrective pullback from the current levels and a bullish bounce back from the 9260 level could target the upside resistance at 9445 (200-day moving average) followed by the 9650 and 9950 levels over the longer timeframe.
Alternatively, a confirmed loss of the 9260support and a daily close below that level would negate the bullish outlook opening the way for a further retracement and a retest of 9130 (50 Day Moving Average) support level followed by 9060.
This communication is for informational purposes only and should not be viewed as any form of recommendation as to a particular course of action or as investment advice. It is not intended as an offer or solicitation for the purchase or sale of any financial instrument or as an official confirmation of any transaction. Opinions, estimates and assumptions expressed herein are made as of the date of this communication and are subject to change without notice. This communication has been prepared based upon information, including market prices, data and other information, believed to be reliable; however, Trade Nation does not warrant its completeness or accuracy. All market prices and market data contained in or attached to this communication are indicative and subject to change without notice.

CopperXCUUSD ( Copper / U.S Dollar )
EXP FIAT as an Corrective Pattern in Short Time Frame
Completed " 12345 " Impulsive Waves
Break of Structure
Falling Wedge in Long Time Frame
Change of Characteristics

21.02.25 Morning ForecastPairs on Watch -
FX:GBPUSD
FX:GBPCAD
FX:COPPER
A short overview of the instruments I am looking at for today, multi-timeframe analysis down to what I will be looking at for an entry. Enjoy!

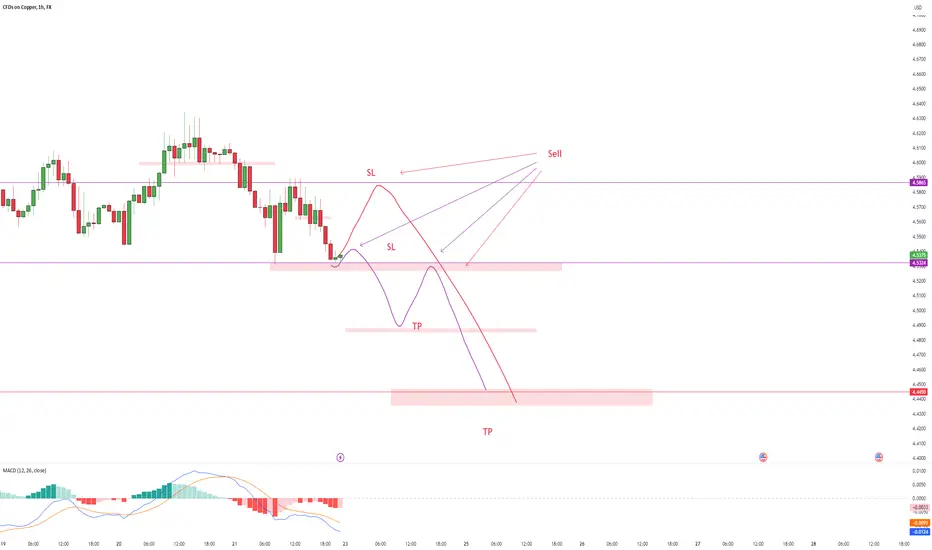
Bearish drop off 50% Fibonacci resistance?COPPER is rising towards the resistance level which is a pullback resistance that aligns with the 50% Fibonacci retracement and could reverse from this level to our take profit.
Entry: 4.6819
Why we like it:
There is a pullback resistance level that lines up with the 50% Fibonacci retracement.
Stop loss: 4.7856
Why we like it:
There is a pullback resistance level.
Take profit: 4.5406
Why we like it:
There is a pullback support.
Enjoying your TradingView experience? Review us!
Please be advised that the information presented on TradingView is provided to Vantage (‘Vantage Global Limited’, ‘we’) by a third-party provider (‘Everest Fortune Group’). Please be reminded that you are solely responsible for the trading decisions on your account. There is a very high degree of risk involved in trading. Any information and/or content is intended entirely for research, educational and informational purposes only and does not constitute investment or consultation advice or investment strategy. The information is not tailored to the investment needs of any specific person and therefore does not involve a consideration of any of the investment objectives, financial situation or needs of any viewer that may receive it. Kindly also note that past performance is not a reliable indicator of future results. Actual results may differ materially from those anticipated in forward-looking or past performance statements. We assume no liability as to the accuracy or completeness of any of the information and/or content provided herein and the Company cannot be held responsible for any omission, mistake nor for any loss or damage including without limitation to any loss of profit which may arise from reliance on any information supplied by Everest Fortune Group.

Copper Elliott Wave Forecast: Bullish Breakout Targeting $5+Copper’s Elliott wave price structure suggests a completed contracting symmetrical triangle (ABCDE) correction, followed by the start of a five-wave impulse. The chart shows:
Primary Degree Count: The rally from the $4.00 low (Wave E) marks the start of a five-wave impulse pattern.
Intermediate Degree Count:
Wave (i) of ((iii)) topped at $4.8346.
Wave (ii) of ((iii)) is in progress, likely finding support above $4.42-4.54.
Wave (iii) of ((iii)) is expected to extend toward the 1.618 Fibonacci extension level (~$5.00).
Wave (v) of ((iii)) could reach the 2.618 Fibonacci extension (~$5.59).
The Relative Strength Index (RSI) shows overbought conditions, suggesting a short-term correction before the next rally.
COPPER'S ALTERNATE COUNT
There is an alternate count we are keeping an eye on (labeled in red).
The alternate count would suggest that the February 14 high was wave ((iii)) and a sideways grind is unfolding in wave ((iv)). This sideways grind would need to hold above $4.46 to remain valid.
The alternate count would imply a more mature advance with less upside potential.
BOTTOM LINE
Copper’s Elliott Wave count suggests an impulsive rally targeting $5.00+. A corrective pullback toward $4.42-4.54 offers potential buying opportunities. Bulls remain in control unless price drops below $4.18.

LONG ON COPPERPrice is in Great uptrend structure from the HTF.
Price has completed its pullback all the way to a Key Demand area.
Its also built up liquidity to be swept right above that demand zone.
I expect price to swept buy side liquidity to the downside, tap into demand, then take off to the upside.
I am buying copper.

Copper The Week Ahead 17th Feb 25The COPPER price action sentiment appears bullish, supported by the longer-term prevailing uptrend. The recent intraday price action appears to be a corrective pullback. towards the previous consolidation price range and also the rising support trendline zone. .
The key trading level is at the 9260 level, the previous consolidation price range and also the rising support trendline zone. A corrective pullback from the current levels and a bullish bounce back from the 9260 level could target the upside resistance at 9445 (200-day moving average) followed by the 9650 and 9950 levels over the longer timeframe.
Alternatively, a confirmed loss of the 9260support and a daily close below that level would negate the bullish outlook opening the way for a further retracement and a retest of 9130 (50 Day Moving Average) support level followed by 9060.
This communication is for informational purposes only and should not be viewed as any form of recommendation as to a particular course of action or as investment advice. It is not intended as an offer or solicitation for the purchase or sale of any financial instrument or as an official confirmation of any transaction. Opinions, estimates and assumptions expressed herein are made as of the date of this communication and are subject to change without notice. This communication has been prepared based upon information, including market prices, data and other information, believed to be reliable; however, Trade Nation does not warrant its completeness or accuracy. All market prices and market data contained in or attached to this communication are indicative and subject to change without notice.

Copper Bearish Crab Pattern
In 2024, copper prices have exhibited notable fluctuations, driven by macroeconomic trends, industrial demand, and supply constraints.
Key Fibonacci retracement levels have played a crucial role in shaping market movements. With the 0% level at $3.96, the 23.6% retracement at $4.11 acted as an initial support, while the 38.2% level at $4.225 provided stronger stability.
The 50% retracement at $4.28 served as a key equilibrium zone, with the 61.8% level at $4.361 marking a critical support for potential reversals.
According to the harmonic Crab pattern , the 161.8% Fibonacci extension near $5.00 is expected to act as a major resistance. If the price reaches this level, a sharp bearish reversal is likely due to overbought conditions. A rejection at this resistance could drive prices down toward the support zones, completing the harmonic correction phase.
However, a breakout above $5.00 could invalidate this scenario and lead to further bullish momentum.
If you like this trading idea and want to stay updated with the next one, please give it a thumbs up and follow along! Your support means a lot, and I’m excited to share more insights with you. Let’s embark on this journey together!
SEYED.

Copper (XCU) Bullish Pullback: Buy the Dip!Copper (XCU) remains bullish, with a retracement offering a buy opportunity at the 0.5 or 0.618 Fibonacci levels—if no divergence forms. Watch for bullish confirmation signals and set stop-losses below 0.618 or recent lows. If divergence appears, exit or avoid new positions. Upside targets: previous highs and Fibonacci extensions (1.272 or 1.618).
