My bottom line with XLMCOINBASE:XLMUSD
With such highly speculative markets like crypto, I don't understand what gives with investors on XLM. I don't want to get into too much tl;dr territory but this is why I've always been super long on XLM every single time it's ~0.10 or less:
Is similar to COINBASE:XRPUSD in function and has great partnerships and tech to back up a "stellar" valuation.
In the vein of being similar to XRP, XLM's market cap is 3.671B at the time of writing. XRP's is 26.513B with close to double the circulating supply of 53.083B. So just in terms of market cap, if Stellar were to be equal in value with XRP, Stellar's price could be ~$0.90 to achieve the same valuation. I don't understand the massive discrepancy IMO. Maybe it's just all clout and/or awareness of the token.
IMO crypto always seems to just go in waves, everyone wants the chart to be back at ATH and this just seems to manifest at some point. Looking at XLM's chart, we can see almost exactly the same pattern as the last two waves emerging (again).
XLMBULLUSD trade ideas

Stellar 50% profit targetStellar trap inside sideways channel for 23 days, and it's still trying to break classic support and resistance level at 0.1334.
This Classic support and resistance become a new bullish confirmation, and if it breaks up bullish target at 0.14745 as fibonacci resistance, and maximum target at 0.17089 as previous high.
The best strategy to enter this market is wait for stellar to reach 0.112460 as sideways support and aim for previous high at 0.17892 with 52% profit.
Good luck, may profit be with you.
If you have any questions about this analysis, do not hesitate to contact me.

Stellar has insane potential in the price patternAugust seems to be calm, but at the beginning of September we are up
xlm and xrp are big competitors to each other and we will soon see a strong rise in both
I will let you know when I participate because I will probably buy a large amount of Stellar since the profit seems to be hundreds of percent
If you have any questions, I will be happy to answer them
and you may also be interested in any other coin analysis you want to see then you can leave comment

Will XLM Price Ready To Cross $0.14?XLM showcases a double-bottom bounceback from the 200-day EMA.
The recovery rally breaks past the resistance trendline, potentially averting a death cross.
XLM's breakout rally is nearing the overhead supply belt at $0.14.
Currently trading at $0.12269, XLM is at a 37% discount from its 2023-high of $0.1959.
The bullish double-bottom reversal suggests a potential surge in Stellar Lumens' market value.
The rally is positively influencing the 50-day EMA trajectory.
XLM's price trend between the 50 and 200-day EMAs indicates a strong bounce.
With a 7.67% increase in the last 48 hours, XLM surpasses the 50% Fibonacci level.
The breakout rally aims for the $0.1425 mark, challenging the supply belt.
The supply belt aligns with the 23.60% Fibonacci level.
The double bottom reversal's neckline is at $0.1425, potentially leading to a 15% price increase.
If bullish momentum continues, XLM could break the $0.1425 supply belt and aim for $0.20.
A downtrend breaking the 200-day EMA could see XLM drop to $0.094.

XLM - Reevaluating My Perspective on Market Trends Since 2017In this engaging video, I've dedicated a significant amount of time to reevaluating my perspective on market trends since 2017. I recognized the importance of taking a break from intense analysis to shed any preconceived biases in my wave counts, enabling me to approach the charts with a fresh perspective.
Today, I'm excited to share my updated perspective on the current market count after meticulously reviewing all the data once again. I'm pleased to report that the process was surprisingly smooth, allowing me to refine my ideas and insights.
But that's not all; I'm committed to continuing this journey of revisiting and processing many more ideas in the future. It's essential to stay flexible in the world of finance and adapt to changing dynamics.
Lastly, I'd like to emphasize that I'm overwhelmingly bullish on the long-term prospects. However, I firmly believe in making informed decisions and taking positions when the timing aligns with the market's movements. Join me in this video as we delve into my refreshed perspective and insights!

XLM: Distribution Back to StructureXLM has topped out well above the broadening wedge and is distributing back into the structure. A retest of trend resistance failed and it looks like more downward action will play out. Look for short term PA to hit somewhere between the 1.414 and 1.618 Fib retracement zones for either short sales or the resumption of a DCA campaign.

WAVE 3Wave 1 completed
Wave 2 completed
Wave 3 in progress
I anticipate that the target for wave 3 would be $17 which is 1.618 times wave 1. The start of wave 3 is the target of wave 2.
Fibonacci Levels Are Based On Log Scale
NOTE: WHAT YOU SEE IS WRONG AND IT IS MERE GUESS WORK BASED ON TECHNICAL INDICATORS AND PAST PRICE ACTION

Is XLM Price Bound To Continue A Negative Trajectory?XLM price moves sideways between 50 and 100-day EMA.
Resistance trendline indicates strong selling pressure.
Break below 100-day EMA could push XLM below $0.10.
XLM faces significant resistance at $0.16, with sellers controlling bullish momentum.
Downtrend exerts pressure on 100 and 200-day EMA.
Price trapped between 50% and 38.2% Fibonacci levels, consolidating between $0.119-$0.129.
Intraday fall of 2.15% sees XLM testing $0.119 support.
Breakout from current Fibonacci levels will indicate next move.
Potential double top formation suggests possible downtrend.
If price drops below 100-day EMA, 200-day EMA buyers may step in, stressing the $0.10 mark.
Bullish scenario: If XLM breaks 50-day EMA, it could target $0.142.
XLM buy opportunity soonStochastics are retreating. Weekly and monthly chart suggest pull back. You can see short term 4-hour chart is gearing for a 10c-11c test. Be mindful of any short term rallies; they’re just that - short term. I expect XLM to present a very last buy opportunity between 7-9c by end of year.
Happy trading!

XLM short-term lowsStochastics are topped out on the 4-hour chart. I expect a leg down is imminent and a test of prior lows. Should present a buy opportunity.

Stellar Lumens - A Hidden OpportunityStellar Lumens - A Hidden Opportunity
I cover the chart first and then some positive fundamental's and tokenomics.
The LSE:XLM Chart
I located and plotted trigger points, boundaries and of course a time structure.
There is a clear bull/bear time pattern. Open the chart and see the months and see how they move in similar increments both by month and by number for Bull and Decline periods.
Three positive price action triggers are marked on the chart and are confirmed by the following:
1. Break above 10 Month SMA, combined with
2. Confirmed MACD Cross, combined with
3. Both occurring in the bull pattern time window
All three have just occurred as of July 2023. IN ADDITION
4. This time we have broken above the POC, and
5. We have broken out of the OBV resistance line.
All of the above is extremely bullish for Stellar Lumens XLM for the long term.
The risk/return is ideal as a price just under the bottom of the ascending triangle can act as a stop loss for you and the upper end can act as a first main point to take profit.
Undesirables:
- If we close a weekly candle outside of ascending Triangle, Exit trade.
- If we fall below the POC or 10MSMA, reduce position size or hold off until this happens and increase position size.
This chart is another fine example of how timeframes can help us structure a trade. Please note that this is a long term 12 - 18 month trade minimum. You could be exiting at any stage over those months depending on the trigger events mentioned above, ideally closing the majority of the position at the first trigger point 0.60c (lock in your stake and some profit). Furthermore, you have to be able to withstand the volatility within the ascending triangle without capitulating your position. There is currently some room to the downside but a lot more to the upside, you need to be prepared for both.
Positive XLM fundamentals:
Stellar is already being onboarded as a potentially compliant global payments system:
Stellar (XLM) like Ripple Labs (XRP) is intending to be a layer 2 international global payments remittances provider and enabler, albeit while Ripple Labs is targeting big business and institutional networks/transactions, Stellar has an incredibly varied pipeline from on/off ramps, asset tokenisation, moneygram conversion and access, and much more. Stellar appears to be targeting the developer, the retailer, the consumer, the international payments community in their transfers/remittances, and the unbanked. The Stellar Blockchain is a decentralized consensus protocol making it very quick and very efficient with a distributed ledger updating globally every 2 to 5 seconds.
ISO 20022 is an International Organization for Standardization (ISO) standard for exchanging electronic messages on payments data between financial institutions. They set the international payment standards through the likes of the SWIFT system and for the likes of CITI Bank, HSBC, J.P Morgan and Deutsch Bank.
Currently cryptocurrency’s that are ISO Compliant or in the process of becoming compliant include Ripple CRYPTOCAP:XRP , Xinfin Network TSX:XCD , Algorand EURONEXT:ALGO , IOTA and Stellar Lumens $XLM.
Why is this so important? Well because ISO compliant payment networks will be the most likely to be called upon for the distribution or enablement of Central Bank Digital Currencies (CBDC’s) and other secondary payment protocols.
Private Partnership from the likes Ripple & Stellar will likely be called upon to develop, enable and distribute a new CBDC:
We are aware that most governments are in the process of developing CBDC’s and cannot complete this task without private partnerships.
For example as early as 2019 the Official Monetary and Financial Institutions Forum (OMFIF) outlined the following observations:
“Practically, the operation of a CBDC is likely to rely on some sort of public-private partnership. Central banks could outsource the distribution of the CBDC to private financial institutions, which could also be involved in the onboarding of users”
“most central bank respondents suggested they would outsource many of the public facing tasks involved in CBDC management to third parties.”
“Some central banks noted that certain functions – such as ‘onboarding and overlay services’, or the actual distribution of the currency itself – could be ‘outsourced’ to private sector participants.”
“Among respondents, 64% said ‘intermediation’ functions, such as customer onboarding, which could be ‘outsourced’ to private sector participants, would be important in CBDC implementation”
In more recent news the Bank for International Settlements (BIS) AKA the Bank for Central Banks published a report based on surveys and data collection called “Making Headway”, they advised that:
o 86 central banks took part in the survey (including the largest)
o 15 CBDC’s would be up and operational by the end of the decade 👀
o Confirmed that Central Banks can hold up to 2% of their balance sheet in cryptocurrencies from the January 2025.
Considering the BIS is usually very anti crypto this news is significant.
Positive Tokenomics Vs competitor XRP:
XLM is currently 21st largest cryptocurrency in the world with a market cap of €3.4 billion.
XRP by comparison has a market cap of $27.8 billion and is ranked 5th, thus XRP would have a harder time of it in terms of multiplying its larger market cap and price.
In November 2019, the overall XLM supply was reduced. Now there are about 50 billion lumens, total, in existence, and no more lumens will be created.
So XLM has a max token supply of 50 billion whilst XRP has a max supply of 100 billion making it a more price dilutable token than XLM. At present XLM have released 51% of their 50 billion max token supply to the market whilst XRP have released 50% of their 100 billion tokens - 52.9 billion tokens (equating to number greater than the full supply available in XLM). XLM’s price will be greater impacted by demand than XRP due to the lower max token supply, smaller market cap and the fact no more new Lumens can be created, it is a fixed supply.
The more participants that join the network and use the network the less Stellar Lumens are available thus creating a demand. From Jan 2020 to present Stellar Lumen accounts have increased from about 4.2 million to 6.7 million. In the same period total transactions increased from <250,000 to almost 1 million.
All in this 12 – 18 month trade comes with a lot of positive upside and limited downside. XLM has a reasonable fundamental narrative backing it that could make it central to future payment networks and the XLM tokenomics provide a lot more upside potential than those of its close competitor Ripple (XRP). I am a fan of both offerings however it seems reasonable to have an XLM position if you have an XRP one. Maybe we can be the X-Army and support one another…. Maybe “X” will use both for its payment platform. One can dream. Please have a look at my XPR chart which is similar to the this XLM one, you may find that beneficial too.
Hope all of the above helps frame XLM in your minds eye and also provides you with a structure for an XLM trade.
PUKA

Keep an eye on $XLM/USDTThis chart specifically pertains to a projected extended period of rising prices and positive market sentiment, often referred to as a "bull run." It focuses on forecasting favorable market conditions over a significant time frame.
Did you find this crypto market analysis helpful? Stay updated about the latest crypto market update.
Please continue to follow my analysis and feel free to ask any queries, you may have. I am here to assist you.
TradingView: @FarmanBangashh

Monitoring Support LevelsThere are 3 important support levels in this chart. We have support at 11 cents which used to be resistance before the break out to complete the mini bull run. And then we've got 9.5 and 7.5 c. Price must hold above 11 c at all cost or drop down back to 9.5 c. As long as price stays above 9.5 c, I won’t be counting on the price revisiting 7.5 c. By analyzing the hourly chart I’m a giant fluffy bear, but when I look at the monthly chart, I’m one horny BULL.

XLMUSD (1H) - Bullish breakoutHi Traders
XLMUSD (1H Timeframe)
The market is in an uptrend and we are waiting for an entry signal to go LONG above the 0.1328 resistance level. Only the downward break of 0.1279 would cancel the bullish scenario.
Trade details
Entry: 0.1328
Stop loss: 0.1279
Take profit 1: 0.1358
Take profit 2: 0.1406
Score: 4
Strategy: Bullish breakout

XLM 8/19/23XLM will fall around $0.0777 October - December 2023
This will be a chance of a lifetime!
Get your dry powder!
Get ready to strike!
:)

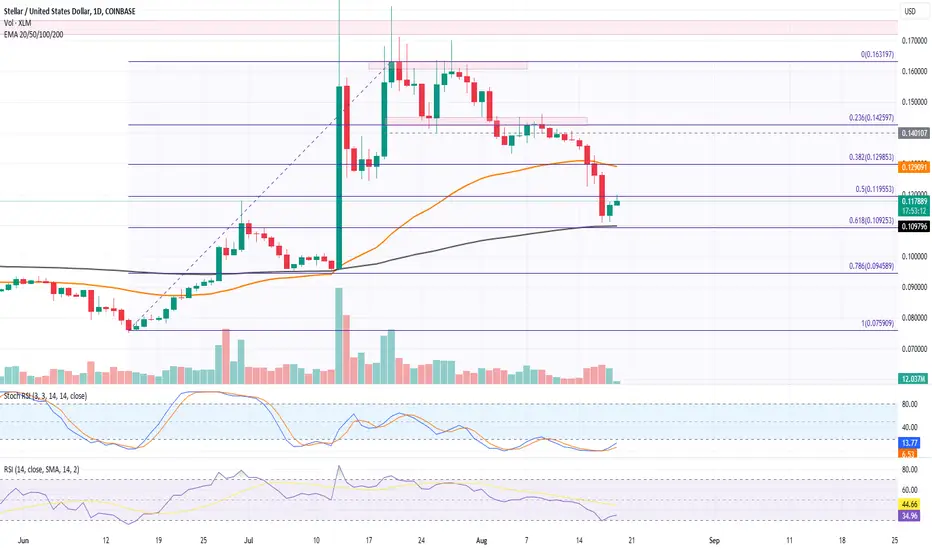
Will XLM Prices Avoid A Drop Below The 200-Day EMA?
XLM Price Reversal: The price reversed from the $0.14 resistance zone, resulting in a 20% drop to the 200-day EMA.
Short Recovery Phase: After reaching the 200-day EMA, a short recovery phase of 4.71% occurred.
Potential Crash: A breakdown below the 200-day EMA could crash the XLM price to $0.094.
Sharp Correction: The retest of the $0.14 resistance level led to a sharp correction and a significant discount in Stellar coin price.
Catalyzed Fall: The intense fall was accelerated by the retest phase and overall market correction.
Breach of Support Levels: XLM price breached multiple support levels, including the 50-day EMA and 50% Fibonacci level.
Short-Term Recovery: Absorbing the selling pressure, XLM set for a short-term recovery, extending to 4.12% in the last 48 hours.
No-Trade Zone: The current recovery remains uncertain, and a breakout of specific Fibonacci levels will signal the next entry.
Downtrend Continuation Risk: There are strong chances of a downtrend continuation with a potential bullish trap unless the recovery undermines the 10.42% drop bearish candle.
Uptrend Possibility: If the uptrend breaks above the 50-day EMA, XLM prices may rechallenge for dominance at $0.142.
Psychological Mark at Risk: A downfall below the 200-day EMA could endanger the $0.10 psychological mark, possibly reaching $0.094.
XRP + XLM Local trend. Wedge + triangle (pennants).Logarithm. Time frame 1 day. Local trend.
Two cryptocurrencies are shown at the same time, as it should be understood that it is one and the same. Pumps (exit from accumulation) similarly began almost simultaneously July 13 on day 273 (code). XRP a little earlier by a few hours. I think it will be something similar this time.
Pullbacks after pumping up about +100% on both assets (exiting the long term accumulation zone). The reversal zones as well as the percentages to local significant resistance levels in case of breakout are shown on the chart.
This is how it looks on the linear without squeezes (market noise), although it is not necessary for local work.
The ideas of secondary trends (accumulation) to understand this local zone attached to this idea.


Watching Fibonacci LevelsPrice has bounced off of 50% retracement level. The upside reaction to the drop hasn’t been strong. If we don’t get a strong bounce to the upside anytime soon, I’ll be looking at 61.8% retracement level.

Stellar Lumens Fractal to $4.00XLM has not put in a new ATH in 4.5 years.
XLM has been in a bear market for 65 weeks.
We await the light.
1X10^(-27)LM

Stellar XLM 30% rangexlm has been bullish since xrp case win. It has created a range it is currently trading in which have marked on chart 30% we are not at the bottom right now but we may go up from here stochastics are what to whatch

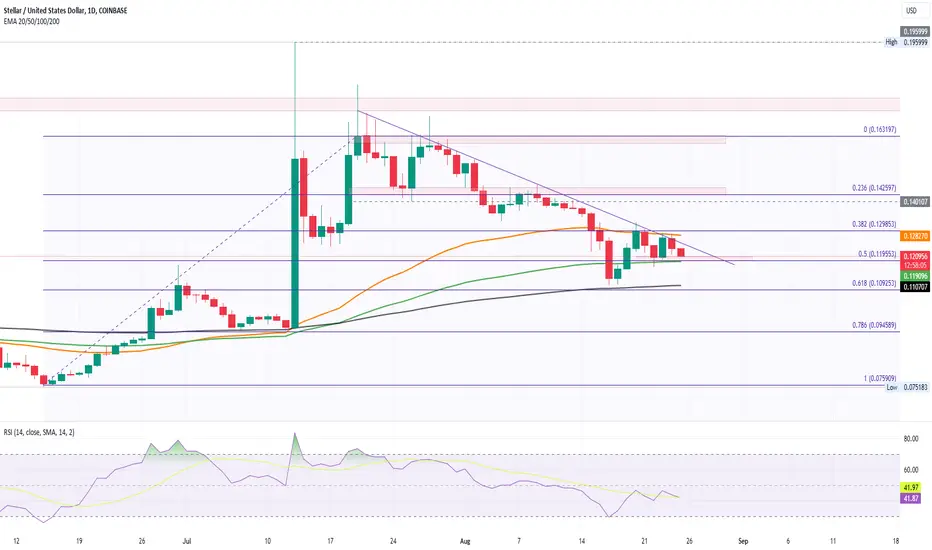
Retest Phase Warns Bearish Turn In Stellar Price Trend!
Intraday Fall of 1.70%: Stellar's price starts a post-retest downtrend with this fall, completing an evening star pattern, indicating a rise in bearish sentiment.
Downtrend Testing Bullish Confidence: The downtrend is set to test bullish confidence at the confluence of the 50-day EMA and the 23.60% Fibonacci level, gaining momentum.
Slightly Bearish Technical Indicators: Both MACD and RSI trends are declining, while the 50 and 200-day EMA sustain a positive trend, but rising selling pressure may affect them.
Potential Challenge to 50-day EMA: The growth in selling may soon challenge the 50-day EMA at $0.129, and a bearish outcome could extend the downtrend to the 50% Fibonacci level at $0.119, a nearly 15% drop.
Possibility of Positive Recovery: If there's a recovery with lower price rejection, Stellar's price may remain above $0.14, potentially bouncing back to $0.16 for a new bullish breakout attempt.
Warning of Bearish Turn: The retest phase and the current patterns warn of a possible bearish turn in the Stellar price trend, making it crucial for traders to watch key support and resistance levels.

$XLM Targets 21¢- CUPDATE & HANDLELSE:XLM targets 21¢ with a Cup n' Handle Pattern
The target is the distance from the bottom of the cup to the top of the cup.
A 1.618 fib level from the bottom of the cup to the top matches the C&H target.
1X10^(-27) LM ☕🍵
