Inv h&s on XLMUSD points to a .147 - .15 targetYou can see here on the 1 day chart xlmusd has formed an inverse head and shoulder pattern with it only just recently rounding out the 2nd shoulder and returning now back to the neckline. As always I must wait for a breakout confirmation above the neckline and some confirmation from volume before basing my buys off of this but I anticipate it will likely confirm in the not so distant future considering the recent move by coinbase to use stellar for USDC. I’m hoping to get a retracement too before a full breakout above the neckline in which case I will try to wisely piece meal buys on the dip. I have placed an arbitrary dotted measured move line where I think a potential breakout could occur in which case the target is somewhere aroun 14-15 cents. *not financial advice*
XLMBULLUSD trade ideas

XLMUSD Above the 1W MA200 for the first time in more than 1 yearStellar (XLMUSD) hit and broke today above the 1W MA200 (orange trend-line) for the first time since the week of May 02 2022. That's more than 1 year of trading below a key long-term Resistance that is now broken. The 1W MA50 (blue trend-line) has supported this price action for the past 2 weeks.
The time XLM hit the 1W MA200 during the previous Cycle, it failed to close the week above it and had a medium-term pull-back to the safety of the 1W MA50 before it started the final part of the parabolic rally from October 2020 to May 2021. Notice that the 1W RSI then was on the exact same (overbought) level it is today.
As a result, if it fails to close above the 1W MA200, we will wait for a pull-back to buy, preferably as close to the 1W MA50 as possible. If it closes above the 1W MA200 though, we will buy on the market price. In either case, we will target the top (Higher Highs trend-line) of the multi-cycle Triangle pattern at 0.7000.
-------------------------------------------------------------------------------
** Please LIKE 👍, FOLLOW ✅, SHARE 🙌 and COMMENT ✍ if you enjoy this idea! Also share your ideas and charts in the comments section below! **
-------------------------------------------------------------------------------
💸💸💸💸💸💸
👇 👇 👇 👇 👇 👇

Hallucination DefinedI don’t think the bottom is in. This market always manages to tear everyone apart before taking off. Price has a strong pre-established support at $0.026 and all it takes for the price to go from $0.098 to $0.026 is three big juicy red candles. Logarithmic regression line points to a target of $17-$20. I’ve also drawn an imaginary line as resistance for the target of the cycle. We need a $460 Billion Market Cap for a $17 XLM. I’m having hallucinations and I haven’t even taken any drugs, so don’t tell me to get off the crack pipe. I do not have a single logical reason to prove the price is gonna hit $17 but it’s fun to daydream. If we consider the last bull run from 2020 to be wave 1, then 1.618 level of wave 3 translates into a $17-$18 price target.


XLMUSDXlm getting ready to make a run and form another leg up accumilating at theses levels will be a good thing to do or cost average

Stellar short Bounceed at 0.817 trend changeDaily short
MACD short
Trendomat short
RSI short
Rising stelalr changed its bullish trend. Currently short.
As well as the bullish potential is existing, the current phase is bearish. A break below .6 will send staller the the southern
Stellar, XLM could hit $0.069 in 2023
Stellar’s price prediction for the most bearish scenario will value XLM at $0.066 in 2023
Stellar’s previous All Time High was on 3rd January 2018 where XLM was priced at $0.87
Stellar’s price at the same time last week was $0.083. It has moved by -0.46% in the past week and is currently at $0.082. Infact, in the past 24 hours, XLM has pumped by 3.42%. There is a slight bearish sentiment in the crypto market. The long term sentiment, however, remains bullish and XLM could hit $0.11 in 2024.
The total circulating supply of Stellar as of writing this article was $26905815993.48 and the marketcap of XLM remains at $2,230,347,134.
From April 2022 to March 2023, the price has dropped significantly from $0.23 in April 2022 to the current price, which is $0.08. The lowest trading price for the token during this period was $0.07. The price also proved to be a good support level which is yet to be broken.
$0.09 established itself as a significant resistance level which was tested twice. For the most part, the token continued to trade between the range of $0.12 to $0.08. The current price of $0.08 has been a good support level as well, which was also tested in November-December 2022 and is presently being retested.
The Relative Strength Index (RSI) stayed below the neutral 50 line as the selling pressure in the market continued to increase. Also, the On-Balance Volume (OBV) continued to descend as the price made lower highs and lower lows. With the price dropping consistently, the overall market sentiment has been bearish.
On the daily chart, the dominant trend remained bullish from January 2023. However, the price started taking a dip in February 2023. The RSI went below the neutral 50 line, indicating that the bears have been trying to push harder in the daily time frame as well. Recently, the price has seen a minor hike as the bulls have been trying to increase the buying edge.
See also the bullish scenario...
www.tradingview.com

Stellar 4Hr Chart XLMUSDPrice is above the middle line of a daily up channel
Possible move back down towards a dominant trend line and then continuation up from there
Bars pattern illustrating a guessed structure.

Stellar (XLM)We have seen from Stellar in the past that after a triangular pattern ended, an impulse uptrend wave started. Now, a similar pattern has ended, and it seems an impulse wave has started. Let's see if Stellar can reach high or not.

XLMUSD Buy the next pull back and target 0.11450Stellar / XLMUSD is having the strongest 1day candle since March 21st, which was the bullish break out candle half way of the uptrend leg that peaked at 0.1145 on April 1st.
That sequence pulled back first to the 1day MA50 before completing the end of March rally.
With the 1day RSI deep into the overbought zone, it is highly likely to see a repeat of this scenario.
Buy the next pull back and target 0.11450 (Resistance A).
Follow us, like the idea and leave a comment below!!

XLMUSD - Ascending triangle with first target .1169 and .199XLM has formed a ascending triangle and appears to be targeting the top of the range once more at .1169
A break above and successful retest of the top at .1169 will open a path for further movement to .199

XLM in clear accumulation zones with a possible upshot #XLM in clear accumulation zones with a possible upshot to prior retracements with BULLISH breakouts possible. This has little to do with XRP or #BTC; it's mainly about XLM being paired with #USDC on #COINBASE. I'm filling bags.

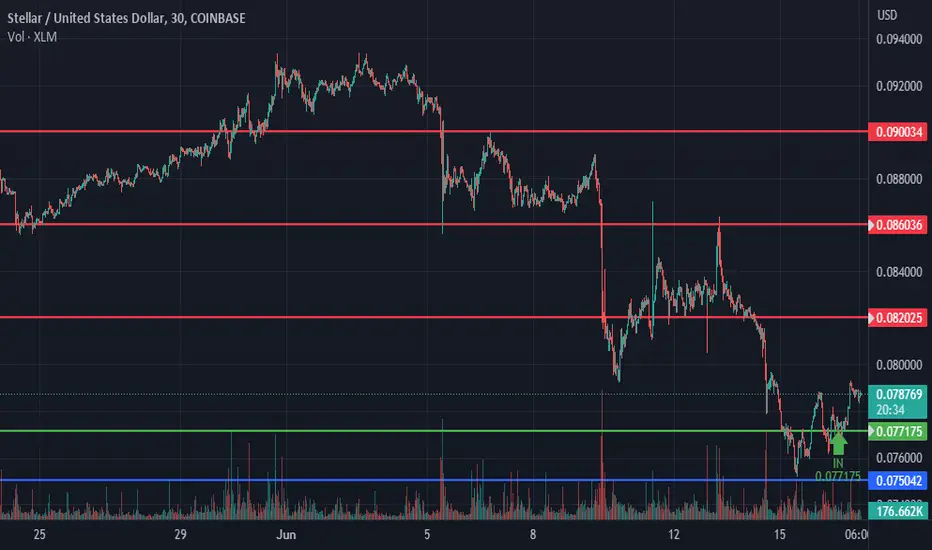

XLM 6/16/23 IN @I got in @ $0.077175
I will get out @ $0.082
measured move! 6.33%
lol smokey smokey :)


Reversal Potential on $XLM: Falling Wedge PatternHello, Traders! Today, I want to share an exciting technical analysis finding on the cryptocurrency Stellar Lumens ( LSE:XLM ). A falling wedge pattern has been identified, indicating the potential for a bullish reversal in the near future. Let's dive into the details!
📈 Ticker: LSE:XLM
📅 Timeframe: Daily Chart
📊 Pattern: Falling Wedge
📉 Understanding the Falling Wedge Pattern:
A falling wedge is a bullish chart pattern characterized by converging trendlines that slope downward. Typically formed during a downtrend, it suggests diminishing selling pressure and the potential for a reversal. This pattern indicates the possibility of an upward price movement.
🔍 Identifying the Falling Wedge on LSE:XLM :
Upon analyzing the daily chart of LSE:XLM , the following observations come to light:
1️⃣ Recent downtrend: LSE:XLM has experienced a decline in price over the past weeks.
2️⃣ Converging trendlines: The upper trendline connects the lower highs, while the lower trendline connects the lower lows.
3️⃣ Decreasing trading volume: As the falling wedge pattern forms, the trading volume has been declining, indicating a potential reduction in selling pressure.
📈 Price Targets and Trading Strategy:
If the falling wedge pattern on LSE:XLM plays out as anticipated, a potential bullish breakout above the upper trendline may occur, leading to a reversal and potential price appreciation. Consider the following price targets:
1️⃣ Target 1: Resistance level near $0.40
2️⃣ Target 2: Psychological resistance near $0.50
🛡️ Risk Management:
Managing risk is crucial for successful trading. Implement the following risk management techniques:
1️⃣ Set a stop-loss order below the lower trendline to protect against unexpected price movements.
2️⃣ Adjust position size based on your risk tolerance and overall portfolio management strategy.
🔔 Conclusion:
Keep a close eye on Stellar Lumens ( LSE:XLM ) as it develops this falling wedge pattern. The pattern suggests the potential for a bullish reversal on the horizon. However, please note that technical analysis is not infallible, and market conditions can change rapidly. Combine this analysis with other relevant factors before making any trading decisions.
Disclaimer: This post is for informational purposes only and should not be considered as financial advice. Always conduct your own research and consult with a qualified financial professional before making any investment decisions.
Happy Trading! 📈💰
#tradingview #technicalanalysis #fallingwedge #bullishreversal #xlm #cryptocurrency #chartpatterns #tradingstrategies #investing #finance #marketanalysis

AW - CRYPTO MARKET UPDATE - I Told You To Be Careful...Welcome to the AriasWave market update, where we dive deep into the world of Cryptos and the Dow Jones, providing you with valuable insights and thoughts.
Through my meticulous analysis, you'll quickly realize the weight and accuracy behind my predictions. Unlike anywhere else, you'll find unique and unparalleled analysis in my videos, unlike the poorly informed content from other providers.
By following my work, you'll not only save yourself from potential losses but also safeguard your capital. When the time is right and I give the green light, you'll be ready to make significant moves that can change your life.
Don't miss out on the upcoming life-changing events. Stay tuned and be prepared for what lies ahead.


XLMI mainly rely on historical data in my analyses. I have many visions, and I share them with you. In addition, I think that it is possible that XLM is a very promising coin, but sometimes I think that it requires too much time and effort to stand by it :) I wish you success and share my analysis with you.

6/10/23BEAR MODE! OVER SOLD! RED CANDLES & GREEN CANDLES!
4.20% move! lol
be careful catching knifes! lol

XLMHello, the price of Stellar in the weekly time frame with a medium-term view is suitable for investment.

Stellar XLM to $33. Loooong.1. Franklin Templeton
2. United nations refugees
3. Moneygram rails
4. Ukraine and other CBDC's
5. Elon Jed partnership to make X
Only if you gots the eyes to see.

XLMUSD (1H) - Bullish breakoutHi Traders
XLMUSD (1H Timeframe)
The market is in an uptrend, and we are waiting for an entry signal to go LONG above the 0.0917 resistance level. Only the downward break of 0.0895 would cancel the bullish scenario.
Trade details
Entry: 0.0917
Stop loss: 0.0895
Take profit 1: 0.0931
Take profit 2: 0.0953
Score: 8
Strategy: Bullish breakout
