XLM - HVF - 1.4$ targets mid-end of 2025. A huge HVF setup on XLM on weekly. Similar to TRX and XRP.
conservative target 1.4$, time frame May-Jul most probably or by the end of the year.
XLMBULLUSD trade ideas

XLM will rise 100%+When IDK lol
I am watching & waiting to get back in XLM
It needs to hold above the support line @ 0.32

XLM/USD: DEADLINE-DRIVEN SETUP The XLM/USD pair is progressing toward our key target of 0.44302, aligning with the projected market behavior. We’re monitoring the price action closely up to Feb 9 to see if it confirms our forecast.
Trade execution has been precise so far—let’s watch how this one plays out.
Feel free to replay all trades on TradingView for verification.
#Crypto #XLMUSD #MarketAnalysis #TradingStrategy

If you're struggling to find faith/trust in Crypto. lately
Lately, I have been a bit over Cryptocurrency, up and down and fake movements around charts, but I guess its a part of trading.
I currently have only 2 position's, Doge & Hbar I had to let go earlier today.
So, this new one is Stellar Lumens XLMUSD & it really is stellar, one of the biggest runners yesterday, up something like 7 or 8%.
It's obedient and loyal (so far) and take a look at the fantastic daily chart. On the left it looks like a bullish flag and it got support at the 200 before it broke out. I know its a bearish wedge but its very bullish the chart imo.

XLM/USD: Weak Momentum with Key Support at Risk🔥 FinCaesar Strategy:
🩸 Short: Below $0.39, targeting $0.38 and $0.36. MACD remains weak, and the price is facing rejection near key moving averages.
🩸 Long: Above $0.40, aiming for $0.42 and $0.45. Bulls must generate strong buying volume to break resistance.
🔥 FinCaesar Commands:
🩸 Resistance: $0.40 — A breakout above this level could push XLM toward $0.42 and higher.
🩸 Support: $0.39 — Losing this level may result in a drop toward $0.38 or lower.
Stellar is struggling to gain momentum, hovering near key support. MACD is weak, indicating hesitation among buyers. A move above $0.40 is necessary for bullish continuation, while a breakdown below $0.39 could lead to further downside pressure.
👑 "Fortune belongs to those who act when others hesitate." — FinCaesar

Testing Top range potential shortI'm looking at XLM as longer-term bearish, with a good short entry here as it has pulled back into resistance zone and started moving down again.

XLM trade idea 01-16-2025Not financial advice! Not a professional! Just trying to learn! lol
I will try to get in around 0.420 lol
XLM needs to hold the support line around 0.322 lol
XLM will break all-time highs!
100%+ move!
XLM RISE!

XLM/USD "Stellar vs US Dollar" Crypto Market Bearish Heist Plan🌟Hi! Hola! Ola! Bonjour! Hallo!🌟
Dear Money Makers & Robbers, 🤑 💰
Based on 🔥Thief Trading style technical and fundamental analysis🔥, here is our master plan to heist the XLM/USD "Stellar vs US Dollar" Crypto market. Please adhere to the strategy I've outlined in the chart, which emphasizes short entry. Our aim is the high-risk Green Zone. Risky level, oversold market, consolidation, trend reversal, trap at the level where traders and bullish robbers are stronger. 👀 Be wealthy and safe trade.💪🏆🎉
Entry 📉 : Traders & Thieves with New Entry A bull trade can be initiated at any price level.
however I advise placing sell limit orders within a 15 or 30 minute timeframe. Entry from the most recent or closest high level should be in retest.
Stop Loss 🛑: Using the 2h period, the recent / nearest high level.
Goal 🎯: 0.38666 (OR) Before escape in the bank
Scalpers, take note : only scalp on the Short side. If you have a lot of money, you can go straight away; if not, you can join swing traders and carry out the robbery plan. Use trailing SL to safeguard your money 💰.
Fundamental Outlook 📰🗞️
The XLM/USD (STELLAR vs U.S Dollar) market is expected to move in a bearish direction, driven by several key factors.
Fundamental Analysis
1. Decreasing Trading Volume: XLM's trading volume has been decreasing over the past few months, indicating a lack of interest from traders and investors.
2. Stagnant Price Action: XLM's price has been stuck in a narrow range for several months, failing to break out or show any significant upward momentum.
3. Low Network Activity: Stellar's network activity, such as transaction count and block creation, has been relatively low compared to other blockchain networks.
Macro Analysis
1. Competition from Other Cryptocurrencies: Stellar faces intense competition from other cryptocurrencies, such as Ripple, Bitcoin, and Ethereum, which have larger market capitalizations and more established ecosystems.
2. Regulatory Uncertainty: The regulatory environment for cryptocurrencies is still unclear in many countries, which can create uncertainty and hesitation among investors and users.
3. Lack of Institutional Investment: Despite some partnerships and collaborations, Stellar has yet to attract significant institutional investment, which is necessary for long-term growth and adoption.
Market Sentiment
1. Bearish Trader Sentiment: The sentiment among traders is currently bearish, with many expecting the price to decrease in the short term.
2. Low Retail Interest: Retail interest in XLM has been waning, with fewer investors and traders showing interest in the cryptocurrency.
3. Negative Social Media Sentiment: Social media sentiment towards XLM has been negative, with many users expressing disappointment and frustration with the cryptocurrency's performance.
Upcoming Events
1. Potential Regulatory Crackdown: There is a risk of a regulatory crackdown on cryptocurrencies, which could negatively impact XLM's price and adoption.
2. Competition from New Cryptocurrencies: New cryptocurrencies and blockchain projects are emerging, which could potentially compete with Stellar for users and investors.
3. Technical Challenges: Stellar's network has faced technical challenges in the past, such as congestion and scalability issues, which could impact its performance and adoption.
Sentiment Analysis:
Overall Sentiment:
Bearish (60%)
Sentiment Breakdown:
- Bearish: 60%
- Negative sentiment driven by decreasing trading volume, stagnant price action, and low network activity.
- Neutral: 25%
- Mixed sentiment due to uncertainty around regulatory environment and lack of institutional investment.
- Bullish: 15%
- Positive sentiment driven by potential for partnerships and collaborations, and optimism around Stellar's technology.
Market Sentiment Indicators
- Trader Sentiment: Bearish (55%)
- Retail Sentiment: Bearish (62%)
- Social Media Sentiment: Bearish (58%)
- News Sentiment: Neutral (50%)
Technical Analysis Indicators
- Moving Averages: Bearish (60%)
- Relative Strength Index (RSI): Neutral (50%)
- Bollinger Bands: Bearish (55%)
Trading Alert⚠️ : News Releases and Position Management 📰 🗞️ 🚫🚏
As a reminder, news releases can have a significant impact on market prices and volatility. To minimize potential losses and protect your running positions,
we recommend the following:
Avoid taking new trades during news releases
Use trailing stop-loss orders to protect your running positions and lock in profits
Please note that this is a general analysis and not personalized investment advice. It's essential to consider your own risk tolerance and market analysis before making any investment decisions.
Keep in mind that these factors can change rapidly, and it's essential to stay up-to-date with market developments and adjust your analysis accordingly.
💖Supporting our robbery plan will enable us to effortlessly make and steal money 💰💵 Tell your friends, Colleagues and family to follow, like, and share. Boost the strength of our robbery team. Every day in this market make money with ease by using the Thief Trading Style.🏆💪🤝❤️🎉🚀
I'll see you soon with another heist plan, so stay tuned 🫂

XLMUSD: Classic Long From Support
XLM looks bullish after a test of a key support.
The price broke and closed above a resistance line of a falling
wedge pattern on a 4H time frame.
The coin may continue rising at least to 0.4527 level.
❤️Please, support my work with like, thank you!❤️

XLM Elliott Wave AnalysisIm very bullish on $XLM!
I think we are currently stuck in a small a-b-c correction (marked in yellow), since 4th January. Seemingly this correction should soon be finished and the price can start soaring again.
The RSI is showing downtrend weakness on th 8h and 4h timeframe and looks like its getting ready to eventually break out of the red rsistance line.
I expect the price to turn around in the small yellow box.

Stellar Vavescurrently in 5th vave
Leading diagonal vave 1 complete
vave 2 looks complete
next is vave 3
target for 5th vave around $3 in March
NFA
profitable entertainment

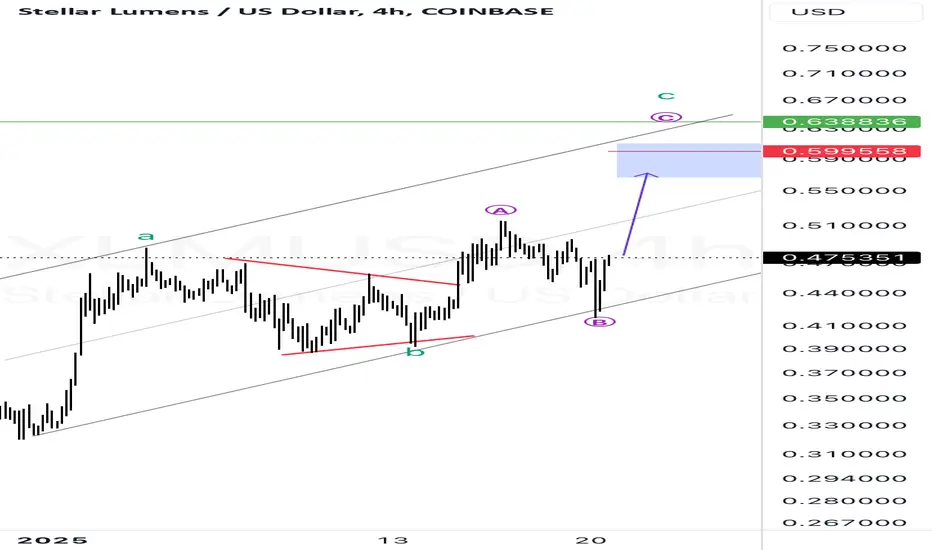
XLM still got momentum?From my point of view, stellar still got another momentum to complete the last swing of correction B Large degree before it will take place for downward correction of C Large degree. If the price break upside of the FIB channel, means its got strong bullish and my analysis is invalidate.TAYOR
P/s : Not a financial advisor, Im here to share analysis based on my POV. It can be right or wrong.
XLM still got momentum?In my point of view, Stellar still got a momentum bullish to complete the last swing before continue correction downward. But, If price continue break upside of the fib channel, means strong bullish in action. Need an exit plan if the price reversal at the edge of the fib channel. TAYOR
P/s: Not a financial advisor, it’s only my analysis, it could be wrong or right.

XLM/USD "Stellar vs U.S Dollar" Crypto Market Bullish Heist Plan🌟Hi! Hola! Ola! Bonjour! Hallo!🌟
Dear Money Makers & Robbers, 🤑 💰
Based on 🔥Thief Trading style technical and fundamental analysis🔥, here is our master plan to heist the XLM/USD "Stellar vs U.S Dollar" Crypto market. Please adhere to the strategy I've outlined in the chart, which emphasizes long entry. Our aim is the high-risk Red Zone. Risky level, overbought market, consolidation, trend reversal, trap at the level where traders and bearish robbers are stronger. Be wealthy and safe trade.💪🏆🎉
Entry 📈 : You can enter a Bull trade at anypoint,
however I advise placing Buy limit orders within a 15 or 30 minute timeframe. Entry from the most recent or closest low or high level should be in retest.
Stop Loss 🛑: Using the 2H period, the recent / nearest low or high level.
Goal 🎯: 0.55000 (or) Escape Before the Target
Scalpers, take note 👀 : only scalp on the Long side. If you have a lot of money, you can go straight away; if not, you can join swing traders and carry out the robbery plan. Use trailing SL to safeguard your money 💰.
Warning⚠️ : Our heist strategy is incompatible with Fundamental Analysis news 📰 🗞️. We'll wreck our plan by smashing the Stop Loss 🚫🚏. Avoid entering the market right after the news release.
Fundamental Outlook 📰🗞️
Considering these factors, the XLM/USD pair may experience a Bullish trend in the short-term, driven by:
Growing adoption and usage of XLM for cross-border payments and remittances.
Increasing demand for fast and low-cost digital payments, driven by growing global trade and commerce.
Favorable regulatory environment, driven by growing recognition of the benefits of cryptocurrencies and blockchain technology.
🐂Bullish Factors:
Growing adoption and usage of XLM for cross-border payments and remittances.
Increasing demand for fast and low-cost digital payments, driven by growing global trade and commerce.
Favorable regulatory environment, driven by growing recognition of the benefits of cryptocurrencies and blockchain technology.
Growing interest in blockchain technology and its applications, driven by its potential to increase efficiency and reduce costs.
Increasing investment in XLM and other cryptocurrencies, driven by their potential for long-term growth and returns.
Market Sentiment:
Bullish sentiment: 75%
Bearish sentiment: 25%
Neutral sentiment: 0%
Please note that this is a general analysis and not personalized investment advice. It's essential to consider your own risk tolerance and market analysis before making any investment decisions.
Take advantage of the target and get away 🎯 Swing Traders Please reserve the half amount of money and watch for the next dynamic level or order block breakout. Once it is resolved, we can go on to the next new target in our heist plan.
Keep in mind that these factors can change rapidly, and it's essential to stay up-to-date with market developments and adjust your analysis accordingly.
💖Supporting our robbery plan will enable us to effortlessly make and steal money 💰💵 Tell your friends, Colleagues and family to follow, like, and share. Boost the strength of our robbery team. Every day in this market make money with ease by using the Thief Trading Style.🏆💪🤝❤️🎉🚀
I'll see you soon with another heist plan, so stay tuned 🫂


Stellar (XLM) Price Breakout Fuels 30% Surge Hopes
Stellar Lumens (XLM), the cryptocurrency designed to facilitate fast and low-cost cross-border payments, has recently shown signs of a potential breakout, sparking speculation about a significant price surge. After a period of relative stagnation, XLM has demonstrated renewed momentum, capturing the attention of traders and investors alike. This article delves into the factors contributing to this potential breakout, examines technical indicators, and explores whether a 30% surge is a realistic possibility.
Stellar’s core mission is to provide an efficient and inclusive financial ecosystem, particularly for underserved populations. It aims to streamline international transactions, making them faster, cheaper, and more accessible than traditional banking systems.1 This focus on real-world utility has always been a strong foundation for XLM, and recent developments suggest this utility is beginning to translate into market action.
Factors Driving the Potential Breakout:
Several factors contribute to the current bullish sentiment surrounding XLM:
• Increased Network Activity: A key indicator of a healthy blockchain network is its level of activity. Recent data suggests a significant uptick in transactions on the Stellar network. This increased usage indicates growing adoption and demonstrates the platform’s real-world utility. This increased activity could be attributed to new partnerships, integrations with existing financial institutions, or the organic growth of its user base.
• Growing Institutional Interest: While not as prominent as Bitcoin or Ethereum, Stellar has been quietly attracting institutional interest. Its focus on regulated financial services and its compliance-friendly approach make it an attractive option for institutions seeking to explore the potential of blockchain technology. Increased institutional involvement often translates to larger trading volumes and can significantly impact price action.
• Favorable Regulatory Landscape: The regulatory landscape for cryptocurrencies is constantly evolving. Positive regulatory developments, particularly those related to cross-border payments and digital assets, can create a favorable environment for projects like Stellar. Clearer regulations can foster greater confidence among investors and encourage wider adoption.
• Technical Indicators: From a technical analysis perspective, XLM has shown promising signs. Recent price action has seen XLM break through key resistance levels, suggesting a shift in momentum.2 Trading volume has also increased, further supporting the bullish narrative. Several technical indicators, such as moving averages and relative strength index (RSI), point towards a potential upward trend.
• Focus on Decentralized Finance (DeFi): While Stellar isn't primarily known for DeFi, the network has seen increasing development in this sector. The growth of DeFi applications on Stellar could attract new users and capital to the ecosystem, further driving demand for XLM.
Technical Analysis and Price Prediction:
Analyzing XLM's price charts reveals a potential breakout pattern. The price has been consolidating within a defined range for a period, and the recent break above this range suggests a potential shift towards an upward trend. This breakout is further supported by increased trading volume, indicating strong buying pressure.
Several technical indicators suggest a bullish outlook:
• Moving Averages: The price of XLM has crossed above key moving averages, such as the 50-day and 200-day moving averages, which are often interpreted as bullish signals.
• Relative Strength Index (RSI): The RSI, a momentum indicator, is showing increasing strength, indicating growing buying momentum.
• Volume: The increased trading volume accompanying the price breakout provides further confirmation of the bullish trend.
Based on these technical indicators and the current market momentum, a 30% surge is a plausible scenario. However, it’s crucial to remember that the cryptocurrency market is highly volatile, and price predictions are not guaranteed.3 Several factors could influence XLM’s price action, including overall market sentiment, regulatory developments, and competition from other cryptocurrencies.
Is a 30% Surge Realistic?
While the technical indicators and fundamental factors suggest a potential for significant price appreciation, a 30% surge should be considered a potential target rather than a certainty. The cryptocurrency market is known for its volatility, and unforeseen events can quickly change market sentiment.4
Conclusion:
Stellar’s XLM is showing promising signs of a potential breakout. Increased network activity, growing institutional interest, favorable regulatory developments, and positive technical indicators all contribute to the bullish sentiment. While a 30% surge is a realistic possibility based on current trends, investors should exercise caution and conduct thorough research before making any investment decisions. The cryptocurrency market is highly volatile,5 and it’s essential to manage risk effectively.6 However, the current momentum surrounding XLM suggests that the project is well-positioned for future growth and could offer significant potential for investors. The focus on real-world utility and the development of the Stellar ecosystem continue to be key factors to watch in the coming months.

xlm We start a new year with xlm This price channel pattern is still rising around these points
Keep calm in the buying positions and take profits with each step or invest in the medium term as the market is still rising

XLM 4-hour .. Run ChartNow that the trade is active, I will be watching specific patterns to identify whether to stay in the trade, or exit.
I have place bold Violet color lines for trajectory PA that is going in a favorable direction to stay in the trade.
There are all the different Fib lines color coded to identify specific areas of support and resistances.
One problem is the Daily indicators are on the downhill run. I am (with great Hopium) expecting another express way upwards in PA.
However all the lower time frames are trying to turn the PA into a positive direction and if so... then this temporary bottom is in and may our trade bring us a decent ROI.
Good luck

XLM ready to blast ??XLM is showing all possible reasons to get into it ... short trade with 20% run ... I see it is forming Inverted head and shoulder ... Range breakout ....
Keep learning and Keep Earning
GK trad Manthan

Perfect Entry for an early breakoutYo! This is a perfect example of when to buy an early breakout. I say early because for sake of risk, buying new highs coming off long built bases is ideal. It could retest the range or potentially even fall back into the pattern if volume and strength can't dance with price. This is a great longer hold to have in a 2025 portfolio.
Thank you for your time and happy trading!
OnePath

Hourly hopeful Break OutIn the Short term on the Hourly Chart, we have a possible breakout of the ascending triangle. If we get a breakout to the upside there is a strong possibility of positive price action, and vice versa if we get a breakout to the downside. Please be so kind to look at the chart and see the key levels and the consolidation pattern(s).

MACD FALSE SIGNALS WHEN THE MARKET IS RANGINGYOOOO!!!!!
I found this MACD/IMPULSE MACD video on youtube (1.6 million views in 1 year) and was able to put it to work right away. Shows how the MACD can send false signals when the market is ranging. But a few adjustments to the Impulse MACD will make it literally flatline telling you to "stay out" of any positions. I attached the link below.
Check out my chart and let me know what ya think ! Any questions ,constructive criticisms ,happy thoughts, funny thoughts, tips, tricks, advice, adjustments, corrections yada yada yada is always appreciated
Cheers!!!!
www.youtube.com
These guys
www.youtube.com

XLM/USDT Long🟢 #XLM #DoubleBottom #Long
The chart shows a clear double bottom formation, a classic reversal pattern that often signals a potential bullish move. The neckline breakout gives a potential 9% upside to the target zone near $0.437390.
Key reasons for this trade:
Double Bottom Formation: This pattern is reliable and often results in bullish price action after the neckline breakout.
RSI: Currently sitting near 50, suggesting neutral momentum with room to move higher without being overbought.
MACD: Histogram flipping bullish and signal lines crossing upwards, indicating increasing bullish momentum.
Market Context: BTC futures longs are up, so a short-term dip for liquidation could occur, but overall sentiment remains supportive for altcoins like XLM.
📉 Risk Management:
Use a tight stop loss below $0.385 to protect capital in case of invalidation.
Always assess position size and risk per trade to avoid overexposure.
📈 Target: $0.437390 for approximately 9% profit.
🛑 Disclaimer: This is not financial advice. Always do your research and trade responsibly!
