XLMBULLUSD trade ideas

Stellar XLMThese are levels that I'll be keeping an eye on when dealing with XLM/USD, and I'll revise as price action progresses.
I adapt to the change in money flow.
It's currently in a ascending channel which typically mean we will more than likely see a break in structure to the downside. If that were to happen then it'll be some great buying opportunities presenting themselves at certain price points.

XLMUSD Accumulation almost over. Look for a 1D MA200 break.Stellar got rejected at the end of December on the 1D MA200 (orange trend-line) and that stopped the rebound from developing into a full rally sequence. That is the Resistance to beat if XLM wants to see a new bullish phase. Practically the pattern from late June until now seems like a giant Accumulation Phase and both in price action and 1D RSI terms is similar with that of April - November 2020.
It was a 1D Death Cross (MA50 crossing below the MA200) that started the Accumulation Phase and another that priced its bottom and ended it. The Golden Cross (MA50 crossing above the MA200) was formed on the peak of the first price rally, so it just confirmed it. Right now XLMUSD is coming off that second Death Cross, so we can argue that the bottom may already be priced in. The confirmation however will come in my opinion once the 1D MA200 breaks, so if you don't want to risk buying now, then buy upon a break-out.
--------------------------------------------------------------------------------------------------------
** Please support this idea with your likes and comments, it is the best way to keep it relevant and support me. **
--------------------------------------------------------------------------------------------------------


XLM - Potential Bullish Reversal!Hello everyone, if you like the idea, do not forget to support with a like and follow.
XLM is approaching a strong support in green so we will be looking for buy setups.
on H4: XLM is forming a channel in red but the upper trendline is not valid yet, so we are waiting for a new swing high to form around it to consider it our trigger swing. (projection in purple)
Trigger => Waiting for that swing to form and then buy after a momentum candle close above it (gray zone)
Meanwhile, until the buy is activated, XLM would be overall bearish can still trade lower inside the support before going up.
Good luck!
All Strategies Are Good; If Managed Properly!
~Rich

Stellar XLM is picking up.It looks like during this weekend altcoin season will start.
Target is based on fibo 4.236 extension from previous bull run.

XLMUSD Price DropsXLM has a bearish sentiment due to a bearish candle structure.
0.270078 is the nearest support level for price.
.
Khiwe
On this profile page, the shared analysis, ideas, and also, the strategy of a chart belong to Khiwe with some being influenced. The technical set-ups are speculative, they are not guaranteed for accuracy or completeness in the form of any content; it is not to advise on financial markets. Please apply your own analysis and confirm it with price action.

XLMUSDT possible scenerio.For educational purposes only.
I have attached all the reading and i see a possible cypher pattern in play (2nd chart)...
DYOR before investing.
Goodluck

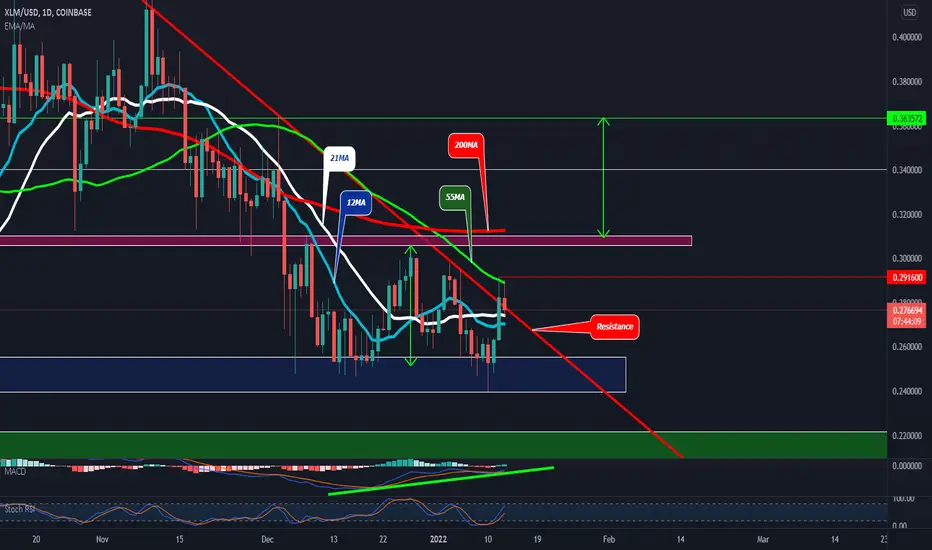
XLM - Bouncing Between Its 55MA And 21MAHope you find value from this post.
Here's a trading idea.
But firstly...
==============================
Quick Disclaimer:
Trade at your own risk. This post/chart is for your reference only, it is not intended as a recommendation, nor is it an advice to sell nor buy this crypto asset, nor to place any trade.
Trading poses a risk of losing some or all of your money and it will be your responsibility if you lose money.
==============================
XLM got pushed down from the 55MA, it's currently between the 55MA and the 21MA, and could find support from the Red Extended Trend Line which was previous resistance.
Today's first order of business is to push past 2916 and close above its 21MA and 55MA.
The 12MA is at 2700
MACD: Bullish Divergence.
Stoch RSI: Headed for the 80 Level, momentum still Bullish.
Always remember to place your Stop Loss.
Price action is KING!
More power to all your trades, my friends!
Ron
Intrepid_Trader
ARIASWAVE - BITCOIN - XLMUSD UPDATE - The Bear Market Continues.In this video I simply present an update which is not much different than my previous views on these Cryptos.
Not much has changed and I am still expecting a deep correction that is only getting started.
You will no doubt have noticed that there has not been any meaningful bounce suggesting further upside.
Whether you are bullish or not AriasWave merely gives you the perspective you need to hear not just the one you want to hear.
Stay tuned for more updates coming soon.
Remember to use Disciplined Money Management Principles to ensure longevity as a trader.
If you don't know the long term pattern shouldn't you be doing your research instead of just following the crowd?
Just remember: I am not a financial advisor, I suggest using this only as a guide. Always do your own research.

XLM at deep value Target moon ($40)1. partnership with MGI creating amazing on/off ramps
2. Partnership with IBM; world wire using stellar
3. Stellar testified to congress
4. non profit
5 Ukraine CBDC on stellar network
6. AMM constant product on layer 1. Only one.
This is the way.

Stellar (XLM) - January 13Hello?
Welcome, traders.
If you "follow", you can always get new information quickly.
Please also click "Like".
Have a nice day.
-------------------------------------
(XLMUSD 1W Chart)
Support section: 0.18554008-0.23669590
If it declines from the 0.16420803 point, there is a possibility of entering the mid- to long-term investment area, so you need to trade cautiously.
It should move above the 0.33900755 point to continue the uptrend.
As such, it is necessary to check if the trend is moving upwards along an uptrend line.
Above the 0.40293161 point is the high-end section, so there is a possibility of finding resistance in the 0.44131920-0.49247902 section.
If the decline is from the 0.44131920-0.49247902 section, you should check to see if there is support near the 0.40293161 point.
If it falls from the 0.40293161 point, you need a short-term Stop Loss.
--------------------------------------
(XLMBTC 1W chart)
Box sideways section: 428 Satoshi-1288 Satoshi section
It should move above the 746 Satoshi point to see if it can turn into an uptrend.
------------------------------------------
We recommend that you trade with your average unit price.
This is because, if the price is below your average unit price, whether the price trend is in an upward trend or a downward trend, there is a high possibility that you will not be able to get a big profit due to the psychological burden.
The center of all trading starts with the average unit price at which you start trading.
If you ignore this, you may be trading in the wrong direction.
Therefore, it is important to find a way to lower the average unit price and adjust the proportion of the investment, ultimately allowing the funds corresponding to the profits to be able to regenerate themselves.
------------------------------------------------------------ -------------------------------------------
** All indicators are lagging indicators.
Therefore, it is important to be aware that the indicator moves accordingly with the movement of price and volume.
However, for convenience, we are talking in reverse for the interpretation of the indicator.
** The MRHAB-O and MRHAB-B indicators used in the chart are indicators of our channel that have not been released yet.
(Since it was not disclosed, you can use this chart without any restrictions by sharing this chart and copying and pasting the indicators.)
** The wRSI_SR indicator is an indicator created by adding settings and options to the existing Stochastic RSI indicator.
Therefore, the interpretation is the same as the traditional Stochastic RSI indicator. (K, D line -> R, S line)
** The OBV indicator was re-created by applying a formula to the DepthHouse Trading indicator, an indicator disclosed by oh92. (Thanks for this.)
** Support or resistance is based on the closing price of the 1D chart.
** All descriptions are for reference only and do not guarantee a profit or loss in investment.
(Short-term Stop Loss can be said to be a point where profit and loss can be preserved or additional entry can be made through split trading. It is a short-term investment perspective.)
---------------------------------

XLM - Broke Resistance But Halted By The 50MAXLM bounced off the Blue Support Bar and pushed out of the Red Extended Resistance Trend Line.
It has now been met by the 50MA, and if XLM Bulls still have more steam to push upward they will be met by Purple Resistance Bar.
XLM pushing further upwards past the Purple Resistance Bar could fulfill a measured move to 0.36 which is about a 17% rise (minimum price target).
MACD: Bullish Divergence
RSI: Now above the 50% Level (Bullish)
If XLM gets rejected at the 50MA, the Red Extended Resistance Trend Line is the area of expected area to look for support.
Price action is KING!
More power to all your trades, my friends!
Ron
Intrepid_Trader

xlmusd buyxlmusd buy ... buy after the break above the resistance level and 200ma at 0.2858 ... macd helps ... finally target 0.3032

XLMUSD ❕ made a false breakoutXLM has made a false breakout.
I expect the price to return below the level and move to support.
Have a nice trade!
Your Solldy

Bullish or bearish?The 20 month moving average and the bottom of the cycle channel are being tested. Will bullish continuation follow or has the bearish market arrived? In previous conditions like this a bullish continuationed followed. Will this trend repeat or break?
This is for learning purposes only.

XLM possible head and shoulders bullish patterns the head and shoulders objective rules have been strictly met waiting for a pull back then an entry candle what do you think ?

XLM - Potential Bullish Reversal!Hello everyone, if you like the idea, do not forget to support with a like and follow.
XLM is approaching a strong support in green so we will be looking for buy setups.
on H4: XLM is forming a trendline in red but it is not valid yet, so we are waiting for a new swing high to form around it to consider it our trigger swing. (projection in purple)
Another scenario would be if the bulls take over from here by breaking above the current high. (projection in blue)
Trigger => Waiting for that swing to form and then buy after a momentum candle close above it (gray zone)
Meanwhile, until the buy is activated, XLM would be overall bearish can still trade lower till the lower.
Good luck!
All Strategies Are Good; If Managed Properly!
~Rich


XLM ON THE WEEKLY!! NOTHING HAS CHANGED! A CLEAR UNDERSTANDINGWhat up trader's, investors and all my moonboy Jimmy's and Kimmy's. Here is an update on XLM. My count changed slightly from my last analysis, but as of now, XLM does not want to break $.25 support. This is known as a higher low. On the BTC chart, Bitcoin doesn't seem to want to break 46k. Again, another higher low. I have labeled my 2 scenarios on this simple chart that I have laid out for you guys. There basically the same scenarios as my last analysis, however I labeled a larger ABC flat and what I believe is going to happen in the near future. Now, if Bitcoin breaks 42k, this whole analysis goes out the window. This is not financial advice and always remember to set your stop losses. A break below 42k on BTC will destroy the crypto market as it's target would be 30k. So far Xlm is holding strong and I'm really hoping we see a move to the upside real soon. I'm heavily invested in this coin since $.08 not only for long term , but l and opened up an additional 70,000 xlm long position at $.252 and so far I've not been stopped out. I feel I'm in a great position to make a killing if this thing takes off with minimal losses if it doesn't. Wish me luck. Happy holidays to everyone and be safe. Happy trading.


xlm longxlm long support and resist are marked were targeting .31 first, if this can be retested as support we could see a jump from there testing higher levels such as .4 .5
