XLM Stellar to 6If we just did 4 waves and we are soon entering the wave 5 the we could see a price target of 6. Just need to hold the last low. Trade save.
XLMBULLUSD trade ideas

XLM going to $0.15 and then crashing over 40% ( BELOW $0.10 !!!)Hey,
It's all in the chart.
- Please like/boost if you agree and comment as it encourages me to continue sharing my ideas - My thoughts are not financial advice - Consult with a registered investment advisor before making any investment.
Bye for now,
@BeYour0wnBank

XLM - The Ladder to HeavenXLM has enough energy to reach these highs at a staggering pace.
We emerge from the darkness only to find an endless light
Onwards and Upwards!
1×10^-27

$XLM STELLAR - .245 $USD Next TargetStellar now has Soroban powered smart contracts
PoW mining
Liquidity Protocols
Lending/Borrowing Protocols
Staking/ AMMs etc
Partnerships with
Franklin Templeton
MasterCard
MoneyGram
DTCC
Stripe via Bridge
and so much more
1×10^-27


ResistanceCan Stellar close above the weekly resistance which is label on the chart or will we see a reversal? Strangely on the day chart CM_Williams_Vix_Fix indicator is flashing green saying the bottom is in or close but on the weekly Stellar is facing a key level and CCI is very overbought, let us see what candle will print for the weekly tomorrow. We need another miracle

XLM inverse head & shoulders breaking out; target = .274182XLM.riding XRP’s coattails as usual. They seem to operate in tandem when they go nova, kinda like T Corona Borealis; XRP the red giant, and xlm the white dwarf. Stellar Ripples indeed.

stellarStellar is a decentralized, public blockchain that gives developers the tools to create experiences that are more like cash than crypto. The network is faster, cheaper, and far more energy-efficient than most blockchain-based systems. It’s designed so Stellar’s ecosystem can make a real-world, lasting impact.
CRYPTOCAP:XLM

Stellar?Stellar on the hour as good RSI and SRSI readings . It is above the 50 EMA, CCI is positive. Subjective upward parallel channel. Be careful this is an Hour TF

XLMUSD - Ongoing Correction Before Lumens Move Lower...In this video, I revisit the XLM analysis to share my latest insights on its current pattern as we brace for a potential global market crash in the coming months.
I anticipate a sideways correction in XLM over the next few weeks, setting up for a deeper move lower as part of the larger Wave A zig-zag pattern.
No opportunities have been missed in this crypto, as it likely hasn't performed the way many expected.
Despite the recent surge in Bitcoin, some are becoming overly bullish too soon. According to AriasWave analysis, Bitcoin is nearing its final move before a significant downturn.
I'll be tracking these developments closely to pinpoint those moments as they unfold.
This is not financial advice.

STELLAR (XLM): $0.16 | Fastest Alt Coin in the Universethere are great coins
there are ok coins
this one is anchored to BTC and XRP
when the formers make a move..
this STELLAR makes twice to thrice as much
this usually pumps ahead of the MARKET
and tracks MONERO as well when the PARTy is over
-
note
Handler loves to revisit 50% off the months RANGE
just maintain reserves at those levels
or secure capital for FUTURES Options players

FOUND A TREND LINE, CAN WE FOLLOW IT? Hopefully posting this does not kill my ta. Long time XLM guy glad to see us break above the 0.12 range.

XLM to .135 USD short termXLM is approaching a trendline that begins at the 2018 ATH
we should expect some resistance here and for short term traders this could be a good tp
if your a long time stellar holder, hang on, as you can see we there is about to be alot of upside in 2025

XLMUSD breaking up from double bottom/channel/invh&sThe target for the double bottom/channel is .1439 and the inv h&s target is slightly lower than that. I call this a Siamese inverse head and shoulders because it sort of has 2 heads in between the shoulders. Golden cross appears to be just.a few candles away . *not financial advice*

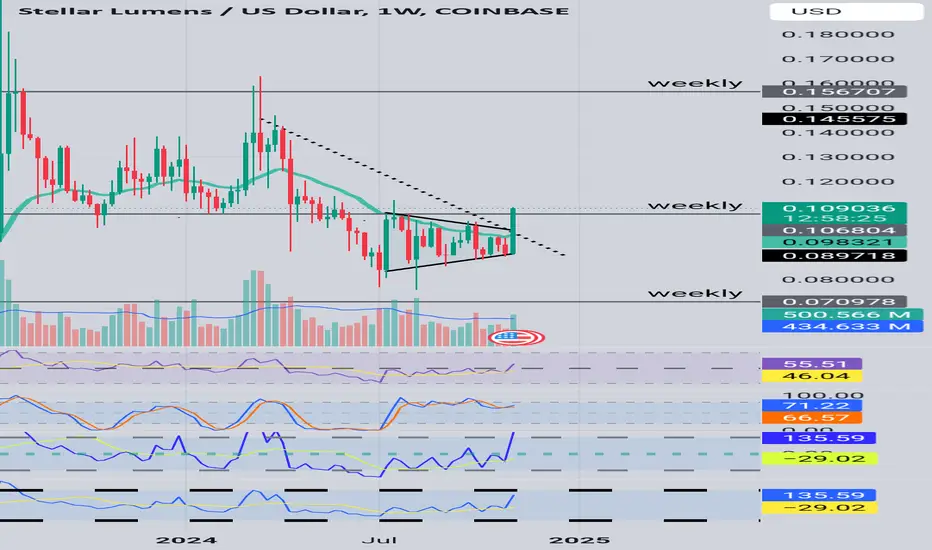
Harbinger of green wave for XLM WeeklyGreetings, here on the weekly chart. Will this weekly candle end the accumulation phase, We may have a close out of the asymmetrical triangle and above the 21 EMA. We appear to have good volume so far on this candle. It may close out above the minor downtrend line , and above a weekly resistance level.
The SRSI and RSI and CCI as of this time are positive and healthy.
Concerns- is candle did not print yet, global and local events and also policies that could be passed.
Please be kind and polite and share your thoughts below. Are there other confluences we can use in our analysis? Is this euphoria or something more?
Is XLM an Asset?By looking at the price growth since 2023, I have concluded that among the top 50 crypto projects (based on Market Cap), XLM has been one of the worst performing “assets” this cycle. I still have hope that it would be a good long term investment. For XLM to be in a bull market, price needs to cross above the orange support line, which may act as resistance first, but to make sure XLM is in a bull market it needs to flip into support and hold that level firmly. Only after that, I can make a conclusion that XLM is in a bull market. For now, there is no sign of a bull market for XLM and if price reaches the orange trend line and behave as a strong resistance, chances of a bull market will dramatically decrease. If price manages to find support at the orange level, then the next level to watch for would be the resistance around 40-43 cents. Considering both XLM and XRP were not able to make new all time highs in 2021 despite their huge potential in the real world economy makes these “assets” undervalued in my opinion. For me, as long as XLM is below 1 dollar, it is undervalued. In my view an asset is something that increases in value overtime or at least does not lose its value over time. XLM is around 89% below its all time high, which is a disturbing fact, but I still think a violent bull market is upon us.

Bullish Gartley + Bullish Pennant Break Combo - XLMHere I have COINBASE:XLMUSD on the Weekly Chart!
After the 2.5 Year long Bullish Gartley Harmonic Pattern had finished forming this July 2024, we see Price has been working into a tight Consolidation Pattern called the Pennant!
This Harmonic Pattern has been quite the Rollercoaster for longtime COINBASE:XLMUSD investors but with the Bullish Rally brought on this week, we see Price Breaking Above the Falling Resistance of this Pennant Pattern to the .10 area!
-If Price can find Support upon retesting the Break of Falling Resistance and stay above, we could see COINBASE:XLMUSD bask in .10 range and Push Higher!!
-RSI is now pushing Above 50 after the period of Consolidation stuck just underneath, indicating Bullish Interest is building
**If Price is unable to sustain these Higher Prices, this current Bullish Break could become False and we could see Price play back down into the Pennant Pattern!
With the Trump/Vance Campaign, we heard a lot of plans and potential being put towards the Cryptocurrency Market and with the win of the Presidency, we could start to see more Interest in this financial area.
Further updates will be on Daily Chart!

Are we ready for Big Move ? XLM USDComparing the scenario of 2019 and 2024 ... I expect a big move on the way...

XLMUSD November historically starts the parabolic rally. BUY.Stellar Lumens (XLMUSD) has been trading below its 1W MA50 (blue trend-line) since the week of April 08, consolidating in what is technically a wide Accumulation Phase on every Cycle below a Lower Highs trend-line.
Having entered November today though, sparks a wave of optimism in the market as historically on a 4-year frequency, this month is very bullish as the Cycle's Parabolic Rally starts. What basically confirms it is a break above the Lower Highs trend-line and of course the 1W MA200 (orange trend-line), which always have emphatic rejections (July 10 2023, August 17 2020, September 16 2019) during the first stage of the Bull Cycle.
As a result, it is a good time to buy now that the price is close to its 2-year lows. Naturally the Target can't be above the All Time High Zone (consisting of the last to Cycle Highs), our take is its bottom at 0.800.
-------------------------------------------------------------------------------
** Please LIKE 👍, FOLLOW ✅, SHARE 🙌 and COMMENT ✍ if you enjoy this idea! Also share your ideas and charts in the comments section below! This is best way to keep it relevant, support us, keep the content here free and allow the idea to reach as many people as possible. **
-------------------------------------------------------------------------------
💸💸💸💸💸💸
👇 👇 👇 👇 👇 👇

XLM Road Map Using Parallel LinesBefore explaining this chart I would like to ask whoever is looking at it to zoom in and study all data points (price reactions) touching and crossing the parallel lines. Parallelism is one of the most simple things in math that we learn in elementary school, but the impact of parallelism on human life has been underscored. By looking at the lines the first time, it may give you the impression that it’s just a useless chart with a bunch of funny lines. Just like anything else, there are inaccuracies to these parallel lines, but I have worked on them for over 100 hours to minimize inaccuracies. When you zoom into the chart and look at where price is reacting, the parallel lines start to make more sense. There are resistance and support levels going back to 2014-2015 that are still being respected by the parallel lines, so using these patterns I have tried to identify long term resistance and support levels and I’ve tried doing that by seeing where price is reacting most to the parallel lines and I have drawn them based on those price reactions since XLM was launched in 2014. I have not mentioned my price targets for this chart because it may mislead people during this period of market volatility. Another reason for not mentioning my buy and sell targets is if people study this chart for themselves and duplicate it on their screens, they may conclude different buy and sell targets, which is the advantage of this chart. It shows you where to look, but it doesn’t mislead you into buying and selling certain targets points. Another reason for not sharing my sell and buy targets is that I’m terrible at speculation, so I’ll leave it to the audience to make the decisions for themselves. Based on your knowledge of support and resistance levels, you can change the location of the parallel lines or even add more to the chart if you want to further manage your fear and greed levels.

XLM to 3308%? Buy and HODLStellar (XLM) is one of my first investments, I bought them since they started partnership with IBM in 2017. This is trade (investment) setup on larger timeframe. I am not looking to reach targets 2,3,4,5 and 6 very soon, that could be year(s). I will sell most of my capital on targets 2,3 and 4. Small portion will be sold on Target 1,5 and 6.
Entry Zone: 0.08 – 0.12
Buy Zone 1: 0.031 – 0.05
Target 1: 0.27 – 0.309 (125%)
Target 2: 0.40 – 0.44 (223%)
Target 3: 0.68 – 0.72 (444%)
Target 4: 1.06 – 1.10 (742%)
Target 5: 2.39 – 2.57 (1791%)
Target 6: 4.29 – 4.47 (3308%)

Stellar Lumens
Range: The upper band is around $0.10, and the lower band is around $0.085, defining a potential trading range.
The price is below the middle Bollinger Band, which aligns with a possible bearish bias in the short term.
There has been no strong breakout above the middle band, indicating that the downtrend may still be in play.
Volume seems relatively steady without any significant spikes, suggesting no major buying or selling pressure at this time.
A break above the middle Bollinger Band (near $0.10) could indicate a potential bullish reversal.
On the downside, if the price breaks below the lower Bollinger Band ($0.085), it could signal further downside movement.
Wait for a breakout from the Bollinger Band squeeze to gauge the next direction.
Watch for a move above the middle band ($0.10) for a potential long trade with the upper Bollinger Band as a target.
Alternatively, if the price fails to hold above $0.085, a short position could be considered with a tight stop.

Hope for XLM?On the 15 minute chart is stellar cycling up in a parallel channel? Do we have positive signs in the SRSI and MACD and RSI?
