XRPUSD - Preparing to Break Out Further Price is currently in a falling wedge formation on this 2H timeframe
This is a bullish pattern and can lead to some big moves
I doubt the bull run is over for XRP as I have said is some previous analyses
Chart pattern analysis
XRPBEARUSD trade ideas

XRPUSD - Going to Wave DMajor trend : Uptrend
Minor trend : Retracement
Note:
The price has rejected the support level of the triangle to form Wave ‘c’. Now she moves to resistance level of the triangle.
If the support level fail to hold the triangle, then the Wave ‘c’ is going to be 5 waves to complete Wave C of Wave 4.
This is just my EW view. Not recommended to trade based on this view.
TAYOR

XRP WAVE COUNT BASED OFF ELLIOT WAVE RULES. This is the wave count.
Zigzags upward aren’t always waves and you can’t nilly willy use EWT to make what looks good a wave count.
1. Wave 1: The first wave is the initial move in the direction of the new trend (up in a bull market, down in a bear market).
2. Wave 2: The second wave is a correction that retraces part of Wave 1 but never moves beyond the starting point of Wave 1 (e.g., in an uptrend, it doesn’t drop below the low where Wave 1 began).
3. Wave 3: The third wave is typically the strongest and longest, moving in the trend direction, and it must extend beyond the end of Wave 1. It cannot be the shortest of Waves 1, 3, or 5.
4. Wave 4: The fourth wave is another correction that retraces part of Wave 3 but cannot overlap with the price territory of Wave 1 (e.g., in an uptrend, Wave 4’s low doesn’t drop into Wave 1’s high).
5. Wave 5: The fifth wave is the final move in the trend direction, completing the impulse, and it must extend beyond the end of Wave 3.
Key Notes
• An impulse wave consists of 5 waves: 3 trending waves (1, 3, 5) and 2 corrective waves (2, 4).
• After a 5-wave impulse, a corrective phase follows with 3 waves (labeled A, B, C) moving against the trend.
• These rules apply strictly to impulse waves; corrective waves have more flexibility but follow their own guidelines (e.g., zigzags, flats, triangles).

This is the look of a positive ride on the one day chartThis is the look of a positive ride on the one day chart.
As mentioned in the most recent one hour chart, xrp is moving forward and going up!
Sharing the view of the one-day chart and moving forward from here with a Max buy-in xrp 3L

XRP BULL FLAG FORMING, BREAKOUT IN JUNE Continuation of original theory.
Xrp bounced nicely off bottom of forming triangle and is now working back to the top of the range within said triangle. Puts us at June before we see any real price action…
A break below $1.89 invalidated the triangle.
A break above $3 needs to retest and bounce higher before we can confirm we are out of the range.
I believe we are in a wave 4 pullback and wave 5 will be the final rally for this alt season around $4-7 dollars.
NFA DYOR.

I just bought Max xrp 3LI just bought Max xrp 3L.
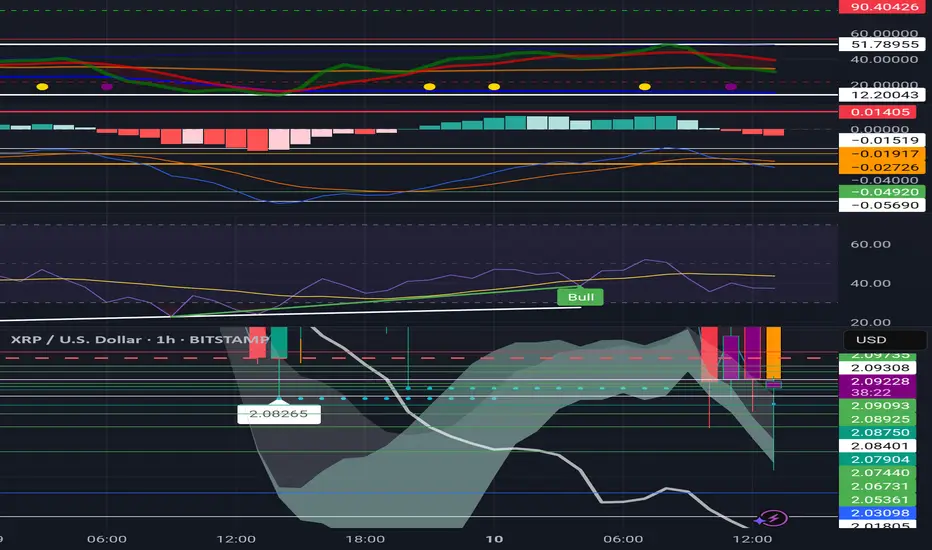
You will notice on the 1 hour chart that there are red dotted lines to the left of the price going up this indicates that what used to be resistance is now support and when I look at the right side the screen which you cannot see on my bit true account the SAR Factor met support and is bouncing off of that and going higher


I had sold 30% had $2.15 and bought back at $2.06I had sold 30% had $2.15 and bought back at $2.06
I did a Reload as this is going back up I charted on the 4-Hour chart and bought back at intervals as low as $2.06 xrp3l for the higher run watching the one hour chart for when it is time to sell

#XRP TRIANGLE BREAKOUT TO THE DOWNSIDEXRP broke out of the triangle formation and looks like it will retest the support zone around $2.00.
Hopefully we will see it bounce back from there but there is a possibility that we may go even lower towards a very strong support at $1.80.
For now, I will be taking my profits at $2.05.

XRP BULL FLAG FORMING WITHIN CHANNELXrp is bouncing off the bottom of the channel, pinbar candle on the 4 hr is upward pressure now that it has tested the bottom. It will probably trade in this range for a while however a symmetrical triangle is forming and it could be a larger wave 4 pullback in Elliot wave before wave 5 takes us to new ath to round out bull cycle 2025.

2.483 is My MAX Sell Line for XRP2.483 is My MAX Sell Line for XRP
Nice recovery for now.
Selling. My XRP at $2.463

Lookin for a little more dumpy dump!How low can ya go? Can you go down low? All the way to tha floe (200 day ma)?
BULLSEYE!

RIPPLE MASSIVE LONG|
✅RIPPLE will be retesting a support level soon of 2.00$
From where I am expecting a bullish reaction
With the price going up but we need
To wait for a reversal pattern to form
Before entering the trade, so that we
Get a higher success probability of the trade
LONG🚀
✅Like and subscribe to never miss a new idea!✅

XRP Completed wave 2 early call?Hello friends,
Just wanted to post this and potentially call the end of the wave 2 correction of the Major Wave 5. It's possible we have completed this sideways combo. Finishing with a zigzag to finish the Y wave. If we go any deeper it may be actually a larger correction hitting to mid $1.5 ish.. I don't expect that to happen. It would be on the lower probability end. Lets see how everything plays out with the count. I did a small buy at $2.02. Have some more funds on the side just in case we go lower.
GOD BLESS and TRADE ON
MATT

XRPUSD: 3 months of pain before next rally?XRPUSD turned bearish on its 1D technical outlook (RSI = 39.468, MACD = -0.103, ADX = 44.297) as it has essentially lost almost all of February gains. This is a sign of strong weakness on the short term but on the long run and the bigger picture on the 1W timeframe, it looks more like a typical consolidation phase during a Bull Cycle. More specifically, based also on the 1W RSI fractal, it looks like the June-November 2017 consolidation before the final peak at the end of the year, which was on the 2.618 Fibonacci extension. We expect a maximum of 3 more months of pain, but these levels are already an excellent buy opportunity as it is. Long, TP = 10.000.
## If you like our free content follow our profile to get more daily ideas. ##
## Comments and likes are greatly appreciated. ##

XRP Price Analysis - Bearish (2025)XRP is currently facing technical and fundamental pressures that could suggest a possible -20% price decline to the downside in the near future. Looking from recent market analyses and historical patterns, you should keep a close eye on price action within the symmetrical triangle pattern formation.👀
🟢Next Possible Level of Support= $1.28 - $1.45

I bought further on all of these lines on the one hour XRP3LI bought further on all of these lines on the one hour XR3L.
I bought further down as the chart indicated the price was going down now it's done created the Divergence for it to go back up now and I can sell as I go.
Xrp to $2.14 or to $2.20 or $2.30
I bought back xrpl 3x on all these linesI bought back xrpl 3x on all these lines. I firmly believe we are back up on the uptrend so I'm buying on the 3x Leverage I have sold at around $2.19.5 cents and I bought back on all these lines all the way down to $2.08 and 24 points.
This is what they mean by being greedy when others are fearful buying back on the lower ends and watch it go up and capitalize.

XRP/USD SET UPSXRP/USD long
Entry Price 1: $2.20
Entry Price 2: $1.70
Stop Loss: $1.20
Take Profit 1: $2.50
Take Profit 2: $2.80
Take Profit 3: $3.20
Take Profit 4: $3.50

XRPUSD - Not Done YetXRPUSD has poised itself above this line that is now support
Previously it was resistance in the last bull run
A support here allows for further movement upward
XRP is not done
Very bullish daily chart

XRP - WHAT HEAD AND SHOULDERS?XRP has gained a lot of attention by influencers who claim the chart forms a head and shoulders top.
logic tells me to do the opposite of any influencer or news headline.
what's a more optimistic pattern than the dreaded head and shoulders? perhaps a bullish consolidation wedge? XRP's chart is full of bullish flags and symmetrical triangles. if one focuses on not just a pattern, but a common pattern (very meta indeed), there seem to be common points where rays can be projected.
it just so happens those rays in my opinion show me the consolidation range, breakout point, and retracement level before confirmation and continuation.
anyone else see what i see?

I now believe this is the beginning of the Bull RunI now believe this is the beginning of the Bull Run.
This will be the final attempt to shake everyone out before it goes up I say this because I have a DOT on the bottom of one of my price bars on the 4-Hour chart which indicates this is going up.
What you now see here is $1,009 per every line on 3x to the upside so I'm buying in on xrp 3L $1,009 per line as it drops in price I'll add the money and if it hits the very bottom line I will max out I do believe this is going up from here!

XRP BEFORE & AFTER@XRP Weekly-Monthly Analysis / Retracement...Weekly - Monthly trend: Bearish
Chart Pattern: Head & Shoulders (H&S) - Bearish Continuation Pattern
Bearish Candlesticks signals:
HANGING MAN (Bearish, Single Candlestick pattern) / Weekly Timeframe / 09 DEC 2024
BEARISH ENGULFING (Bearish, Double Candlestick pattern)/ weekly Timeframe / 27 JAN 2025
TWEEZER TOP (Bearish, Double Candlestick pattern) / 1 Day timeframe / 20 FEB 2025
FALLING THREE METHODS (Bearish, five-fold Candlestick pattern) / 1 Day timeframe / 07 MAR 2025
Retracement Fib Price Levels:
0.00% (3.4000)
23.60% (2.6879)
38.20% (2.2474)
50.00% (1.8914)
61.80% (1.5353)
78.60% (1.0284)
100.00% (0.3827)
Good prices for buy (the lower the better):
61.80% (1.5353) – Golden Zone / Golden Pocket
78.60% (1.0284) – Entry Zone
Between 78.60% (1.0284) and 100.00% (0.3827) is the Risk Zone, which we have the Neckline of the ‘’ Quadruple Bottom Pattern ‘’ at the price range ‘’ 0.6291 – 0.7850 ‘’
I am having buy limit at 0.78500 on the neckline of ‘’ Quadruple Bottom Pattern ‘’.
