Ripple Bounced, What's Next? FenzoFx—XRP bounced from $1.621 and found resistance near $2.0. Traders should watch the $2.218 resistance area for bearish signals, such as candlestick patterns, to join the bear market.
>>> Trade XRP/USD without swap at FenzoFx decentralized broker.
XRPBEARUSD trade ideas

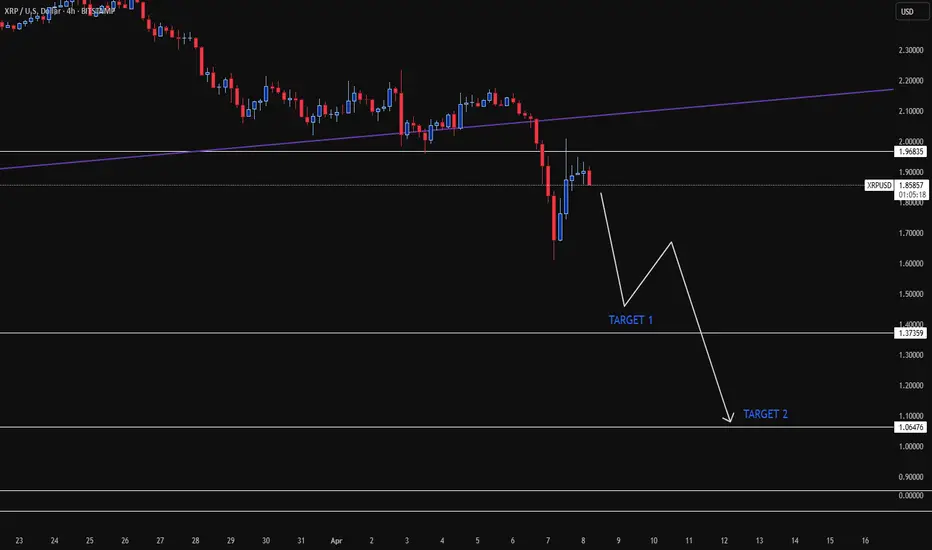
#XRP BROKE CRITICAL SUPPORT#XRP broke the critical bullish trendline which started back in November. We have had a pullback to the BOS zone which also resulted in a rejection candle on the 4h chart.
Looks like we can now expect to drop to the next support zone which sits at $1.37.
This would now indicate that we are in a bear market as per TA, however, the recent price action and not only in crypto is due to economic news and the market is very volatile at the moment so not FA and any news can trigger a change in direction. Trade carefully and always use SL!
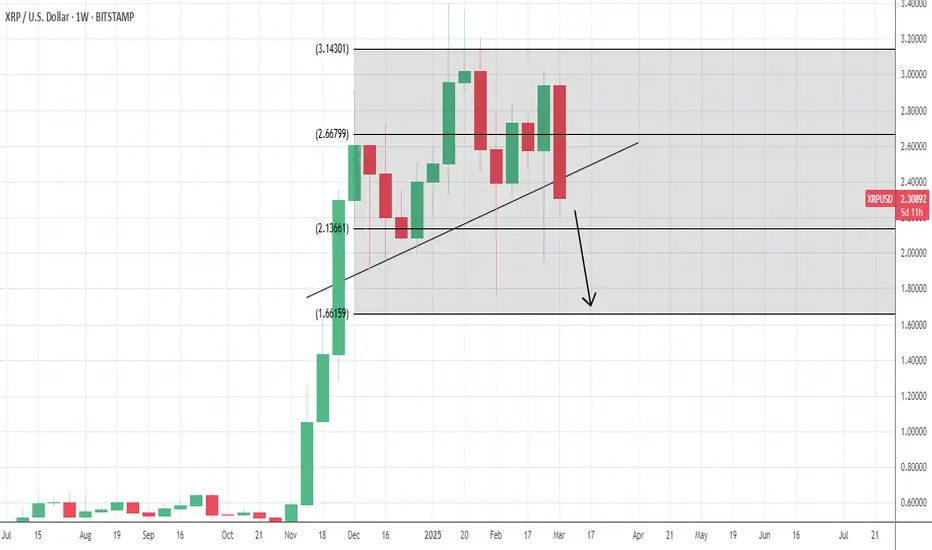
XRP just found bounce support on the bttm trendline of the wedgeLooking like a very valid pattern on the weekly hart. My guess is it will break upward somewhere around where I have arbitrarily placed the dottedmeasuredmove line, in which case the breakout target would be somewhere around $4.80 always a chance we retest the bottom trendline and even send a wick below. It before confirming a break upward though. *not financial advice*

0.93 We are not going up.I repeat! We are not going up. Don’t let anything fool you we are under major line and we are going to come down.
I only have 50% of my trade still short, however we are not going up yet!

Alts Close to an Obvious Break Now. Alts have been in a bear trend all of the year so far. Topping mostly on harmonic patterns at the start of the year.
See full post about that here:
Since this time, we've completed multiple further steps of trend failure.
Let's run through them.
First let's refer to my template of things you tend to see in the public during stages of a bubble. It's a multi step process, we'll skip to the advanced stages.
We have the public trap (Sharp convincing spike - happened when the harmonics filled I think).
Then we have the rug pull. A very clean and consistent sell off from the high during which people bury their head in the sand and use phrases like "Ignore the FUD".
Then we're into the Early Panic stage where the market sells off about 50% and then puts in a bit of a bounce.
We'd now be in the "mimic the convincers" part. Where the market acts like it did before the previous rallies. The bit where people are common duped into making lifechanging decisions. And the time when it's most important to be warn people about the bubble - but the time they simply will not listen.
After this break, is when we tend to head into the lower lows crash section of the trend which develops into a long term grinding downtrend.
As well as going through all the classic public phases of a bubble, we now have the classic things like head and shoulders to warn the break may be imminent.

Can we see another short on xrp?Our first trade was perfect, seeing a nice channel and downward resistance forming. Placing a low risk on this one.

Bearish Signal Alert for Ripple (XRP)Ripple (XRP) has just triggered a major bearish signal by breaking below the crucial support level of $2.3575. This recent move is a significant indicator for potential further declines in the price of XRP. Investors and traders should closely monitor this development, as the break below $2.3575 could lead to an acceleration in bearish momentum.
Looking ahead, the next major support area to watch is around $1.7. If Ripple's price continues to descend, we can expect it to potentially target this next critical support level. Traders might consider this as a strategic point for assessing market responses, with the possibility of further downside if this level fails to hold.
It is advisable to approach trading with caution during this period and consider adjusting stop-loss orders to manage risks effectively. This bearish development could present opportunities for short sellers, but also warrants vigilance for any signs of a reversal or support at lower levels.
Ripple dives as predicted; what is next?
This content is not directed to residents of the EU or UK. Any opinions, news, research, analyses, prices or other information contained on this website is provided as general market commentary and does not constitute investment advice. ThinkMarkets will not accept liability for any loss or damage including, without limitation, to any loss of profit which may arise directly or indirectly from use of or reliance on such information

XRP The bottom is in. We are awaiting the big news to push price higher. It can be in the next few hours, days, weeks or a month. But we will go so much higher.
Lock in.

XRP/USD Short Trade Setup Analysis (9H Timeframe - Bitstamp)🔹 Current Setup:
- 📈 XRP experienced a strong move upward following ETF news but is now approaching major resistance.
- 🔹 Price is testing the 0.618 Fibonacci retracement level at $2.66 , aligning with the descending channel's resistance.
- 📉 Given the broader bearish trend , a rejection from this level could trigger a strong downside move.
- 📍 Key Resistance Levels (Potential Rejection Zones):
- 🎯 $2.87 (0.764 Fibonacci retracement & upper channel resistance)
- 🎯 $3.21 (Full Fibonacci retracement, invalidation level for bears)
- 📍 Key Support Levels:
- ❗ $2.48 (0.5 Fibonacci retracement)
- 🔻 $2.36 (0.382 Fib retracement)
- 📉 Deeper Target: $1.36 - $1.40 XRP (Projected based on Fibonacci extensions & channel breakdown)
📈 Bullish Scenario (Breakout Play)
- 🟢 Entry: Above $2.87 (If price breaks above 0.764 Fib)
- 🎯 Take Profit 1: $3.21 (Full retracement level)
- 🎯 Take Profit 2: $3.50+ (Potential bullish expansion)
- 🔴 Stop Loss: Below $2.66
✅ Justification:
- 🔹 If price breaks and holds above $2.87 , the bearish structure could be invalidated.
- 🔹 Momentum from the ETF-driven rally might fuel another leg up beyond $3.00.
- 🔹 A strong breakout above $3.21 would confirm a bullish reversal.
📉 Bearish Scenario (Primary Expectation)
- ❌ Invalidation Level: Above $3.21
- 🔻 Downside Targets:
- $2.48: 0.5 Fibonacci retracement
- $2.36: 0.382 Fibonacci retracement
- $1.76: Key structure support
- $1.36 - $1.40 XRP : Final bearish target (0.272 Fib extension & channel bottom)
✅ Justification:
- ❗ Price remains within a descending channel , signaling a continuation of the downtrend.
- ❗ The ETF-driven pump appears to be a liquidity grab , leading to a likely reversal.
- ❗ A rejection from $2.66 - $2.87 would confirm bearish continuation, targeting the lower support zones.
⚡ Key Takeaways:
- 🔹 XRP is facing strong resistance at $2.66 - $2.87 , a likely rejection zone.
- 🔹 A breakdown below $2.48 increases bearish pressure , targeting $1.40 XRP.
- 🔹 Bearish bias remains unless price breaks & holds above $3.21.
- 🔹 Expect price to follow the descending channel structure toward $1.36 - $1.40.

XRP now approaching buy zone at 1.55-1.60 levels as forecastedAs indicated in prior posts, XRP is now approaching the liquidity target levels at 1.55-1.60 levels as part of a final liquidity run.
Possibility exists for extended sell wave as low as 1.06 (worst case scenario imo) but most likely scenario is that 1.35-1.55 will be the zone in which the final low on the consolidation structure is formed. The next move is gearing up to be explosive towards 10$ & then on towards 100$ range once 10$ fails to hold as resistance.
I am convinced we will witness progress on towards 500's within several years (assuming comprehensive integration into financial system etc)...time will tell if we get into the 1,000's!!!
Hope this helped some of you gain (re-)entry at greater discounted levels!!

Juicy 0.93 incoming!I tried to tell you all :) Enjoy that juicy drop!
0.93 is inevitable :) Like Thanos, it’s coming!

Possible Distribution Scheme in XRP (Chaotic Scenario)Someone asked me what the most chaotic scenario for XRP's price could be — and I answered: a long-term Distribution phase.
In this image, I illustrate a radical distribution scheme that could potentially extend into late 2025. But first, a sign of weakness — with price dropping below the Corona Dump levels, possibly close to $0.10. Sounds absurd to many, I know.
If it's Scheme 1, XRP would drop and then bounce back to the Last Point of Supply (yellow line).
If it's Scheme 2 (red line), price could spike between $5 to $6.8, with an average peak around $5.5–$5.7, likely triggering extreme euphoria.
But remember, this is just one insane possibility — and it depends heavily on Bitcoin, Market Makers, Supply vs Demand, public interest, and the macroeconomic context.
If this scenario plays out… what would YOU do?

XRP Weekly ChartJust going down at this point, see if it retraces this clean range below or holds up and continues to range / move up.
Things should pick up again when Russia and Ukraine pack it in, even with Trump advocating its just gone down since Jan 20.

XRPUSD – Ready for the Next Move?XRPUSD – Compression Before Expansion?
After a strong rally from late 2024 that peaked near $3.40, XRPUSD has been in a gradual downtrend with a current price around $2.08.
Over the past few weeks, price has entered a sideways consolidation zone between $1.95 and $2.20, showing signs of indecision and low volatility. This structure often precedes explosive moves.
📌 Key Levels to Watch:
Support Zone: $1.90 – $1.95
Resistance Zone: $2.20 – $2.25
Breakout Target: $2.50 – $2.70 (if resistance breaks)
Breakdown Target: $1.75 – $1.60 (if support fails)
🔍 Market Outlook
The overall market structure remains bearish, but signs of a potential short-term reversal or relief bounce are forming.
A breakout or breakdown from this tight range will likely determine XRP's direction for the rest of the month.
Traders should monitor these levels closely, as a decisive move is likely within the next 5–10 days.
Disclaimer: This analysis is for educational purposes only and does not constitute financial advice.

xrp head and shoulderXRP has formed a Head and shoulder on the daily and 15 min chart it has already broken down through the neck line. I will be looking for the next resistance around 2.06 a break of that will take us to 1.98 and a buy zone. IMO below that will be a discount and will look for 1.70 to 1.50 to load more

XRP Weekly-Monthly Analysis / Retracement Levels for BuyTHEN - NOW@ XRP Weekly-Monthly Analysis / Retracement Levels for Buy (...and we keep going)
Weekly - Monthly trend: Bearish
Chart Pattern: Head & Shoulders (H&S) - Bearish Continuation Pattern
Bearish Candlesticks signals:
HANGING MAN (Bearish, Single Candlestick pattern) / Weekly Timeframe / 09 DEC 2024
BEARISH ENGULFING (Bearish, Double Candlestick pattern)/ weekly Timeframe / 27 JAN 2025
TWEEZER TOP (Bearish, Double Candlestick pattern) / 1 Day timeframe / 20 FEB 2025
FALLING THREE METHODS (Bearish, five-fold Candlestick pattern) / 1 Day timeframe / 07 MAR 2025
BEARISH ENGULFING (Bearish, Double Candlestick pattern)/ weekly Timeframe / 24 MARCH 2025
Retracement Fib Price Levels:
0.00% (3.4000)
23.60% (2.6879)
38.20% (2.2474)
50.00% (1.8914)
61.80% (1.5353)
78.60% (1.0284)
100.00% (0.3827)
Good prices for buy (the lower the better):
61.80% (1.5353) – Golden Zone / Golden Pocket
78.60% (1.0284) – Entry Zone
Between 78.60% (1.0284) and 100.00% (0.3827) is the Risk Zone, which we have the Neckline of the ‘’ Quadruple Bottom Pattern ‘’ at the price range ‘’ 0.6291 – 0.7850 ‘’

XRPUSD - ANALYSIS👀 Observation:
Hello, everyone! Based on what I see on the XRP (Ripple) chart, if we close above the price of 1.96695 on the weekly timeframe, I expect the start of a bull market towards the upside with a target of 4.00.
However, if the weekly candle closes below 1.96695, I anticipate a bearish move for Ripple, targeting 0.94799.
📉 Key Levels to Watch:
Support: 0.94799
Resistance: 4.00
Weekly closing price above 1.96695 will indicate a bullish trend.
💡 Expectation:
Bullish Scenario: Price closes above 1.96695 on the weekly, targeting 4.00.
Bearish Scenario: Price closes below 1.96695, targeting 0.94799.
💬 What’s your outlook on XRP this week? Let me know your thoughts in the comments!
Trade safe

buying ?@Ripple is in a complex corrective zone. Limited buying. A downward trend is expected, targeting $1.50.

XRP/USDT Chart Breakdown !XRP/USDT Chart Breakdown:
This chart shows a strong bullish setup forming after a clean liquidity swipe. Price dipped below previous lows into a known support zone and reacted sharply—classic smart money play.
Here’s the sequence playing out:
Triple bottom at strong support: Each dip into the ~$2.00 area has been aggressively bought up. That’s a strong sign of accumulation.
Liquidity swipe ("Swipe Liq / Adding more"): Price wicked below prior lows, likely to trap sellers and collect liquidity. The fact that it bounced immediately after shows buyer interest.
Previous resistance at $2.48 is the first key challenge. That level rejected twice already. If XRP breaks and holds above $2.48, that’s your green light for further upside.
Next levels to watch after $2.48 are $3.00 and $3.40+. These are psychological + technical targets based on previous price reactions.
The pattern in play is a “Bearish In → Bullish Out” structure. If price reclaims structure cleanly and volume supports the move, this can turn into a strong breakout run.
Invalidation is if XRP closes below ~$1.79. That would break structure and confirm sellers are in control again.
Final Thoughts:
This is shaping up as a buy-the-dip strategy with high reward potential. You’ve got support holding multiple times, a clear resistance to flip, and two strong upside targets.
It’s a matter of patience now. Watch for the breakout above $2.48 with strong momentum. If that happens, the bullish continuation to $3 and beyond becomes much more likely.
Want me to do a multi-timeframe confirmation or add indicators like RSI/VWAP/EMA on top of this?

INVERTED HEAD & SHOULDERS ON 4HR TFSupport and resistance trap the market, forming a left shoulder, then breaking out of the support zone, forming an inverted head. The market now breaks back into the zone; wait for a retest and buy to the resistance. If the market breaks back out of support and closes, wait for a retest and sell at the support area. Collect your losses and look for the next setup.

XRP - Bearish Gartley Pattern (Long & Short Positions)Confirmation:
Market Structure: The chart highlights a first weekly lower high and first weekly lower low, reinforcing a bearish trend.
Daily Fair Value Gap (FVG): Could serve as an additional target for the price.
Risk-to-Reward Ratio (RRR): The trade appears to have a favourable RRR, with an optimal entry around D.
1. Long Position (Counter-Trend Trade from C to D)
Trade Setup:
Entry: At point C, around the 0.882 Fibonacci retracement level.
Stop Loss: Below point A, ensuring protection against further downside.
Take Profit:
TP1: 38.2% retracement of the C-D leg.
TP2: 61.8% retracement of the C-D leg.
TP3: Full extension to point D (0.786 - 0.886 Fibonacci level).
Confluences for the Long Position:
✔ Bullish reaction at 0.882 retracement (potential demand zone).
✔ Daily Fair Value Gap (FVG) below adds liquidity, possibly supporting the price.
✔ Favorable risk-to-reward ratio (RRR).
2. Short Position (Bearish Reversal from D)
Trade Setup:
Entry: Around point D (between 0.786 - 0.886 Fibonacci retracement level).
Stop Loss: Above point X (invalidates the bearish Gartley setup).
Take Profit:
TP1: 61.8% retracement of the D-C leg.
TP2: B-point level.
TP3: Full retracement back to A (major structure level).
Confluences for the Short Position:
✔ Bearish Gartley completion at D.
✔ Key Fibonacci confluence at 0.786 - 0.886 retracement.
✔ Market structure suggests a lower high in a downtrend (weekly bearish trend continuation).
Pattern Type: Bearish Gartley
Key Levels:
X to A: Initial impulse move
A to B: Retracement to 61.8% Fibonacci level
B to C: Retraces deeper, around 88.2% Fibonacci level
C to D: Final leg completing at the 78.6% to 88.6% Fibonacci level

INVERTED HEAD & SHOULDERS ON THE 4HR TFSUPPORT & RESISTANCE are the black boxes. As you can see, consolidation forms the left shoulder, and the breakout of the support forms the inverted head; now, the market has broken back into the zone. Wait for the retest, and Take Profit will be at the resistance.
