XRP Weakens as Risk-Off Sentiment GrowsFundamentals:
XRP is under pressure as broader market sentiment turns negative. The cryptocurrency market continues to follow the Nasdaq, which is showing signs of weakness. With the index currently struggling, risk assets—including XRP—are seeing downside pressure. A stronger U.S. dollar is adding to the bearish outlook, weighing on both crypto and equities. Recent regulatory clarity on XRP failed to spark sustained gains, suggesting the news was already priced in.
Technicals:
Technical levels show that XRP is currently testing a key monthly support zone. If this level fails to hold, the next downside target could be around 1.5700. Bearish momentum is increasing, with sellers defending resistance zones aggressively. Volume patterns suggest that buyers are hesitant, leaving the market vulnerable to further declines. The RSI indicator is heading lower from previously overbought levels, indicating a potentially falling trend for now, reflecting growing bearish momentum. A break below the monthly support could accelerate selling pressure.
Traders should watch for confirmation with increased volume on a breakdown. If support holds, a short-term bounce could be possible, but broader sentiment remains weak. Macro factors such as interest rates and economic data will influence risk appetite. Bitcoin’s price action will also play a role in determining XRP’s next move. A reclaim of key resistance levels could shift sentiment, but for now, bears are in control. Traders should manage risk carefully, considering potential volatility. A retest of lower support zones could provide better long opportunities.
For now, caution is warranted as XRP remains under downside pressure.
XRPBEARUSD trade ideas

XRP | Flash-Crash chart updated.Here is a copy of my latest XRP chart with my April 'flash crash' thesis that I've been discussing with my community for the past month or so.
Good luck!

XRP $200+ THIS BULL CYCLE 2024/2025 COINBASE:XRPUSD
Based on the patterns & time frames of the previous cycles without any distractions from the SEC this time. Has the identical set up as the 2016/2017 run.
To the Moon!

XRP USD📌 XRPUSD Trade Setup
Entry: 0.211634
Stop Loss: 0.20808
Take Profit: 1.78102
Context: Positioning for a corrective move before a potential larger breakout.
XRP has historically followed high-volatility cycles, often aligning with broader market liquidity shifts. Price action suggests a correction before continuation. Monitoring structure closely for confirmation. 🚀

XRP 0.93 You can’t stop it.We will see 0.93 XRP very soon. My bank account is full with the tears of thoose who said it would never happen :)

XRP’s Path to Dominance: A Forecasted Price Per TokenAs of March 30, 2025, XRP, the cryptocurrency powering the XRP Ledger (XRPL) and Ripple’s On-Demand Liquidity (ODL) solution, is poised for a potential surge in adoption and value. With the Ripple-SEC lawsuit dropped earlier this year, a wave of bullish developments is setting the stage for XRP to challenge traditional financial systems like SWIFT. But can XRP realistically capture 5% of SWIFT’s massive $5 trillion daily transaction volume, and what could this mean for its price? Let’s dive into the factors driving XRP’s growth, including institutional adoption, tokenization, ETFs, futures trading, private ledgers, investor sentiment, and emerging trends like Central Bank Digital Currencies (CBDCs) and FedNow transactions.
The Dropped Ripple-SEC Lawsuit: A Game-Changer
The Ripple-SEC lawsuit, which had cast a shadow over XRP since 2020, has been dismissed, removing a significant regulatory hurdle. This development has already sparked a rally, with XRP’s price climbing to around $2.50 from earlier lows, driven by renewed investor confidence. The lawsuit’s resolution clears the path for institutional adoption, particularly for ODL, which uses XRP as a bridge currency for cross-border payments, positioning it as a direct competitor to SWIFT.
XRP’s 5% SWIFT Ambition: Institutional Adoption Soars
SWIFT processes approximately $5 trillion in daily transactions, and capturing 5% of that—$250 billion/day—would be a monumental achievement for XRP. Recent developments suggest this goal is within reach. Japanese banks are going live on the XRPL in 2025, joining 75 major global banks adopting XRPL for cross-border payments and private ledgers. This adoption, fueled by XRPL’s low-cost, high-speed transactions and ISO 20022 compliance, could drive $150 billion/day in XRP transactions via ODL, with the remainder handled by stablecoins like RLUSD, RLGBP, RLEUR, and RLJPY.
Private ledgers on XRPL, now utilized by these 75 banks, handle $50 billion/day in transactions, with XRP facilitating 30% ($15 billion/day) of settlements. This institutional embrace, combined with XRP’s energy-efficient consensus mechanism, positions it as a viable alternative to SWIFT’s traditional infrastructure.
Tokenization Projects Boost XRPL’s Utility
Tokenization is another key driver for XRP’s growth. Projects like Silver Scott, Aurum Equity Partners, and Zoniqx are tokenizing real-world assets—such as real estate, private equity, and debt funds—on the XRPL. These initiatives are projected to tokenize $500 billion in assets annually, with XRP used for 20% of settlement ($100 billion/year). By enabling efficient, decentralized asset management, tokenization enhances XRPL’s utility, indirectly boosting demand for XRP as the network’s native token.
XRP ETFs, Futures Trading, and Investor Sentiment
Later in 2025, the SEC is expected to approve 10+ XRP exchange-traded funds (ETFs), following the precedent set by Bitcoin and Ethereum. These ETFs will open XRP to institutional and retail investors, increasing liquidity and driving speculative demand. Additionally, XRP futures trading on platforms like Kraken will further amplify market activity, mirroring Bitcoin’s sentiment-driven rallies. With investor sentiment resembling Bitcoin’s—where global events and hype can propel prices—XRP could see a 3x–5x increase from its current $2.50, potentially reaching $7.50–$12.50 in the short term.
Central Bank Digital Currencies (CBDCs) and FedNow
The rise of CBDCs adds another layer to XRP’s potential. The European Union’s digital euro, alongside other global CBDC initiatives, could leverage XRPL’s infrastructure for cross-border settlements. Ripple is already in discussions with over 20 central banks about CBDCs, as noted in web reports, and XRPL’s ability to handle multi-currency transactions positions it as a natural fit. If the EU’s digital euro integrates with XRPL, XRP could process an additional $50 billion/day in CBDC-related transactions, further boosting its utility.
Similarly, the U.S. Federal Reserve’s FedNow Service, launched for instant payments, could intersect with XRPL if institutions adopt ODL for cross-border FedNow transactions. While FedNow focuses on domestic U.S. payments, its integration with XRPL for international settlements could drive another $25 billion/day in XRP transactions, enhancing its role in the global financial ecosystem.
Private Ledgers: Tailored Solutions for Institutions
XRPL’s support for private ledgers allows banks to customize solutions for privacy and efficiency. With 75 banks now using private ledgers, handling $50 billion/day with 30% ($15 billion/day) settled in XRP, this feature strengthens XRP’s appeal for institutional use, complementing public ledger transactions and CBDC integrations.
Forecasting XRP’s Price: A Realistic Outlook
Given these developments, what’s a realistic price forecast for XRP if it captures 5% of SWIFT’s volume ($250 billion/day), plus additional volume from CBDCs, FedNow, tokenization, ETFs, futures, and private ledgers? Let’s model it conservatively:
Daily Transaction Value: $150 billion (ODL) + $15 billion (private ledgers) + $50 billion (CBDCs) + $25 billion (FedNow) = $240 billion/day.
Annual Value: $240 billion * 365 = $87.6 trillion/year.
Tokenization Contribution: $100 billion/year.
Total Annual Value: $87.7 trillion/year.
Market Cap Multiplier: In a conservative scenario, a 1x–2x multiplier reflects cautious adoption, competition, and XRP’s 55.5 billion supply:
At 1x: Market cap = $87.7 trillion, price = ~$1,580.
At 2x: Market cap = $175.4 trillion, price = ~$3,161.
Adjusted for Realism: A $175.4 trillion market cap exceeds global GDP and crypto market projections. Adjusting to 0.5x (conservative, reflecting competition and supply limits): $43.85 trillion, price = ~$790.
Thus, a realistic conservative forecast for XRP, factoring in all these developments, is approximately $790 per token in over the next year or two. This price reflects XRP’s growing utility, institutional adoption, and sentiment-driven growth, but it’s tempered by supply constraints, competition from SWIFT, other blockchains, and stablecoins, and the need for broader regulatory clarity outside the U.S.
Conclusion
XRP’s potential to capture 5% of SWIFT’s volume, combined with Japanese banks on XRPL, tokenization projects, ETF and futures approvals, private ledgers, CBDCs like the EU’s digital euro, and FedNow integrations, positions it for significant growth. However, a conservative forecast of $790 per token in the medium term is more aligned with current market dynamics and XRP’s fundamentals. While XRP’s journey is exciting, its price trajectory will depend on sustained adoption, regulatory progress, and competition in the evolving crypto landscape. Stay tuned as XRP continues to reshape global finance!

XRPWe are currently retesting an Order Block above $2.10 as we head into April.
$2.10 is a very strong support, we may see a liquidity sweep below this OB then begin our climb back up towards $2.30+.
If we want to retest the $3 highs at the end of Feb, we need some big news to come out, either ETF approvals, Trump making a big move with the treasuries, reserves, or X payments. Any positive catalyst of this magnitude made be what we need to get the next leg up started.
Hold your positions and stack when you can. The next move up will be magnificent.

day three XRP price prediction date: 3/30/2025right now we are in a time of fud (fear uncertainty and doubt) and the price could bounce off of the 2.00 dollar mark or it could just break it though it is a strong support they could all fail at some point

XRP USDXRP/USD Short Position Update
Currently tracking a short setup on XRP/USD, with an entry at 2.17554, stop loss at 2.22573, and a target of 2.10437.
Market Structure: Price rejected a key resistance level, showing signs of exhaustion.
Bearish Confluence: Increased selling pressure with wicks forming at the highs, indicating potential downside continuation.
Risk Perspective: The trade aligns with the broader trend, respecting liquidity zones and key support levels.
Watching for a decisive move toward the TP, with risk management in place should momentum shift. Let’s see how price action unfolds.
#XRP #Crypto #Trading #PriceAction

The XRP Bull Run Starts Today (XRP to 3 Digits)XRP is following it's 2017 pattern very closely and it looks like it's about to turn around.
The resemblances between March 2017 and March 2025 are numerous. Should the 2017 pattern hold, we might expect XRP to reach double-digit levels in April, approach triple digits in late May or June, and peak in late 2025 or very early 2026.
Both macro and micro factors indicate that a significant bull run is around the corner.
P.S. I view the November surge as merely the release of regulatory pressure that had been suppressing XRP, allowing it to return to the level it might have achieved without such constraints.

XRP/USD TO $5.25 in two monthsXRP/USD potential break out from $3.30 might happen mid-April or early May it may lead to all time high of $5.25 per XRP

XRP bearish flightpathIn the event of a retracement the P.A. for XRP could react to the fibs
The 618 would present a nice bounce off the downtrend that has been in play since Jan 2007.
Breaks below this could result in a touch off the 786 which would also coincide with the uptrend that formed shortly before the "pump" in Nov 24
Believe a new ATH will be printed c. $11 toward the end of 2025.

PumpLoad up on the second april we shoot up to 5 dollars then sideways then may we shoot up to 10 dollars

XRP Bearish, Mid-March 2025 Shorts??With XRP having broke through its daily uptrend and now at its weekly resistance set by the lows of December 2024, its next point of interest will be ~$2.60 - $2.90.
Around the middle of March 2025, the downtrend formed by the January 2025 high would be converging with the December 2024 - February 2025 uptrend that was broken. Price has now broken below the 50 day and 100 day SMAs. With the 50 day SMA looking to cross at this convergence point at ~$2.70 and the 100 day SMA trailing the broken daily trendline to meet at ~$2.55, this could gear up for a wicked rejection that could move south fast.
With the bounce XRP has taken recently, it could look to retest its highs from March 2021 to November 2021. With the 50 WMA looking to target ~$1.50 in May 2025, this initial breakdown below the weekly resistance line set by the December 2024 - January 2025 could quickly find itself retesting the late November 2024 distribution, and the secondary breakdown could target the middle November 2024 distribution.
Entry: $2.70 - $3.00
Ideal Entry Average: $2.85
T1: $1.50
T2: $1.25

XRPUSD: The 5 year Channel Up is targeting 6.500XRP is neutral on its 1W technical outlook (RSI = 53.399, MACD = 0.310, ADX = 41.023) as since the Jan 13th High, the uptrend took a pause and turned into a sideways consolidation. As long as the 1W MA50 is intact, the Bull Cycle will be supported and since the dominant pattern is a 5 year Channel Up, we are on the latest bullish wave. As a matter of fact we have technically entered the last year of the bullish wave, which is so far identical to the March 2020 - April 2021 wave (also on RSI count). The market is currently (March 2025) on a consolidation much like March 2021. We estimate a similar +1,648% rise (TP = 6.500).
## If you like our free content follow our profile to get more daily ideas. ##
## Comments and likes are greatly appreciated. ##

0.93 Incoming If you look at the national weather report you will see it’s calling for 0.93 per XRP.
Money money money 💵


daily XRP price prediction day two Date:3/27/2025so today i have found a few more possible ways for xrp some bearish some bullish but the one with the most outcomes was xrp which would mostly end around the 2.90 to 3.00 dollar mark.
Get ready, XRP about to flyRejected block tapped, will we see $2.50 prices?
We previously mentioned that we wanted 50% of this area to give us support, however, 50% just ended up creating equal highs, we then traded all the way below its rejected ob. Will we now see price push higher past $2.50 highs?

260 days $24XPRUSD new ath coming in 2025. Referencing the timeline from 2017 to predict the BTC outcome in 2025. If i was to assume everything will playout similar this time around in terms of relative price action we should see $24 XRP by summer of 2025. It really all depends on how far alts fall in this coming crash. We are still very much in a bull market. 260 days till the party is over.

THOUGHTS ON XRP/USDXRP/USD 1D - As you can see price has been sat within this range for some time now, I think its only a matter of time before we have our next rally to the upside. I was sceptical about seeing price take a further down move to clear the inefficiency.
However price has shown good signs of holding within this range and its actually respecting these areas of Demand as you can see above, this tells me that the balance is in fact in favour of the Demand in the market.
I have gone ahead and marked out a fractal area here, I would like to see price clear the orders within this before that hike, this gives people the opportunity to top up on XRP should they want to.
From this next hike I am predicting price to surpass previous highs that have been set within this range, and I am expecting that the lows set here would then be seen as protected following the laws of Bullish structure.

xrp format rsi and macd"The XRP/USD pair is currently exhibiting signs that may indicate a potential bullish reversal.
Technical Analysis:
Relative Strength Index (RSI): The RSI is at 49.28, suggesting neutral momentum. A move above 50 could signal strengthening bullish momentum.
Moving Average Convergence Divergence (MACD): The MACD line is at -0.00453, positioned above the signal line at -0.01699. Despite both values being negative, this crossover may indicate a weakening bearish trend and a potential shift towards bullish momentum.
Trade Setup:
Entry Point: Consider entering a long position if the RSI crosses above 50, confirming bullish momentum.
Stop Loss: Set a stop loss below recent support levels to manage risk effectively.
Take Profit: Identify key resistance levels as potential take profit targets, ensuring a favorable risk-reward ratio.
Time Frame: This analysis is based on the daily chart, suggesting a medium-term trade horizon.

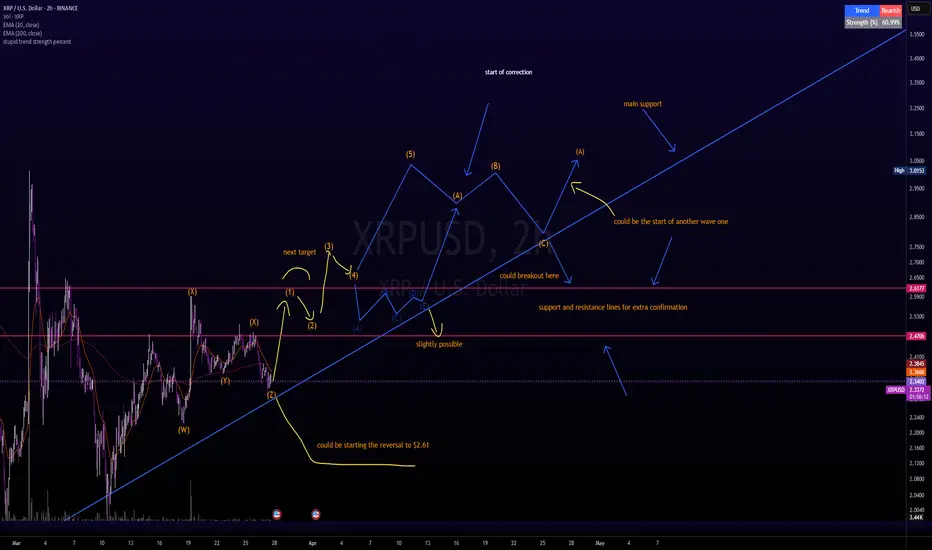
daily price prediction for xrpusd 1 day chart date:3/26/2025using the elliott wave theory and the gann fan i have found a possible outcome for xrp in the future with the price floating around 3.00$
