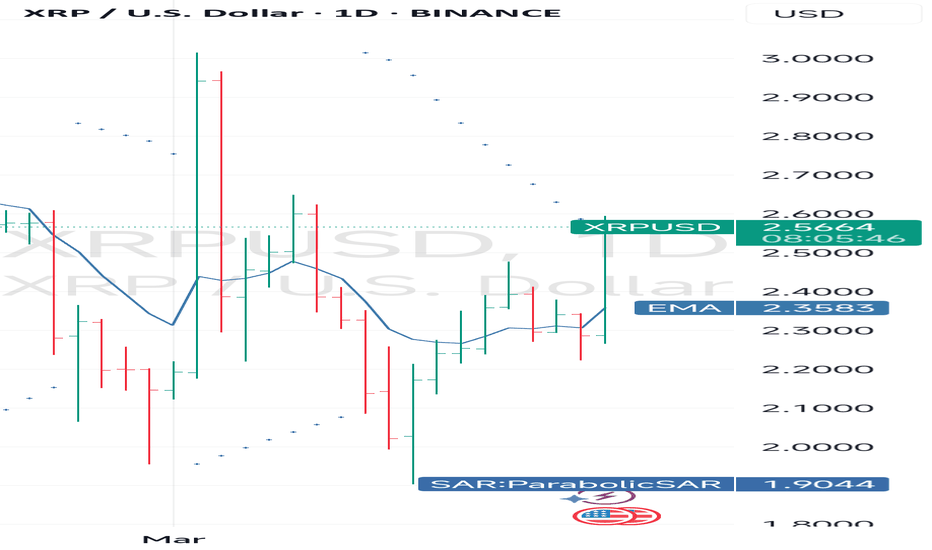
"XRP Facing Downtrend – Key Support Levels to Watch"XRP is trading within a descending channel, struggling to break above key resistance levels. The price has rejected the moving average and is showing potential downside movement. Fibonacci retracement levels highlight key support at $2.31 (0.786 Fib) and $2.02.
If the bearish momentum continues, a retest of the lower trendline may be likely. Can XRP find support and bounce back, or will the downtrend persist? Let us know your thoughts.
#XRP #Ripple #CryptoAnalysis #TechnicalAnalysis #Trading
XRPBULLUSD trade ideas
For those of you who bought XRP...I've known about COINBASE:XRPUSD for over a decade now. Time has brought tons of rumors, tons of hype, and tons of mistakes still being made by those new and experienced alike. For those of you holding strong pre $1.00, I commend you. For those of you who are bought high and are now riding the emotional roller coaster, consider these 3 things before you make a decision.
1. We are DIRECTLY in the middle of the range
Over 3 months of consolidation has taken place. With a high of 3.40 and a low of 1.70, this is a range for advanced traders. If you bought around 2.00 or under, Congrats! even though you didn't get in pre $1.00, there are alot of Big buyers that have been scooping up XRP at the 2.00 level.
For those of you that Bought 2.50 and above.
Ask yourself why you purchased XRP?
I ask you; Did you buy XRP to trade? or to invest? No they are not the same thing. Investing is long term, 3-5 years+. Trading is dealing with much shorter time windows, even if you are swing trading, Trading is Trading, and this takes a different skill set and mindset. so if you are investing, be happy that XRP is lower in price. if big money is Buying at 2.00, there is nothing stopping you from doing the same. If you are a beginner trader, consider our last point.
Buy with Buyers, Sell with Sellers
Sounds simple right? Here is something you may not know. Liquidity is what moves markets. If you have 100million that you have to invest for your clients in XRP, do you slap the market button? Absolutely not, in fact, you want to make yourself as small looking as possible. Why? YOU NEED PEOPLE TO SELL INTO YOU. Big firms (unless through dark pools) have algorithms make themselves look as small as possible, whilst accumulating and distributing shares efficiently. At the end of the day, These are the big players that move the markets big.
Do you need to know this? Not necessarily for the technical side, but for your emotions, your psychology? Yes this is important.
Find the buyers and sellers (I have them marked in my chart), and learn to play alongside them. You will get better pricing, feel great about your positions, and know if it goes against you, you can cut the trade off early and reposition.
Hope you enjoyed, and happy Trading!
* A GAME OF PACIENCE *Yurrr XRPeers,
If you have been following my analysis, you was also prepared yesterday to a possible sellout from all the news we got.
That sellout happen today. If you were watching the market, you saw volume peaking as retail dumped all their XRP at the peak and sellers got in aggressively bringing the price down to the $2.4 range.
As you can see in the chart, I have two possible price targets for this little correction happening so check it out below for explanation.
T1:
- This first target is assuming that yesterday's pump is part of the first impulsive wave of the W3(green).
- If this scenario is correct, I'd expect buyers hold that $2.3 level and prepare for another impulsive wave.
- The price action that XRP is going through right now is favorable to it. There is a clear ABC pattern with wave A having 3 moves, wave B having 3 moves, and the starting of wave C that is expected to have 5 moves to be completed.
T2:
- For the second target, I'm assuming that yesterday's pump broke the consolidation that was happening before and formed a new top for W1.
- If that is the case, price could have a retracement beginning on T1 but a downtrend continuation that will aim at T2.
I would also like to bring your attention to the RSI, where we can see our Higher Lows trendline being tested and could either be broken or held strong depending on what's happening next.
It is still too early to know and I still haven't figured out how to predict the future, but all we really need to do is observe and prepare accordingly.
Let me know what you think!
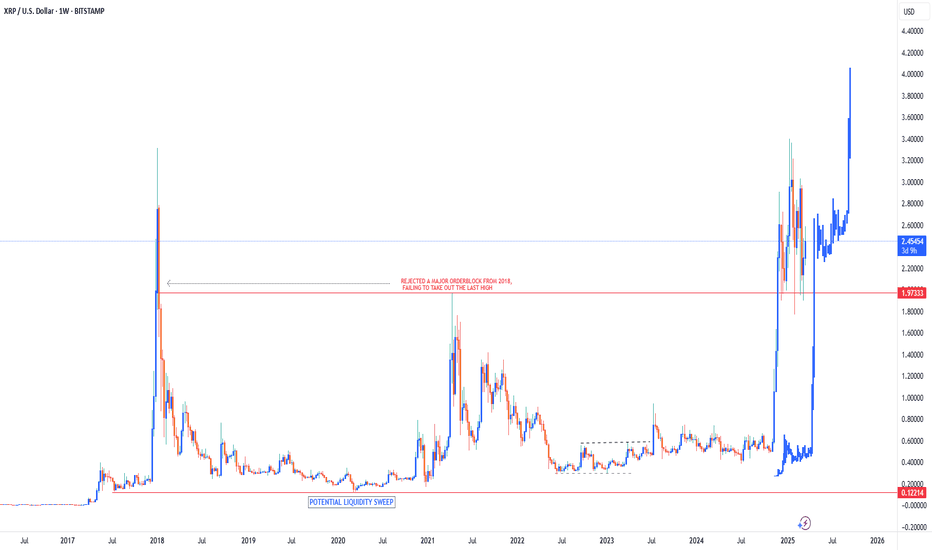
Xrp - Destroying All Hopes For Bears!Xrp ( CRYPTO:XRPUSD ) is heading for new all time highs:
Click chart above to see the detailed analysis👆🏻
Literally all cryptocurrencies are currently creating pump and dump like price action with swings of two digits within a couple of minutes. But if we look at the higher timeframe - specifically also on Xrp - markets are still 100% bullish and heading for new all time highs.
Levels to watch: $2.0, $5.0
Keep your long term vision,
Philip (BasicTrading)
The trend that is trendyAs you can see since November 24th, 2024 pump, this thing has not stopped trending to the upside. It is majorly super bullish. Don't listen to the naysayers. The chart is the news.
Xrp hasn't just been performing sideways action. It's already telling us exactly the directions It's headed before we go there. Patience 😏
Bearer of Bad News - Short $XRPI originally posted this idea several days ago, but it was flagged b/c I linked one of my social media accounts. Apologies for any typos - the format of my post got jacked up after copying/pasting. Crypto's going to break one way or another from current levels. Bitcoin has a wide supply zone (not super strong) 86267.86-92920.42, so watch how it reacts...
Strictly technical setup here. Near-term demand/buy zones were good for bounces across the crypto space. However, buying has been fairly tepid. Given the technical structure for many crypto underlyings, this is unsurprising (addressed in CRYPTOCAP:DOGE ( COINBASE:DOGEUSD ), CRYPTOCAP:BTC , CRYPTOCAP:TOTAL ideas). Barring a catalyst, it seems more likely that crypto (and risk assets generally) will trade lower before higher.
Unfortunately for bulls, BITSTAMP:XRPUSD has levels of daily supply near current price. Per the 1D chart, sell zone = 2.3265-3.4106, 2.5032-2.6487. Additional sellers are likely lurking between 2.6487 and 3.0153, though LTFs need to be analyzed for identification. If the RSI is printing < 60/65 if/when price reaches the abovementioned ranges, CRYPTOCAP:XRP could roll over and commence another bearish impulse wave. Use micro-timeframes to watch for signs of uptrend violation/termination + to confirm any short entries/long exits.
To bolster positional confidence, observe other cryptos, especially larger market caps. Correlative behavior can be a very helpful trading "odds enhancer". If other majors rally w/ significant volume/momentum, XRP will likely follow. Conversely, if BITSTAMP:BTCUSD , BITSTAMP:ETHUSD ( CRYPTOCAP:ETH ), etc. fizzle out, expect XRP to do the same.
If this idea materializes and shorts regain control, daily demand = 1.5414-1.2843, 1.1222-1.0033. Fib retracements reinforce the aforementioned buy zones. Because of the explosive nature of XRP's 2024 rally, the monthly/weekly charts have "tradeable voids" (expanded-range candlesticks). While traditional technicals tout large candles, they're a double-edged sword. Their elongated nature is often reflective of limited trading and gaps in order flow, which can have a vacuum-like effect if/when prices correct. It's great when you're on the right side of the trade creating the candles, but there's also not a lot of unfilled orders to stop price from moving rapidly in the opposite direction. So, if XRP sells off, don't be surprised if price moves quickly.
I'm a fan of confirmation entries vs. "catching a falling knife". Referencing RSI momentum + using micro-TFs to ID trend reversal signals can help prospective buyers reduce risk (and/or increase position size). When volatility strikes, preservation is paramount.
Thanks for reading! Feedback/engagement welcome.
Jon
XRP/USD Technical Analysis: Trend Reversal and Key Levels to WatThe overall price direction shows a transition from a downtrend to an uptrend, which can be broken down into 3 phases:
Strong Downtrend: At the beginning of the chart, the price declined sharply, dropping from levels above 2.50 to 1.89708 (lowest point).
Consolidation and Correction Phase: After reaching the low, the price started to consolidate and attempt to form a bottom. Several buy signals (green triangles) appeared at the bottom, indicating a potential reversal.
Clear Uptrend: Starting from the middle of the chart, the price began forming higher highs and higher lows, with moving averages crossing upwards, signaling a positive trend continuation.
The main reason for identifying the trend as currently bullish is:
Price recovery to 2.50 after forming a bottom at 1.89.
Moving averages crossing upward.
Increased buying momentum, as seen in technical indicators.
Bullish Indicators
Breakout above previous resistance at 2.30, allowing price to rally towards 2.50.
Moving Averages (MAs) show a positive trend, with price trading above the blue and red lines, indicating continued upward momentum.
Buy signals (green triangles) at lows, suggesting strong buying pressure.
Relative Strength Index (RSI) surpassing 60, indicating bullish momentum.
Increased trading volume during upward moves, confirming buying strength.
Bearish Indicators
Sell signals (red triangles) at resistance levels, which may indicate a price rejection or strong resistance around 2.50 - 2.52.
Price approaching a key resistance at 2.52, where it might struggle to break through without additional momentum.
RSI approaching overbought territory (near 80), which could signal a potential pullback.
High price volatility with a sudden spike, which may lead to short-term profit-taking.
Conclusion
Overall Trend: Bullish after breaking out of the consolidation phase.
Potential Upside Targets: If the price breaks 2.52, it could target 2.60 - 2.70.
Support Levels: 2.30, followed by 2.10 (in case of a pullback).
Resistance Levels: 2.52, then 2.60.
Expected Scenario: As long as price holds above 2.30, the bullish trend remains intact. However, if 2.52 is rejected, a slight pullback may occur before resuming the uptrend.
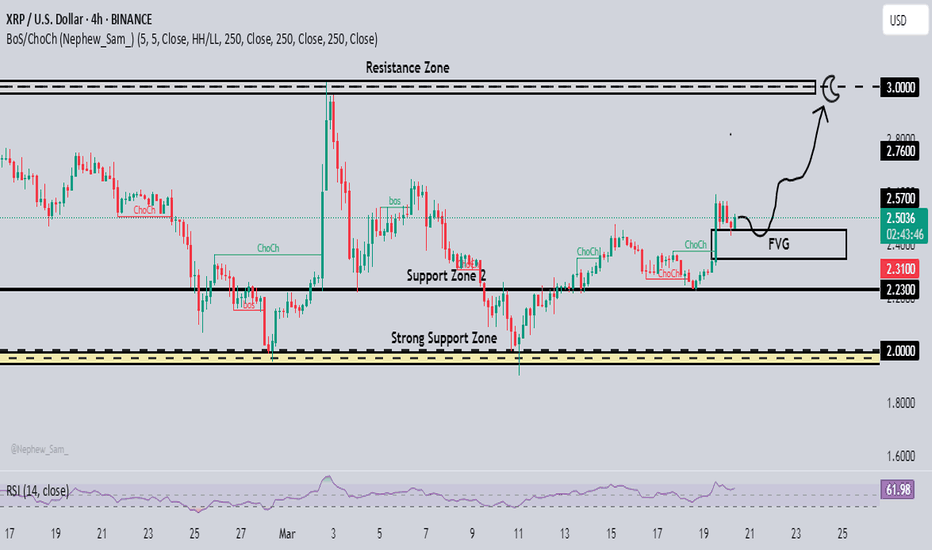
XRPUSD H1 Timeframe MARKET analysis to BullishBINANCE:XRPUSDT My Analysis XRP vs US Dollar shows a candlestick chart for XRP, a common tool in financial trading. It highlights support and resistance zones, which are key concepts in technical analysis. Key Points: First we look at the RSI which is hovering around 62.70 indicating an uptrend. On the other hand we look at Support and Resistance.
Strong Support Zone: 2.0000 Price has previously bounced off this level, suggesting buying interest.
Support Zone 2: 2.300 A recent support level, indicating a potential area for price recovery. Strong Resistance Zone: 3.3000 This is a weak strong resistance zone that could see a good chance of breaking above.
We would consider buying
XRPUSD Buy Entry Level:2.5020
TP: 2.5700
TP: 2.7600
TP: 3.0000
SL: 2.3100
XRP Wave 5 Starting Part 2Hello There,
There is the bullish case in which we bottomed and we are heading higher with a completed sideways combo in the wave 2. Currently we could be starting Wave 3 with a Leading Diagonal in the wave 1.
Probabilities? currently looking at both cases I think the bearish case may have a slight higher probability at the moment to dip in the $1.4 - $1.9 range first before hitting that $10 range.
Either way we have at least one more bullish wave left, so plan according with your holding and risk
GOD BLESS AND TRADE ON
Stay Humble and Hungry
XRP Wave 2 or Wave B incoming Part 1Hello there,
I am presenting a bearish (short term; current post) count and a bullish count (in my next post). This is showing that we hit a truncated top (see previous posts; attached) and we are coming down in the $1.9 - $1.4 ish range to compete Wave 2 (or could be Wave B) of cycle. I see us pushing to the $2.9 - $3.2 ish range to finish the C wave of the Major wave B of the wave 2 before finishing. it seems to me that we are making a Flat in this sideways chop.
please review and ask me any questions
GOD BLESS AND TRADE ON
Stay Humble and Hungry
* POST FOMC UPDATE *Great day for crypto and XRP today!
Not only because of the long awaited update on SEC case that came from Brad G, but also the pump created post FOMC today.
If you have been following my analysis, you are aware that price has been traveling as predicted. HOWEVER, it is still early to claim anything .
News pump definitely shakes up the market, but only after things are calmed down that we can see where we are.
I am still looking for a strong break of the $2.6 level(purple horizontal line) to confirm my bullish bias.
To keep things bullish, I have below 2 scenarios that I can see happening.
Scenario 1:
That's the scenario I showed you before.
In this scenario, Wave 1 peaks below the confirmation level, charges up on wave 2 and blasts through on wave 3. Price was moving slow and steady, but it was still following this path that I had shared with you all.
Scenario 2:
With the news that came out today, it becomes a little more risky to predict price movement.
Even though XRP pumped above the previous Wave 1 price, it still hasn't broke the $2.6 key level and is now showing signs of resistance around the level. With that in mind, it is possible that the peak you saw today is our new Wave 1, and price could retrace back (possibly even less than what is shown in the chart if buyers can defend that $2.3 support) before we go for the confirmation breakout.
On both scenarios, I expect price to move slow just like in the beginning of last pump, when price movement caught many by surprise and the FOMO meter went off the charts. I am also basing these scenarios on the idea that this pump might be near its end
Although I am just bringing up my bullish bias, there is still possibility of price going back towards $2 or lower to finish this consolidation phase. But I do believe that the crypto market has found its bottom, or at least we are pretty close.
What we must do now is take a nap and wake up when trading view send us the alert that will make husbands leave their wives and the unemployment rate to soar(iykyk).
For right now, let's remind ourselves that we are just observers of the market and that no one knows what the gods of the chart have planned for the future.
XRP SEC CASE WILL BE DROPPEDFellow crypto market betters,
As you are all aware, daddy Brad announced that XRP case will be dropped and the price jumped from the news alone.
I haven't seen any SEC announcements about the price yet, and today we do have some FOMC decisions coming out.
IN MY OPINION:
1) Be careful with the whole "Buy the rumor, sell the news" dumb money thing.
2) Although price looks like it is going towards target 3, it can still go down depending on what news comes out of FOMC.
News makes analysis a little more difficult because the volume and price action are many times just a "synthetic" data. It goes away pretty quick, and the price goes back to where it is supposed to be.
One interesting data that I kinda don't know what to think about it yet is shown in the charts.
- Both XRP and ADA have broken trend resistances in price and RSI. The pump for ADA wasn't as strong as for XRP so there's still indecision, even with the news pump we had today.
At the end of the day, congratulate your XRP supremacist who've been bothering you for the past 4 years for you to buy XRP and remained faithful through the ups and downs this drama took them.
XRP Update | $5Similar accumulation pattern to what we've seen last year December. Price action is holding up nicely above the 150d SMA on a daily TF with bullish closes also sitting above the 8d SMA.
Volume is looking very good too with price sitting above the value area.
I'm using the fibonacci extension to get a local target of $5.
XRPUSD breaking upward from invh&sTarget is $3. Very likely to hit the full target based on the bullish momentum from the sec ripple appeal being ofifcially dropped. Likely to continue upward from there as well but for this current idea I only wanna focus on the inv h&s target. *not financial advice*


