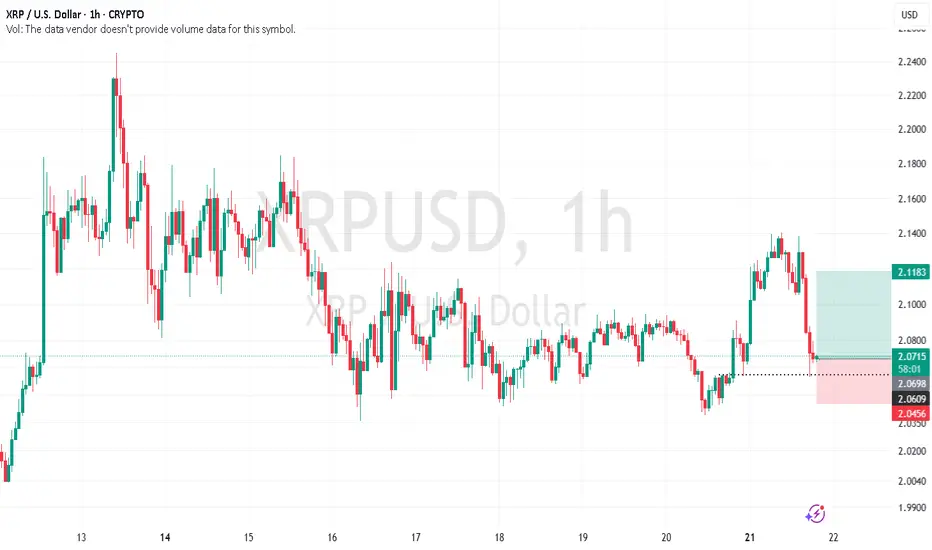
Long OpportunityXRP is currently at a support level. Consider buying with a tight stop-loss. Target: 2.107.
XRPBULLUSD trade ideas
Ripple Looking for 12$ next 60 daysThe U.S. Court of Appeals has GRANTED the joint motion by Ripple and the SEC to pause the ongoing appeal — signaling that a settlement could be imminent.
📄 No further briefs will be filed.
🗓 SEC has been ordered to submit a status report within 60 days.
⚖️ This move follows confirmation that both parties have reached an agreement-in-principle, pending final Commission approval.
What this means:
✅ Appeal proceedings are frozen
✅ Ripple gets breathing room
✅ Final resolution could be on the horizon
✅ Major regulatory precedent might soon be set

Weekly plan for XRPMarked the important levels in this video for this week and considered a few scenarios of price performance
Locally, the growth may continue and we will quickly see a breakdown of the 2.2 level
Write a comment with your coins & hit the like button, and I will make an analysis for you
The author's opinion may differ from yours,
Consider your risks.
Wish you successful trades! MURA

XRP - Modest outlook for 4.21.2025 -
We should see a little pullback around $2.10, I don't believe we will fall under $2.08 again.
With Derivatives trading going live on Coinbase today, we should see a nice push towards $2.25. If we get any more major news come out today, we will reach $2.50 in a hurry.
The bottom is in, if you missed buying under $2, now is your chance to buy under $3. I believe we won't be under $3 for much longer with so many catalyst coming.
THINGS TO WATCH:
- XRP has nearly 20 ETFs fixing to go Live over the next 30 days
- Trump has a plan with GOLD, potential pairing with XRP

Ripple: Target Zone Ahead!Ripple’s XRP remains on track to reach our magenta Target Zone between $1.03 and $0.38, even though the price has recently settled into another consolidation phase. Under our primary scenario, we expect the bottom of the magenta wave (2) to form within this range. Once that low is confirmed, fresh upward momentum should unfold during the following impulse wave (3), which has the potential to push XRP above the resistance at $3.39 and toward new all-time highs. However, if XRP breaks out to the upside before establishing the projected low within our zone, this zone will be considered void. We currently assign a 38% probability to this alternative scenario.

Is it time to all in on XRP ?Most of the time in crypto we sat past will happen again do you think it will this time too ?

XRP IS GOING TO MOONIn the cycle of 2017 the price of XRP hit an all-time high and then rejected by about 50%. Afterwards, it broke out above the resistance line and formed a double top.
The same pattern is about to repeat!
First price target: $10 . Second target: $50.

XRP Setup – H&S Pattern in the Making?This is how I see it...
Price tapped into a strong demand zone and is now showing signs of bullish intent. If this level holds, we might see a push to complete a potential inverse Head & Shoulders pattern.
My plan?
Let it dip a little to form the right shoulder, then watch for a break of the neckline and that descending trendline. If it clears that, I’ll be eyeing targets around 2.6–2.8.
Of course, I could be wrong — but the structure looks clean and the risk/reward here makes sense to me.
What do you guys think? Too early for a reversal or is XRP warming up?

XRP/USD "Ripple vs U.S Dollar" Crypto Heist Plan (Scalping/Day)🌟Hi! Hola! Ola! Bonjour! Hallo! Marhaba!🌟
Dear Money Makers & Robbers, 🤑 💰💸✈️
Based on 🔥Thief Trading style technical and fundamental analysis🔥, here is our master plan to heist the XRP/USD "Ripple vs U.S Dollar" Crypto Market. Please adhere to the strategy I've outlined in the chart, which emphasizes long entry. Our aim is the high-risk Red Zone. Risky level, overbought market, consolidation, trend reversal, trap at the level where traders and bearish robbers are stronger. 🏆💸"Take profit and treat yourself, traders. You deserve it!💪🏆🎉
Entry 📈 : "The heist is on! Wait for the MA breakout (2.1000) then make your move - Bullish profits await!"
however I advise to Place Buy stop orders above the Moving average (or) Place buy limit orders within a 15 or 30 minute timeframe most recent or swing, low or high level.
📌I strongly advise you to set an "alert (Alarm)" on your chart so you can see when the breakout entry occurs.
Stop Loss 🛑: "🔊 Yo, listen up! 🗣️ If you're lookin' to get in on a buy stop order, don't even think about settin' that stop loss till after the breakout 🚀. You feel me? Now, if you're smart, you'll place that stop loss where I told you to 📍, but if you're a rebel, you can put it wherever you like 🤪 - just don't say I didn't warn you ⚠️. You're playin' with fire 🔥, and it's your risk, not mine 👊."
📍 Thief SL placed at the recent/swing low level Using the 2H timeframe (1.9500) Day trade basis.
📍 SL is based on your risk of the trade, lot size and how many multiple orders you have to take.
🏴☠️Target 🎯: 2.2700 (or) Escape Before the Target
🧲Scalpers, take note 👀 : only scalp on the Long side. If you have a lot of money, you can go straight away; if not, you can join swing traders and carry out the robbery plan. Use trailing SL to safeguard your money 💰.
XRP/USD "Ripple vs U.S Dollar" Crypto Market Heist Plan (Scalping/Day) is currently experiencing a bullishness,., driven by several key factors. 👇👇👇
📰🗞️Get & Read the Fundamental, Macro, COT Report, On Chain Analysis, Sentimental Outlook, Intermarket Analysis, Future trend targets... go ahead to check 👉👉👉🔗
⚠️Trading Alert : News Releases and Position Management 📰 🗞️ 🚫🚏
As a reminder, news releases can have a significant impact on market prices and volatility. To minimize potential losses and protect your running positions,
we recommend the following:
Avoid taking new trades during news releases
Use trailing stop-loss orders to protect your running positions and lock in profits
💖Supporting our robbery plan 💥Hit the Boost Button💥 will enable us to effortlessly make and steal money 💰💵. Boost the strength of our robbery team. Every day in this market make money with ease by using the Thief Trading Style.🏆💪🤝❤️🎉🚀
I'll see you soon with another heist plan, so stay tuned 🤑🐱👤🤗🤩

XRP on the go!Hello TradingView Family / Fellow Traders. This is Richard, also known as theSignalyst.
📈 Medium-Term: XRP has been in a correction phase trading within the falling wedge marked in red.
📍 As it retests the lower bound of the channel — which perfectly intersects with the orange demand zone and the $1.5 round number — I’ll be looking for short-term longs.
🚀 For the bulls to take over in the long term and kick off the next bullish phase, a breakout above the red structure at $2.26 is needed.
Which scenario do you think will happen first — and why?
📚 Always follow your trading plan regarding entry, risk management, and trade management.
Good luck!
All Strategies Are Good; If Managed Properly!
~Rich

XRP/USD "Ripple vs U.S.Dollar" Crypto Market Heist (Swing/Day)🌟Hi! Hola! Ola! Bonjour! Hallo! Marhaba!🌟
Dear Money Makers & Robbers, 🤑💰✈️
Based on 🔥Thief Trading style technical and fundamental analysis🔥, here is our master plan to heist the XRP/USD "Ripple vs U.S.Dollar" Crypto Market. Please adhere to the strategy I've outlined in the chart, which emphasizes short entry. Our aim is the high-risk Green Zone. Risky level, oversold market, consolidation, trend reversal, trap at the level where traders and bullish robbers are stronger. 🏆💸Book Profits Be wealthy and safe trade.💪🏆🎉
Entry 📈 : "The heist is on! Wait for the breakout (2.0500) then make your move - Bearish profits await!"
however I advise placing Sell Stop Orders below the breakout MA or Place Sell limit orders within a 15 or 30 minute timeframe. Entry from the most recent or closest low or high level should be in retest. I Highly recommended you to put alert in your chart.
📌I strongly advise you to set an "alert (Alarm)" on your chart so you can see when the breakout entry occurs.
Stop Loss 🛑: Thief SL placed at (2.3000) Swing / Day Trade Basis Using the 5H period, the recent / swing high or low level.
SL is based on your risk of the trade, lot size and how many multiple orders you have to take.
Target 🎯: 1.6500 (or) Escape Before the Target
🧲Scalpers, take note 👀 : only scalp on the Short side. If you have a lot of money, you can go straight away; if not, you can join swing traders and carry out the robbery plan. Use trailing SL to safeguard your money 💰.
XRP/USD "Ripple vs U.S.Dollar" Crypto Market Heist Plan is currently experiencing a bearishness,., driven by several key factors.
📰🗞️Get & Read the Fundamental, Macro, COT Report, On Chain Analysis, Sentimental Outlook, Intermarket Analysis, Future trend targets.. go ahead to check👉👉👉🔗
⚠️Trading Alert : News Releases and Position Management 📰 🗞️ 🚫🚏
As a reminder, news releases can have a significant impact on market prices and volatility. To minimize potential losses and protect your running positions,
we recommend the following:
Avoid taking new trades during news releases
Use trailing stop-loss orders to protect your running positions and lock in profits
💖Supporting our robbery plan 💥Hit the Boost Button💥 will enable us to effortlessly make and steal money 💰💵. Boost the strength of our robbery team. Every day in this market make money with ease by using the Thief Trading Style.🏆💪🤝❤️🎉🚀
I'll see you soon with another heist plan, so stay tuned 🤑🐱👤🤗🤩

He is risen! And so will XRP $5Just like Jesus rose from the grave, XRP is rising soon! And it will touch the sky!

XRP/USD "Ripple vs U.S Dollar" Crypto Market Heist Plan🌟Hi! Hola! Ola! Bonjour! Hallo! Marhaba!🌟
Dear Money Makers & Robbers, 🤑💰✈️
Based on 🔥Thief Trading style technical and fundamental analysis🔥, here is our master plan to heist the XRP/USD "Ripple vs U.S Dollar" Crypto market. Please adhere to the strategy I've outlined in the chart, which emphasizes long entry and short entry. 🏆💸Be wealthy and safe trade.💪🏆🎉
Entry 📈 :
"The loot's within reach! Wait for the breakout, then grab your share - whether you're a Bullish thief or a Bearish bandit!"
🏁Buy entry above 2.4700
🏁Sell Entry below 2.10000
📌However, I recommended to place buy stop for bullish side and sell stop for bearish side.
Stop Loss 🛑:
🚩Thief SL placed at 2.2000 (swing Trade Basis) for Bullish Trade
🚩Thief SL placed at 2.35000 (swing Trade Basis) for Bearish Trade
Using the 3H period, the recent / swing low or high level.
SL is based on your risk of the trade, lot size and how many multiple orders you have to take.
Target 🎯:
🏴☠️Bullish Robbers TP 3.1000 (or) Escape Before the Target
🏴☠️Bearish Robbers TP 1.65000 (or) Escape Before the Target
XRP/USD "Ripple vs U.S Dollar" Crypto Market Heist Plan is currently experiencing a neutral trend,., driven by several key factors.
📰🗞️Get & Read the Fundamental, Macro, COT Report, On Chain Analysis, Sentimental Outlook, Intermarket Analysis, Positioning and future trend..👉👉👉
📌Keep in mind that these factors can change rapidly, and it's essential to stay up-to-date with market developments and adjust your analysis accordingly.
⚠️Trading Alert : News Releases and Position Management 📰 🗞️ 🚫🚏
As a reminder, news releases can have a significant impact on market prices and volatility. To minimize potential losses and protect your running positions,
we recommend the following:
Avoid taking new trades during news releases
Use trailing stop-loss orders to protect your running positions and lock in profits
💖Supporting our robbery plan 💥Hit the Boost Button💥 will enable us to effortlessly make and steal money 💰💵. Boost the strength of our robbery team. Every day in this market make money with ease by using the Thief Trading Style.🏆💪🤝❤️🎉🚀
I'll see you soon with another heist plan, so stay tuned 🤑🐱👤🤗🤩

XRPThe next leg up is NOW.
We've bounced off the .786 fib nicely, next we're eyeing a fast push towards $3.
I don't think we will ever fall below $2 again, SWIFT news is coming, ETF approvals are less than a month away, and the U.S. government will make a move to save the dollar.
We are on the cusp of something truly incredible.
LOCK IN. 🔒

Bullish momentum 4H XRPXRP is sitting at support with supported by and uptrend and a bullish engulfer in range zone.
Also an important Fib 0.5 level. there is a Hidden bullish divergence as well. if the price manages to break above the range there is an upward potential.
Disclaimer: Manage your risk/reward and DYOR as well.

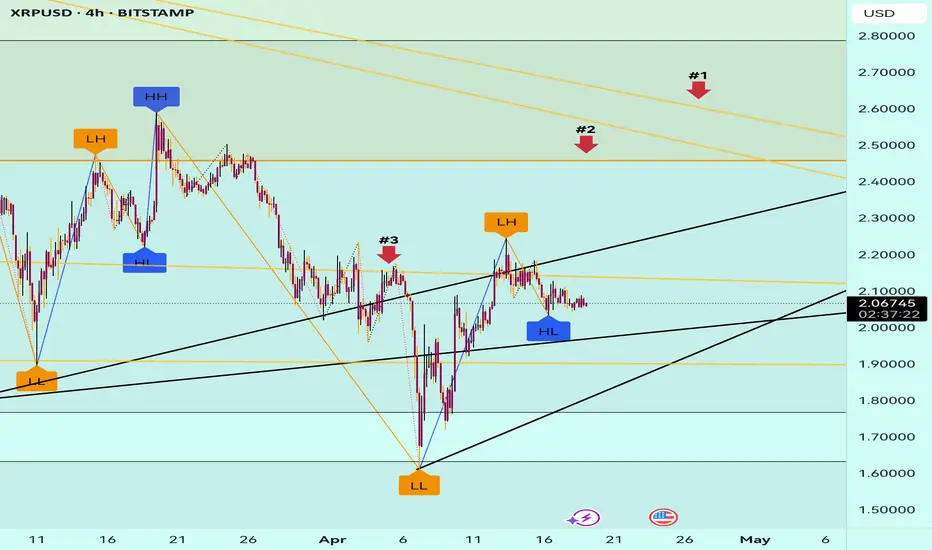
#XRP Analysis [19.04.2025] – Key Levels for Trend Reversal #XRP Analysis – Key Levels for Trend Reversal
After a prolonged retracement, #XRP is now attempting to reverse its trend. Here’s a clear roadmap for confirmation:
### Critical Levels to Watch
1. Arrow #1 (Yellow Line)
- *First hurdle*: Price must break this level to signal initial bullish momentum.
- Current struggle: Even the black line (immediate resistance) is holding strong.
2. Arrow #2
- *Confirmation zone*: A break above Arrow #1 must be followed by a close above Arrow #2 to validate the reversal.
3. Arrow #3
- *Launchpad*: Once Arrow #2 is cleared, this level becomes the final checkpoint before a potential price surge.
### The Big Picture
- The black area highlights a massive trading range—consolidation here indicates strong indecision.
- Until Arrow #1 breaks, the trend remains *neutral/bearish*.
Key Takeaway: Patience is key! Watch for:
✅ Break & close above Arrow #1 → Early signal.
✅ Follow-through to Arrow #2 → Confirmation.
🚀 Arrow #3 breach → Potential trend acceleration.
*Stay tuned for updates!* #XRPArmy
We are not early… we are right on time.📊 Overview:
The chart above shows what I believe is a nearly textbook Wyckoff Accumulation pattern, and we are currently transitioning out of the Spring and Test phase. The price action is aligning closely with the Wyckoff schematic overlayed in the lower quadrant of the chart — a clear signal that XRP is preparing for a major markup.
This is not hopium. This is structure. Let’s break it down.
⸻
📈 Wyckoff Phase Breakdown (Annotated on Chart):
PSY (Preliminary Support): Initial signs of strong demand entering the market — visible in late 2024.
AR (Automatic Rally): Rapid reaction after the first significant selloff.
BC (Buying Climax): High volatility and volume with a strong peak around $3.40, setting the upper resistance.
ST (Secondary Test): Fails to break new highs, confirming resistance.
UT Phase B (Upper Testing): Price starts creating lower highs within a descending wedge, shaking out weak hands — this is the grind through the Creek.
Spring: The bear trap. Price dips below support briefly, likely scaring off retail before a quick recovery.
Test: Re-entry above support with low volume, confirming the Spring and setting up the markup phase.
This structure is almost 1:1 with Wyckoff’s schematic, even down to the slope of the Creek and the timing of the Test. You literally couldn’t script this better unless it was done on purpose.
⸻
🔮 Price Projections (Based on Structure):
Here’s what I see unfolding — and yes, I’m going on the record:
1. Support is confirmed: The $2.03–$2.07 zone is a bedrock. A breakdown from here would likely require a black swan event.
2. Near-term Upside:
• Within 12 days, XRP is poised to break above the resistance of the descending wedge, launching to $2.75 (+/- 0.1–0.04).
• A slight pullback to $2.58 follows, forming a Last Point of Support (LPS).
3. Mid-May Target:
• By May 12th, XRP is targeting $3.35, nearing the previous BC level.
• Expect consolidation/crabbing between $2.96–$3.29 for roughly two weeks as institutions finish their accumulation.
4. Final Breakout:
• Compression leads to an explosive move above $3.40, launching the official 2025 bull run.
• Potential jump across the creek aligns with May 27th, a date worth watching.
⸻
🧠 Final Thoughts:
If you’ve studied Wyckoff and ignored all the noise, this setup should be lighting up your radar. XRP’s price is showing us everything we need to see — structure, confirmation, accumulation, and now strength.
If you’re still unsure, go back and look at historic Wyckoff plays — Bitcoin 2020, Ethereum’s 2017 run — and compare. The blueprint doesn’t lie.
This is how whales operate. If you’re reading this, you’re on the right side of the game.
⸻
📌 Let me know your thoughts in the comments — agree, disagree, or calling me delusional, it’s all welcome.
#Wyckoff #XRP #CryptoTA #AltcoinSeason #BullRun2025 #SmartMoney #TechnicalAnalysis #Accumulation

THOUGHTS ON XRPXRP/USD 4H - This is not a pair I really trade, its just a coin I have invested in and am currently holding. I believe we will see some temporary bullishness, trading us into the area above before a move to the downside.
Now with me being a believer in XRP and with me holding the coin, you'd have thought that I believe price will trade us higher longer term, and the answer to this is I do, but not before a move to the downside first.
I think price will clear orders within the area of Supply, people will offload orders as well giving us a move to the downside, this move will trade price down and into a large area of Demand I have marked out.
Once price trades into that, introducing a-lot of Demand that is when I feel price will then take its next hike to the upside, surpassing previous highs set this year. The area of Demand I have marked out is quite large.

XRP BULL RUN LOADING - MID MAY BREAKOUT??My analysis is that we will see a bull run middle to end of may that breaks us out of the bullish flag that we see on our weekly chart. It may take longer than that but eventually we will breakout of that pattern and our next ATH should be something like 5$. Thoughts?


XRPThe liquidity has been drained
ITS GO TIME !!
LOCK in, your future self depends on it.
GENERATIONAL WEALTH IS COMING

XRP forms inv. H&S, suggesting a 21% upsideXRP is nearing a key trendline with an inverse head and shoulders pointing to a possible breakout. Watch 2.1974 closely. Targets at 2.47 and 2.67 offer strong risk-reward.
This content is not directed to residents of the EU or UK. Any opinions, news, research, analyses, prices or other information contained on this website is provided as general market commentary and does not constitute investment advice. ThinkMarkets will not accept liability for any loss or damage including, without limitation, to any loss of profit which may arise directly or indirectly from use of or reliance on such information.

XRP - one of the best looking ALTA lot of fear happened in the market and a lot of people are out after this flush.
I believe XRP is one of the better looking coins, most coins are trading near all time low while XRP is still trading around 2 dollars.
What i mean is that once buyers get more confident that a bottom is formed, a lot of coins will see 100 or 200% to the upside. While most coins will not see an all time high at that moment, XRP will trade above 4 dollar just with a 100% increase.
When we look at the charts i believe that a 5th wave still need to happen and that we can reach between 15 and 20 dollars at the peak.
Keep a few things in mind what can be a catalyst for XRP to surge.
Many ETF's are waiting to be launched, the SEC will in the near future conclude the case against Ripple..
Let's take a look at following chart's what also can be bullish.
