Trade Setup: XRP Short OpportunityMarket Context:
Following Sunday’s full retrace, XRP appears to have set in a complacency bounce. Price action is weakening into mid-range, suggesting a potential short opportunity after one more push higher.
Trade Details:
Entry Zone: $2.70
Take Profit Targets:
$2.10
$1.55
$1.00
Stop Loss: Daily close above $3.10
This setup anticipates further downside once momentum shifts, confirming a clean rejection from resistance. 🔥
XRPBULLUSDT trade ideas

XRP Market Update📊 CRYPTOCAP:XRP Market Update
Welcome to today's analysis! Let’s break down the current price action on CRYPTOCAP:XRP and its potential movement.
🌐 Overview: CRYPTOCAP:XRP Approaching Key Support
📉 CRYPTOCAP:XRP is approaching the green support zone, a key level where buyers might step in to trigger a bounce.
🔄 Current Scenario:
If CRYPTOCAP:XRP holds the green zone, we could see a bounce from this level.
The market is currently forming a lower high (LH) structure, indicating that the downtrend is still in play.
For the trend to turn bullish again, CRYPTOCAP:XRP needs to break above the last LH, confirming a shift in momentum.
🔑 Key Levels to Watch
🟢 Support Zone: Green Level (Potential bounce area)
🔴 Lower High (LH) Resistance: Needs to be broken for a bullish trend confirmation
🛠️ Trade Scenarios
📌 Bullish Scenario (Bounce from Support & Break Above LH)
If CRYPTOCAP:XRP holds the green support, we could see a bounce leading to an attempt to break the previous LH.
A confirmed breakout above the LH would signal a bullish trend reversal.
📌 Bearish Scenario (Break Below Support)
If CRYPTOCAP:XRP fails to hold the green zone, the price could continue its downtrend, leading to further declines.
📌 Conclusion
CRYPTOCAP:XRP is at a key decision point—a bounce from the green support zone followed by a breakout of the LH would confirm the trend turning bullish again. If the price fails to break above the LH, the downtrend may continue.

XRP bullish pattern#XRP made a triangle whith 5 waves i think that this coin is targeted the supply zone in higher prices you can make a long position with 5X leverage


XRP is going to explode !#XRP made a nice triangle as you know its possible that it become one of the coins with a demand of USA government so i think that if this coin crosses the confirmation line its able to make a huge rise !

XRP - Strong Support Ahead!Hello TradingView Family / Fellow Traders. This is Richard, also known as theSignalyst.
📈XRP has been in a correction phase trading within the falling orange channel and it is currently retesting the lower bound of it.
Moreover, the green zone is a strong structure and round number $2.
🏹 Thus, the highlighted blue circle is a strong area to look for buy setups as it is the intersection of structure and lower orange trendline acting as a non-horizontal support.
📚 As per my trading style:
As #XRP approaches the blue circle, I will be looking for bullish reversal setups (like a double bottom pattern, trendline break , and so on...)
📚 Always follow your trading plan regarding entry, risk management, and trade management.
Good luck!
All Strategies Are Good; If Managed Properly!
~Rich

Fill FVG**XRP/USDT – 15-Minute Chart Analysis**
The price experienced a sharp breakout, followed by a pullback to a key resistance zone around **2.7250 - 2.7300**. A descending trendline is acting as resistance, aligning with this area.
If the price fails to break above this level, it may continue its downward movement, potentially targeting the **2.5900** range. The overall structure suggests a bearish bias unless a significant reversal occurs.
Monitoring price action around this resistance zone will be crucial in determining the next move.

Xrp UpcomingProfit securing trade. i hope you make good profit.
Three things to consider.
1-Buy whenever it reaches that price no wait or earlyness.
2-Dont hesitate to sell in super profit
3-Comment and also share this setups accuracy

XRP hit the golden pocket - are we going down now? Checking the chart of XRPUSDT i see that if we draw the fibs down from the top in January to the bottom last week, we saw that yesterdays rally - Trump communicated which currencies will be strategic reserve for the US - came up to almost touching the golden pocket.
Are we going back down now? What do you think?

XRP Approaching Critical Resistance—Breakout or Major Rejection?Yello, Paradisers! Is #XRP gearing up for a massive breakout, or is this just another bull trap? Let’s break it down before the market makes its move!
💎#XRPUSDT has been respecting a major ascending channel, holding firm at key support levels. The recent price action has even formed a morning star-like pattern around support, signaling a potential bullish push ahead. But here’s the catch—bulls need to clear the $2.80 resistance first to open the path toward $3.00–$3.10, a major battle zone that could either fuel the next rally or lead to another rejection.
💎If buyers manage to break through the $3.10 resistance, we could see an explosive move toward $3.50–$3.60, aligning closely with the 1.272% Fibonacci extension—a historically significant level where profit-taking could kick in.
💎On the flip side, XRP is still getting solid support from its ascending trendline, which has held strong since December 2024. As long as this structure remains intact, bulls remain in control, and dips will likely be seen as buying opportunities. However, if this support breaks, expect a deep pullback before the next leg up.
Remember, Paradisers, trading is a game of patience and discipline.
MyCryptoParadise
iFeel the success🌴

XRP Breakout Setup – Perfect Harmonic Pattern#XRP is setting up for a massive move!
✅ Harmonic Pattern in Play – Harmonic pattern is forming, signaling a potential reversal.
✅ Bullish Divergence – RSI/MACD is showing strength, indicating momentum shift.
✅ Key Resistance Level – A breakout above could trigger a strong rally.
Trading Plan:
Wait for a confirmed break and retest of the resistance.
Enter a long trade with stop-loss at 2.31 and target 2.6 to 2.7.
Risk Management: Using a 1:2 or higher risk-reward ratio.
Will #XRP break out or fake out? Drop your thoughts below!

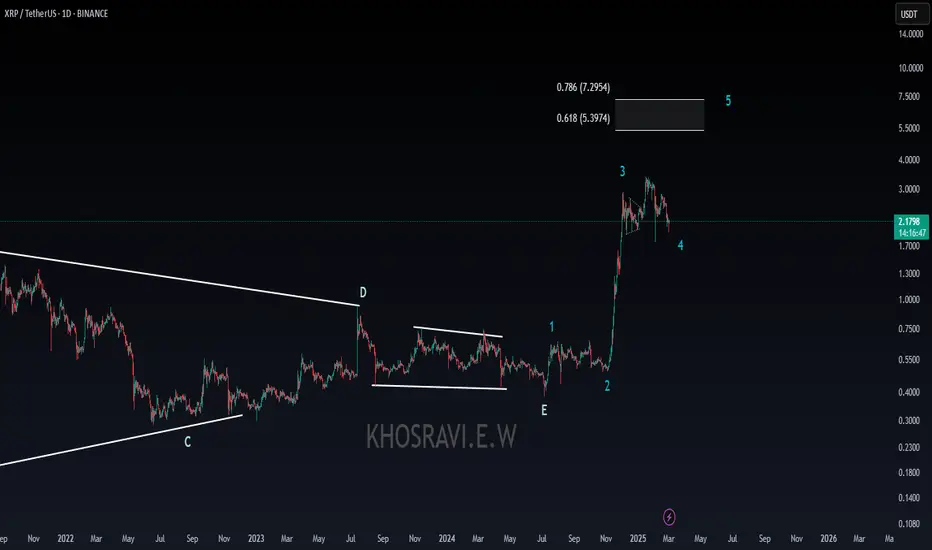
XRP Long-Term: Full Analysis—ATH Potential, Support & ResistanceWe are good with the short-term. We secured a great entry. It is time to consider how far up XRP will go and bull-market dynamics. How is XRPUSDT likely to behave in this 2025 bull-market.
The first data point to consider is the fact that XRP peaked early in 2021, it did so in April. This time around, this won't be the case. XRPUSDT is likely to go the full cycle together with the rest of the market. That is because the action that led to the April 2021 peak started in March 2020, strong bullish action for more than a year. In this cycle, XRP started growing in November 2024. An entire year growing would put a final peak around November 2025. This is the date that I am looking for most of the projects to peak. I will adapt and change if necessary as the action develops but I am still thinking that the bull-run will run into late 2025 and even into early 2026.
➖ Support & Resistance
There is a very strong resistance at $3.00.
$2.35 is the main support.
In December 2024, XRPUSDT peaked at $2.90, right below three. After a small retrace, it pierced the $3.00 barrier but closed below. Twice in January $3.00 worked as resistance and the third time a correction showed up.
The action is now happening below $3.00 and this is the final resistance, the last barrier. Once this level break, ALL-IN, full force. XRPUSDT will produce a major advance and produce several new All-Time Highs.
After the $3.00 barrier is broken, the main range were resistance will be found is between $4.44 and $4.68. This is a take profits target. Even if higher prices materialize later down the road, there will be a strong reaction around this level.
I am only mentioning the main levels. Next, we have $6.15 and $6.36 as the strongest resistance. This one should be monitored carefully. Whales and advanced traders will be watching this level for massive profit taking. If this level is conquered, there is no limit as to how high prices can go. We can enter a parabolic cycle. Some extremely bullish event would need to develop to support this type of growth. Or, the fifth wave is the speculative wave, so anything goes.
➖ Market Talk
The market will become tricky. Daily action will be erratic. Volatility in short. The big players will produce all sorts of moves in an attempt to remove weak hands, this will happen non-stop on the way up. It will be very hard to know what is going on and it will be easy to lose focus. To stay centered and grounded, just think long-term. When you zoom-in too close and start to get anxious, just remember the bigger cycle and the fact that the bull-market lasts the entire year. Detach, reduce leverage and hold. Once you are centered resume the game. Do not trade when you lose focus or you can end up closing your position on an impulse and there is no way to recover the great entry price.
➖ Speculation
Looking at the chart structure, I think it will be easy for XRP to move beyond $8. If we consider 2025 fully bullish, then much more is possible but I don't want to get in too deep, if you know what I mean. But I sure want to say that the conditions are extremely good and hyper-bullish. If you are going to err, err on the higher end. Aim high, aim up.
Thanks a lot for your continued support.
Namaste.

XRPUSDT 1DXRP ~ 1D Analysis
#XRP Buying when re -testing this support line may not be too bad.
with a short -term target of at least 10%+ from here.

XRP-- Ripple Hi everyone
Xrp can have another upward leg and there exists some fundamental support.
So in my opinion these levels are good to buy some.
DYOR!
Good luck

XRPUSDT short term move idea.....ive been out the game for a while guys , but i have been lookin at xrp for for a little bit , this is what i see for short term.

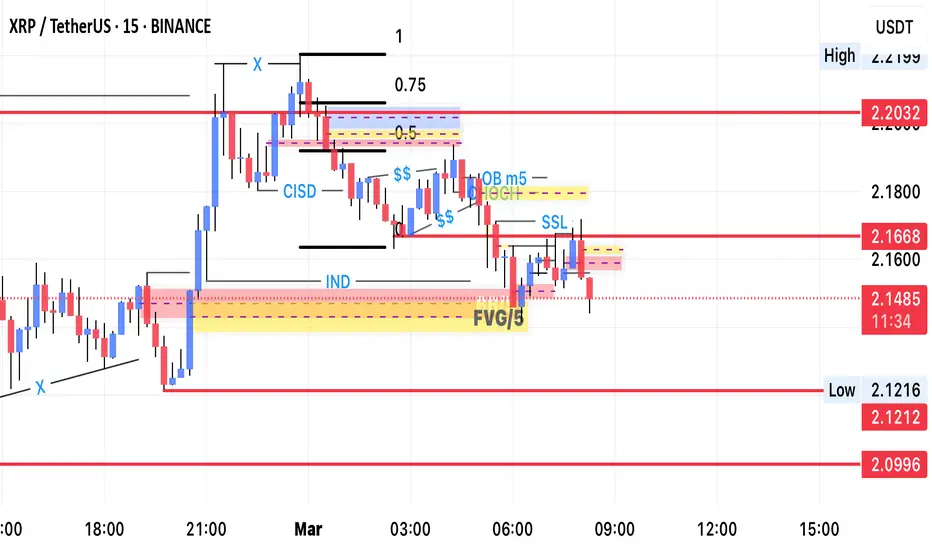
XRP/USDT Trade Update Smart Money & Wyckoff Accumulation Analysis
Timeframe: 3-15-Minute Chart
Current Price: ~$2.0033
Risk/Reward Ratio: 7.29 (High R/R setup!)
Key Observations:
Wyckoff Accumulation Phase
Accumulation MACRO Zone Identified (highlighted on chart)
5-Wave Move Down – Classic Elliott Wave completion, signaling a potential reversal.
Liquidity Grab Below Lows – Price has taken out stop-losses before forming a bullish structure.
Smart Money Concepts & Order Flow
Mitigation Blocks (MB) & Fair Value Gaps (FVGs) indicate a strong potential for reversal.
Bullish Order Blocks (OBs) forming at key levels.
0.618 Fibonacci Confluence near the entry, adding more confidence.
Trade Setup
Entry Zone: ~$1.98 - $2.00
Stop-Loss: $1.9464 (1.55% downside)
Take-Profit (TP): $2.36 (+15.80 upside)
✅ Risk-to-Reward Ratio: 7.39R (very favorable setup!)
4️⃣ Potential Target Areas
First target: $2.25 (Liquidity zone)
Final target: $2.36 (Major resistance zone)
Bearish Case (Invalidation Scenario)
A clear breakdown below $1.9464 (stop-loss level) would invalidate this bullish setup.
If price struggles to reclaim the bullish structure, smart money may be targeting lower liquidity levels before reversal.
Final Thoughts
This trade setup is highly favorable with a strong Wyckoff Accumulation pattern, liquidity grab, and smart money confluence.
If price follows the structure, we could see a sharp rally towards $2.36
Trade smart, manage risk & let the market do the work! 🔥

XRP interesting POIs for shortThere are some Short opportunities.
Short right now or wait for those red levels.
Warning: XRP is not a coin, its an indicator hhh.
don't use leverage over 2x. XRP is always risky!
Lets see how it acts when reaches those levels (volume and TA etc.)
Follow for more ideas/Signals. 💲
Look at my other ideas ;)
Just donate some of your profit to Animal rights and rescue or other charity :)✌️

Price Reactions to Drawn ZonesThe suggested positions are only applicable after receiving the necessary confirmations and do not represent definitive trading points. It is understood that entry and exit points may be updated during the trade. Please note that this is solely an analysis and not a financial or trading recommendation. The responsibility for any risks taken lies with the readers. Wishing you success.

XRP is in Trump's bagJust a news flash; crypto spike on a Sunday morning with Trump endorsing ADA SOL and XRP. Will this inspire a buying frenzy? Could this be the catalyst for a new ATH or just another rug pull?
Crazy how slowly news spreads on here.

XRP - Long termIt should be noted that any asset may experience a sudden decrease in value, but XRP has had a slight decrease in price after a 150% increase from the price of $0.50. Although this currency will definitely increase in the future, it is necessary to pay attention to the decreases and make purchases within the price support areas because these support areas are highly regarded by the general public. In this analysis, two limits have been identified that are used to enter the market in the event of a price drop.
Sasha Charkhchian

My analysis for todayThere’s a short move of long on that 5min ob + fvg to that above marked supply zone

My view on this pairPlease drop down to 5mins to see the markings properly in their place, this is my understanding on this chart feel free to guide me if any mistake
XRP ANALYSISVery important #XRP analysis on the daily time frame
Which in my opinion is one of the most important time frames to understand and comprehend the next movement of this currency.
So stay with us to be aware of the Ripple trend
If you liked this analysis, share it with your friends
Thank you