XRPBULLUSDT trade ideas
XRP at its strongest resistance, LONGS be careful!!Join our community and start your crypto journey today for:
In-depth market analysis
Accurate trade setups
Early access to trending altcoins
Life-changing profit potential
Let's analyze XRPUSDT on lower time frame:
XRP recently experienced a significant 470% surge within a month. However, this rapid rally is suspected to be a bull trap. Historical data, particularly the 2021 pump followed by an 80% decline, suggests weak investor sentiment. As XRP is currently trading near its strongest resistance, a potential pullback or sideways movement is anticipated. A retest of support levels seems likely before any further upward movement.
RSI overbought (LTF): Indicates potential correction.
MACD slowing momentum (LTF): Suggests a possible pullback.
Key support zones:
$2.22
$1.85
$1.41
Key resistance levels:
$2.9
$3.2
If you find this analysis helpful, please hit the like button to support my content! Share your thoughts in the comments and feel free to request any specific chart analysis you’d like to see.
Happy Trading!!
XRPUSDT: Support and resistance!!Join our community and start your crypto journey today for:
In-depth market analysis
Accurate trade setups
Early access to trending altcoins
Life-changing profit potential
Let's analyze XRPUSDT:
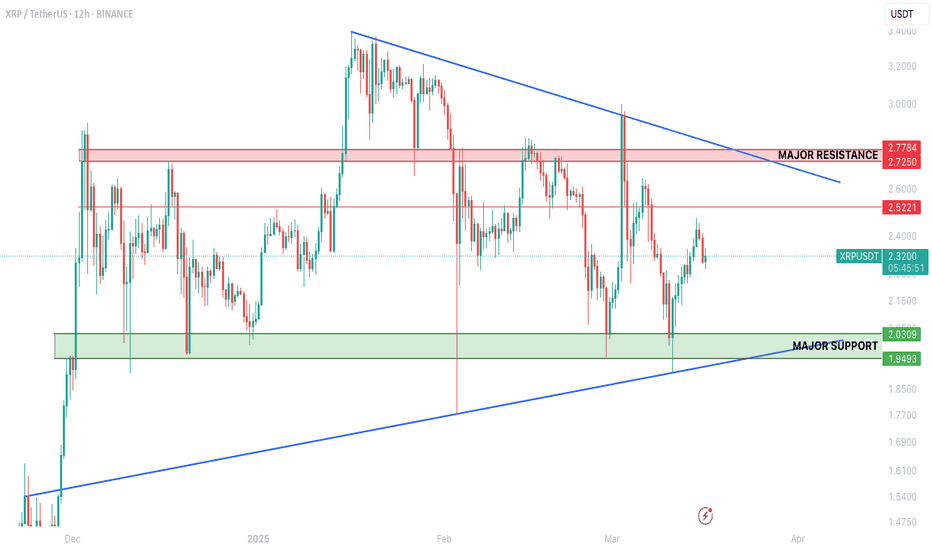
XRPUSDT has been confined within a $2.03 to $2.72 range for a prolonged duration. The $2.03-$1.94 zone has repeatedly proven to be a strong support, with XRP consistently rebounding from it. Currently, the immediate resistance lies at $2.52 on the daily chart. A successful breach of this level could propel XRP towards the $2.72-$2.78 resistance area. Traders should closely monitor these key levels for potential trading opportunities, as a break in either direction could signal a significant price movement for XRP.
Key support zones:
$2.03
$1.94
Key resistance levels:
$2.52
$2.72- $2.78
If you find this analysis helpful, please hit the like button to support my content! Share your thoughts in the comments and feel free to request any specific chart analysis you’d like to see.
Happy Trading!!
XRP ANALYSIS🚀#XRP Analysis :
🔮As we can see in the chart of #XRP that there is a formation of "Falling Wedge Pattern". In a daily timeframe #XRP broke out the pattern. Expecting a bullish move in few days if #XRP retest the levels
⚡️What to do ?
👀Keep an eye on #XRP price action. We can trade according to the chart and make some profits⚡️⚡️
#XRP #Cryptocurrency #TechnicalAnalysis #DYOR
[XRP] 2025.04.18***Follow SEOVEREIGN to receive real-time alerts.
**Boosts help SEOVEREIGN continue analyzing more assets.
**Our team regularly publishes in-depth reports on the cryptocurrency market.
XRP has been showing a steady upward trend after establishing support near the 2.04 level.
The current chart structure is interpreted as part of a B-wave correction phase, which may serve as a foundation for a potential medium-term bullish reversal.
A detailed wave count has been marked in the idea for further reference.
Projected target levels are as follows:
First target: 2.1665
Second target: 2.2478
Third target: 2.2751
In the short term, a double bottom formation has been identified, and a sustained rebound is likely to unfold from this support structure.
This setup provides a strong basis for defining key levels within the medium-term bullish scenario, and offers valuable signals for anticipating the next wave progression.
XRPUSDT will go uphi traders,
Let's have a look at XRPUSDT on 1D time frame.
The price broke the downsloping resistance, and the trend reversal may be around the corner.
I'm expecting the price to test 3,35 within the next 3 months.
Entry, targets (take profit levels) and stop loss are shown on the chart
XRP XRPUSDT $XRP #XRP Shaping Watch for an entrySupport around the yellow horizontal line is being tested multiple times, making it critical.
If price breaks above the pink descending trendline, especially with volume, it could signal a trend reversal or bullish continuation.
A breakout above the pink descending trendline with solid volume (look for a strong green candle closing above the trendline).
Confirm with:
Volume spike
9 EMA (yellow) crossing above 21 EMA (red)
Price holding above horizontal resistance (~same yellow line as current upper range)
📍 Entry Zone:
Approx. just above the recent lower highs (watch that pink trendline area)
🎯 Target Zones:
First target: The recent high range (top of the sideways range)
Second target: The peak of the prior rally (around the December highs)
Third target (stretch): Measure the previous move (flagpole) and apply it from the breakout point
🛑 Stop Loss:
Just below the most recent swing low (under horizontal support)
XRP is showing strength after defending the $2 XRP is showing strength after defending the $2 value area low, rejecting downside pressure from the recent swing low at $1.60. The bounce opens the door for a move back into the value area high region.
Key Points:
$2 support has held, with a confirmed swing failure pattern below $1.60.
Value area high near $2.30 aligns with descending channel resistance.
While price remains within a high time frame descending channel, the current bounce could trigger a short-term rally toward the top of the range. As long as $2 holds and volume improves, a 15% upside rotation remains likely. But without volume confirmation, price may stay range-bound.
XRP is holding key support above $2 after a swing failure at $1.60, setting up a potential 15% move toward the range high. However, low volume remains a concern, and price action may stay rotational within a descending channel until a confirmed breakout occurs.
XRP Short Term Analysis (4H)XRP is exhibiting bullish signals supported by multiple technical indicators.
An Inverse Head and Shoulders pattern has clearly formed on the chart, indicating a potential reversal from the previous bearish trend. Additionally, the downward trendline appears to be breaking out with increasing volume, which reinforces the breakout confirmation.
From an Elliott Wave Theory perspective, we seem to be in wave 3, which is typically the most impulsive and extended leg of the five-wave cycle.
Given the structure and momentum, a conservative price target lies at the $2.30 level, representing the measured move from the neckline of the H&S formation.
Further upside may follow if wave 3 unfolds as expected, but short-term corrections should also be anticipated.
Risk management remains essential, as macroeconomic factors and fundamental news may cause volatility.
— Thanks for reading.
The Price Is About To Breakdown The Trend Line 📥The Price Reached The Important Support And Everyone Expect a Bounce From Here, But I Have a Different Idea
📉 By The Elliot View Still The Price Have One More Leg Down As a Wave 5 From Main C So My Expectation Is Breakdown The 2$ Support Line toward a 1.66$ As a Next Target
XRPUSDT – ETF Hype or Exit Liquidity Parade?“If BTC sneezes, XRP gets hospitalized.”
🧠 Market Context
Price: $2.07
Resistance Zone: $2.15 – $2.18
Support Zone: $2.00 – $1.88
POC (4H): $2.41 — where leveraged hopes go to die
Volume: Fading across 15m and 4H
Delta: -363K (15m) – strong seller aggression
OI: +578K → rising with price stuck = bait
🔬 Order Flow Breakdown
OI up, price flat → classic smart money unloading on retail
Strong Delta divergence: buyers being absorbed
Heatmap shows stop clusters below $2.00
BTC weakness threatens every bullish setup in altcoins
📰 News Catalysts (Legit, Not Hopium)
ETF Speculation Only. ProShares eyeing XRP futures ETF, but no approval or timeline confirmed.
SEC Case Still Open. Appeal paused. No clarity. Regulatory uncertainty continues to hang over XRP.
Options Data is Bearish. Put/call ratios show downside protection is the market's priority — not upside bets.
📌 Translation: News flow does NOT support a sustainable move higher.
⚔️ Trading Plan
Direction: Short
Entry Zone: $2.15 – $2.18
Target 1: $2.00
Target 2: $1.88
Stop Loss: $2.25
Leverage: 25x – 50x (adjust for sanity)
🔁 Conditions for Execution
XRP fails to break $2.18 on rising OI
BTC stays below $84K or loses momentum
Volume remains low and delta continues negative
⚠️ BTC: The Elephant in the Room
BTC POC at $84.6K
OI decreasing while price stalls
If BTC breaks down, XRP will not survive the shock — it will lead the dump among majors.
TL;DR: “XRP is bait. BTC is the trigger.”
🎭 Final Take from Pôncio
“They’re selling dreams of ETFs while quietly preparing stop hunts.
Order Flow is screaming exit, not moon.
If BTC goes south, XRP follows — fast and ugly.”
📉 Summary Table
Signal - Status
VPVR Resistance - ✅ Confirmed @ $2.15–2.41
OI Behavior - 🚨 Bullish trap
Delta - ❌ Negative and aggressive
Volume - ❌ Weak and fading
Macro News - ❌ No support for pump
BTC Impact - 🧨 High correlation risk
📛 #XRPUSDT #OrderFlow #SmartMoney #CryptoAnalysis #BTCImpact #DeltaDivergence
📉 Trade like the institutions. Or feed them.
Is a 20% Pump to $2.60 Now in Play for Ripple?Hello and greetings to all the crypto enthusiasts, ✌
All previous targets were nailed ✅! Now, let’s dive into a full analysis of the upcoming price potential for Ripple 🔍📈.
Ripple is currently approaching a highly significant trendline, signaling a potential breakout. In addition, the emergence of strong bullish volume suggests growing investor confidence and momentum building toward an upward move. From this level, I anticipate at least a 20% price increase, with the primary target set at $2.60, as the critical $2.50 resistance level appears poised for a breakout in the coming days.📚🙌
🧨 Our team's main opinion is: 🧨
Ripple is gaining momentum near a key trendline with strong buying volume, eyeing a 20% move toward $2.60 as the $2.50 resistance looks ready to break. 📚🎇
Give me some energy !!
✨We invest hours crafting valuable ideas, and your support means everything—feel free to ask questions in the comments! 😊💬
Cheers, Mad Whale. 🐋
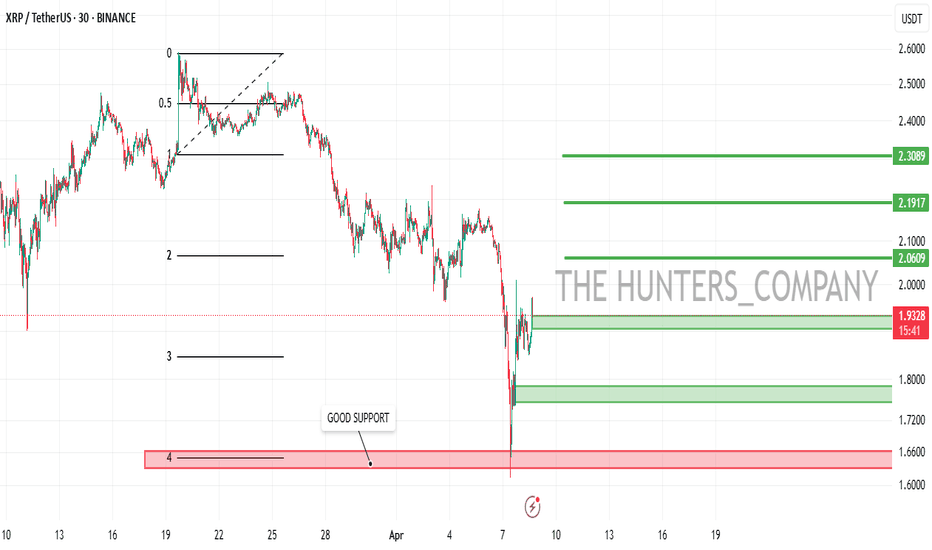
XRP/USDT:BUY LIMITHello friends
Due to the price drop, we have reached a good support area, which you can see is supported by good buyers.
Now we can buy in stages and with capital management in the specified areas and move to the specified targets.
Always buy in fear and sell in greed.
*Trade safely with us*


