$XRP short setup CRYPTOCAP:XRP Short Setup: All Signs Point Down imo, short-term only.
Everything is lining up for XRP to take a hit—trendline resistance, upcoming unlocks, macro headwinds, and fading momentum. Here’s why I’m shorting:
1️⃣ Trendline Resistance + Weak Volume
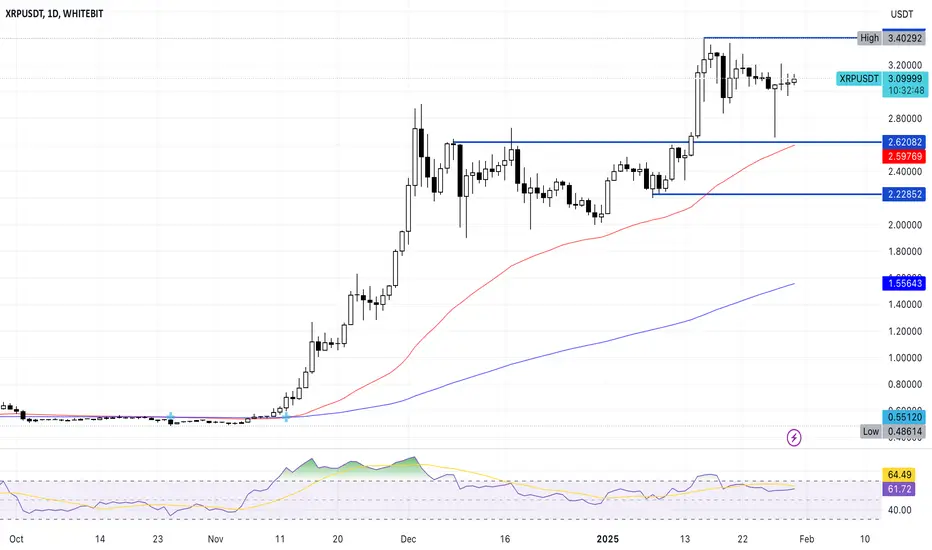
XRP is struggling against major trendline resistance (ranging from the high made 2 weeks ago $3.4), showing clear rejection at the top of its range.
Volume is declining, meaning buyers are running out of steam. A failed breakout with no volume is a recipe for a reversal.
Break or reject? Price action says reject.
2️⃣ XRP Unlocks = Incoming Sell Pressure
On Sat Feb 1 one billion XRP ($3.1B worth) unlocks—a massive supply injection.
Ripple historically sells part of these unlocks, adding downward pressure to the price.
Every past unlock event has led to weakness—why should this time be different? Have a look At the price action from DEC 1 and JAN 1... See any patterns?
More supply + weak demand = lower prices.
3️⃣ Macro Headwinds: Strong DXY, Weak ETH/BTC, CPI Uncertainty
DXY is holding strong, hovering above 108.5—bad news for risk assets. The dollar just doesn't want to crash properly.
Ethereum is struggling at resistance, altcoins are lagging, and Bitcoin is at major resistances of its own. Not to mention eth/btc chart, which looks like freefall on higher timeframes (12h to the Weekly charts).
CPI data this week = uncertainty = shaky price action ahead.
XRP doesn’t move in isolation—macro conditions favour downside, at least short term.
I'm in, and this is always risky business, to short the XRP Army. Not just financially, mainly because if I lose the trade, the XRP soldiers won't let me mourn in peace..
Take Profit Strategy, do not even think about copying👽💙:
Target 1: $2.91 (December high, once there, SL to entry price to play it safe)
Target 2: between $2.64 - $2.67 (Golden Pocket, supported by the 50 day MA)
Target 3: $2.51 (a bit above the main support)
Stop Loss: If XRP closes above $3.40 with strong volume, I’m out. You do you, as the motto goes💙
XRPBULLUSDT trade ideas

XRP/USDT 1H: Bulls Eye $3.35 After Key Liquidity Sweep !XRP/USDT 1H Chart Analysis
🚀 Follow me on TradingView if you respect our charts 📈Daily new charts!
Current Market Structure:
Bullish trend confirmed after a liquidity sweep at 2.65.
Smart Money Activity: Accumulation phase evident with clear order blocks around 3.12.
Risk Score: 7/10 (favorable setup).
Trade Setup:
Entry Zone: 3.17 - 3.18 (current price).
Targets:
T1: 3.25 (premium zone).
T2: 3.35 (previous high).
Stop Loss: Below 3.11 (recent order block).
Key Observations:
RSI: Bullish divergence forming at 57, supporting upside potential.
Premium Zone: Identified at 3.20 - 3.25.
Market Maker Intent: Targeting liquidity above 3.35.
No bearish divergences present, further supporting bullish bias.
Recommendation:
Long positions favorable within the 3.17 - 3.18 range.
Maintain tight stops below 3.11 to limit downside risk.
Watch for volume confirmation to strengthen confidence in the breakout.
Confidence Level: 8/10 for bullish continuation.
🚀 Follow me on TradingView if you respect our charts 📈Daily new charts!

15 looking xrp 15 min looking for a higher high and looks like we could catch the next leg up 3.33 big resistance

Grayscale Files for Spot XRP ETF: A Game-Changer for XRPThe cryptocurrency market is abuzz with the latest news that Grayscale, one of the largest digital asset management firms, has filed for a Spot XRP ETF with the NYSE. This development comes at a pivotal moment for XRP, as the Ripple team appears to be nearing a resolution in its long-standing legal battle with the U.S. Securities and Exchange Commission (SEC). The combination of these factors has sparked renewed interest in XRP, with whales accumulating the asset and technical indicators hinting at a potential bullish breakout. Let’s dive into the fundamental and technical aspects of this story to understand what it means for XRP and the broader crypto market.
Why Grayscale’s Spot XRP ETF Matters
Grayscale’s decision to file for a Spot XRP ETF is a significant endorsement of XRP’s potential. ETFs (Exchange-Traded Funds) are widely regarded as a bridge between traditional finance and the crypto market, offering institutional and retail investors a regulated and accessible way to gain exposure to digital assets. A Spot XRP ETF would allow investors to buy shares that directly reflect the price of XRP, without needing to hold the asset themselves. This could lead to increased liquidity, broader adoption, and a surge in demand for XRP.
The filing also signals growing institutional confidence in XRP, particularly as Ripple’s legal battle with the SEC appears to be nearing a conclusion. A favorable outcome for Ripple could remove a major regulatory overhang, paving the way for XRP to reclaim its position as one of the top cryptocurrencies by market capitalization.
Whale Activity: A Bullish Signal
On-chain data reveals that whale activity for XRP has hit record highs, with the number of wallets holding between 1 million and 10 million XRP reaching an all-time high of 2,083. This accumulation trend suggests that large investors view XRP as undervalued and are positioning themselves for a potential price surge. Historically, such whale activity has often preceded significant bullish rallies, as it indicates strong confidence in the asset’s future prospects.
Technical Analysis
As of the time of writing, XRP is up 1.96%, trading in a moderate zone. The candlestick chart shows a Doji and a Spinning Top, which typically indicate market indecision. However, the Relative Strength Index (RSI) stands at 62, placing CRYPTOCAP:XRP on the cusp of a bullish run. This suggests that despite the current indecision, the asset has the potential to break out if buying momentum increases.
Key support levels to watch include the 38.2% Fibonacci retracement level, which could serve as a strong entry zone for traders. On the upside, breaking past the $3.40 resistance level could ignite a rally toward $4 and beyond, with some analysts even predicting a long-term target of $20.
Market Sentiment
The broader crypto market remains volatile, but the increased interest from whales in both XRP and Cardano (ADA) suggests that these assets could be poised for significant movements in the near term. If XRP can maintain its bullish momentum and hold above key support levels, it could attract even more retail and institutional interest.
What’s Next for XRP?
The combination of Grayscale’s ETF filing, record-high whale activity, and the XRP Ledger’s fundamental strengths creates a compelling case for XRP’s future growth. While the market remains volatile and regulatory uncertainties persist, the potential for a bullish breakout is undeniable.
Investors should keep a close eye on the following factors:
Regulatory Developments: A favorable resolution to Ripple’s legal battle with the SEC could remove a major obstacle and boost confidence in XRP.
ETF Approval: If Grayscale’s Spot XRP ETF is approved, it could open the floodgates for institutional investment.
Technical Indicators: Watch for a break above key resistance levels, such as $3.40, which could signal the start of a sustained rally.
Conclusion
Grayscale’s Spot XRP ETF filing marks a potential turning point for XRP, as it combines strong fundamentals, technical indicators, and growing institutional interest. While the crypto market remains unpredictable, the stars appear to be aligning for XRP to make a significant move. Whether you’re a long-term investor or a short-term trader, now is the time to pay close attention to XRP’s developments. The next few weeks could be pivotal in determining whether XRP reclaims its status as a top-tier cryptocurrency.
Stay tuned to The Bit Journal for the latest updates and insights on XRP and the broader crypto market. The future of CRYPTOCAP:XRP looks brighter than ever—don’t miss out on what could be the next big opportunity in crypto.


XRP Holds Strong Amid Market Correction – Next Stop $3.50?Despite broader market corrections, XRP remains resilient, gaining over 1% in the past 24 hours and surging 55.15% in the last 30 days. With a YTD return of +34.51%, XRP currently holds the title of the best-performing altcoin among the top 25 projects.
Technical indicators continue to favor bullish momentum. The 50/200-day EMA shows growing buying pressure, while the RSI hovers near overbought levels, signaling sustained demand. If XRP maintains its position above $3, it could build momentum toward its next resistance at $3.50.
However, if bearish pressure increases, XRP may retest its support at $2.75 before another attempt at an upward move. For now, all eyes are on whether XRP can break through key resistance or face short-term consolidation.
With strong technical support and continued investor confidence, XRP could be gearing up for another bullish push. Will it hold above $3 and make a run for $3.50?
Why Market Cap is Misleading for XRP🔥 Why Market Cap is Misleading for XRP 🔥
Many dismiss XRP’s potential because they believe a high price would make its market cap “too big”—but that’s a fundamental misunderstanding! ❌ Unlike stocks or Bitcoin (which act as stores of value), XRP is a utility asset designed for global payments. Let’s break it down:
1️⃣ Market Cap Doesn’t Apply to Transactional Assets
📊 Stocks & Bitcoin are held in portfolios, so market cap is a useful metric.
🌍 XRP is built for real-time transactions—it moves money, not just stores it!
🔹 Comparing XRP’s market cap to Bitcoin’s is like comparing Forex trading volume to a country’s GDP—they measure completely different things!
2️⃣ XRP Should Be Measured by Global Transactions
💰 Forex trades over $2,700T annually—that’s 27× the global GDP!
💳 Cross-border payments exceed $150T per year—XRP’s primary use case.
⚡ Unlike stocks, XRP can be used multiple times a day, increasing its efficiency and demand.
3️⃣ XRP Supply Shrinks Over Time 🔥
⏳ Every XRP transaction burns a small amount of XRP, reducing supply over time.
📈 As demand increases and supply decreases, price pressure naturally rises.
✅ The Takeaway
🚀 Stop using stock market logic to evaluate XRP—it doesn’t fit!
🔑 XRP’s real value comes from global adoption, speed, and efficiency, not from its market cap.
💡 The real question: How much global money will XRP move? That’s what determines its price potential! 🌎💰

XRP 45 min chart looks promising for a break out The 45-minute chart for XRP presents a potentially bullish outlook, with a forming flag pattern hinting at a continuation of the upward trend. Furthermore, the 50-200 moving average golden cross reinforces this optimistic view.
Key levels to monitor:
Resistance: 3.21
Breakout above this level could confirm the bullish flag pattern and propel XRP upward.
The golden cross, coupled with the flag pattern, suggests a potential buying opportunity. A successful breach of the 3.21 resistance level could trigger a rally, making this a critical level to watch

XRP USD Coin 24hr potterbox with wedgeXRP USD 24hr potterbox with a wedge play I created with the blue lines. . XRP is going green as this unfolds. hopefully it will continue this uptrend.


XRP USDT💰 CRYPTOCAP:XRP
Imo, this is the perfect dip on #XRP 💁♂️
✅ Compression (falling wedge) is completed
✅ $2.7 Major Support has held strong
Time to reverse the short-term trend! Send CRYPTOCAP:XRP to $4, $4.5, $5 📈🚀

Xrp Considering the chart situation, the three specified ranges are suitable for entering a short trade with candlestick confirmation.

XRP: Bullish Continuation is Imminent! Keep an Eye on XRP
Now is the time to watch XRP. If the price breaks to the upside, we could see a significant move that might take it above $3.4.
Trading Setup
If you’re considering trading XRP, here’s a quick setup that may help you.
The idea is: Buy when the price breaks above $3.21 and take profits at the levels shown in the chart.
Targets:
1. $3.23
2. $3.29
3. $3.33
4. $3.4
-------------------------------------------
About our trades:
Our success rate is notably high, with 10 out of 11 posted trade setups achieving at least their first target upon a breakout price breach (The most on TW!). Our TradingView page serves as a testament to this claim, and we invite you to verify it!

XRP/USDTThe coin has a globally bullish structure, with local consolidation. After the ATH update, there was no significant pullback. Spot or long from the highlighted zone under suitable conditions
target 1 = 3.21
target 2 = 3.40

CLEAN XRP📊 XRP is shaping up nicely with a clean structure, hinting at the formation of another 1-2 wave setup. If this pattern holds, we could be gearing up for a strong impulse move ahead. Watching key support levels for confirmation. 🚀

Updated XRP/USDT 1H Chart Analysis – Next 24 Hours OutlookKey Observations:
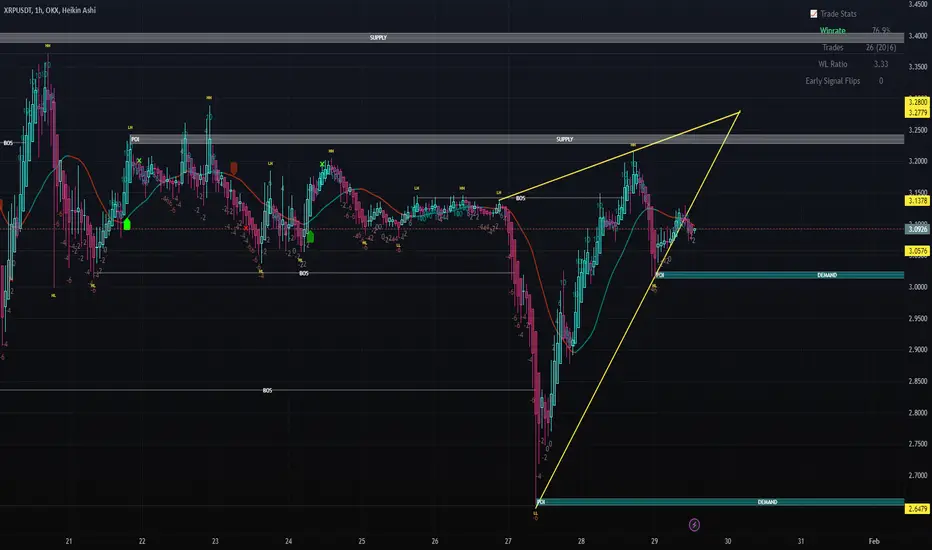
Rising Wedge Breakdown Risk (Bearish Bias)
XRP is still within a rising wedge, a bearish pattern that often leads to a breakdown.
Price is testing the lower trendline, indicating a crucial decision point.
Supply & Demand Zones:
Supply Zone (Resistance): 3.28 - 3.13 (Price struggled to break above)
Demand Zone (Support): 3.03 - 2.88 (Price approaching this area)
Lower Demand: 2.65, a strong historical level.
Support & Resistance Levels:
Immediate Resistance: 3.09 - 3.13
Immediate Support: 3.03 - 3.05
Next Major Support: 2.88, aligning with demand.
Break of Structure (BOS) & Price Action:
There is a break of structure (BOS) to the downside, indicating potential trend reversal.
If the wedge breaks down, XRP may move lower.
Potential Next Move (24H Forecast)
Bearish Scenario (Higher Probability, ~70%)
A break below 3.03 could send XRP to 2.88
If bearish momentum continues, 2.65 (lower demand zone) becomes a possible target.
Bullish Scenario (Lower Probability, ~30%)
If XRP holds 3.03, a bounce back to 3.09 - 3.13 is possible.
A break above 3.13 could push toward the 3.28 supply zone.
Final Conclusion:
Bearish Bias – XRP is more likely to break down and test 2.88 soon. If buyers don’t step in, 2.65 is the next key level.
XRP🚀 XRP (Ripple) – A Game-Changer in Cross-Border Payments! 🚀
XRP is the native token of the Ripple network, designed for fast, low-cost international transactions. With institutional adoption growing, it’s a key player in the future of digital finance.
📌 Current Setup:
🔹 Buy Zone: $2.50 – $2.60
🎯 Target: $4.00
Are you bullish on XRP? Let’s discuss in the comments! 📊💬
#XRP #Ripple #Crypto #Blockchain #CryptoTrading #Altcoins #XRPArmy #TradingView
🚀 XRP Ready for Takeoff! 🚀
Ripple is in a strong buy zone between $2.50 – $2.60, targeting $4.00! 📈🔥
Will you ride the wave or watch from the sidelines? 🌊💰
#XRP #Crypto #Ripple #Bullish #CryptoTrading #Altcoins

XRPUSDT short term: BearishCurrently, there is a concern of bearish divergence forming in the XRP chart. It is likely to breach previous resistance at $3.4 to form a bull trap before dropping towards lower $2.0

XRP → Resistance retest before correction BINANCE:XRPUSDT over yesterday evening bought back the previously formed fall, but faced strong resistance, which delimits the descending channel. A correction could possibly form...
After a strong rise (on D1) XRP is going into a correction, the remarkable thing is that the correction is within a descending channel, or flag, the essence of which is the continuation of the trend. Let me remind you that the global trend is bullish.
Technically, on the local , a false resistance breakout and correction may be formed, for example, to 3K or 0.5 fibo before the market starts to form the potential for a breakout of the channel resistance in order to continue the growth.
Support levels: 3000, 0.5 fibo (2.900)
Resistance levels: 3.144, 3.2
The liquidity formed in the zone 3.14 - 3.2 may not let the coin up the first time. In the short term, I expect a false breakout and correction to the targets indicated on the chart.
Regards R. Linda!

XRP USD 24hr potterbox and a wedge XRP is forming up a nice get ready to blast off wedge. it's well above the 200-day moving average. I'm not sure i drew the box and wedge correctly . I have seen this pattern and most of the time its bullish. I could be wrong, and we will see. Happy Trading.

XRP 4HR Big Pennant breakout attempt XRP 4HR Big Pennant breakout attempt. XRP is attempting to break out of its big bullish pennant pattern. Im taking a small position on a close above the trendline then waiting for a re-test. Measured target is $4.20

XRP - Waiting on E Wave CompletionUpdated playout chart on XRP escaping contracting triangle. Should not revisit $2.65 C Wave low

big hammer pattern The hammer candle is at the bottom of the channel with this size and also in green
And its confirmation with the candle after it
Indicates that it is moving strongly upwards
And I don't think there is much correction coming and it is only moving upwards
Also, the news of the dismissal of the lawsuit against Ripple has just come out, which I think could be another reason for Ripple's flight
So fasten your seatbelts because we are going up very fast
