XRPUSDT 4Han idea for XRPUSDT. 4H on 13/01/2025
can this pair hit 2.6689
please discuss about this thing, comment on below
XRPBULLUSDT trade ideas

XRP: Poised at the Edge of Momentum – What's Next?The cryptocurrency market never sleeps, and XRP is the perfect reflection of this restless spirit. Currently trading at $2.8295, XRP finds itself teetering on the brink of a crucial breakout, with just a 2.9% gap from its all-time high of $2.9138, achieved 43 days ago. The question on every trader's mind: is this the moment of ignition, or will the asset take a breather?
Recent patterns highlight a tug-of-war between buyers and sellers. Volume Spread Analysis (VSA) patterns reveal the persistence of increased buy volumes, though intermittent sell-offs indicate a battle for control. From a technical perspective, the Relative Strength Index (RSI) stands at 74.95, signaling that XRP is flirting with overbought territory. Yet, this could either confirm a surge or warn of an impending pullback.
Fundamentally, Ripple’s ongoing legal clarity and the adoption of RLUSD stablecoin are boosting market confidence. Combined with the upward trend supported by key moving averages—MA50 at $2.5597 and MA100 at $2.5201—XRP could be primed for its next big leap.
Your Move: XRP's future is a coin flip between testing its psychological barriers at $3.00 and retracing to stronger support at $2.66. Are you ready to seize the opportunity as XRP prepares to define its next chapter? Stay tuned, as the market reveals its hand.
XRP Tradingmap: Patterns in Motion
Step 1: The Build-Up Begins - Buy Volumes Max (01:00 UTC)
The sequence kicks off with the "Buy Volumes Max" pattern. At this point, the price opened at $2.6765 and closed higher at $2.7918, signaling strong buying momentum. The main_direction was bullish, validated by the immediate follow-up pattern. This set the stage for the next price action.
Step 2: Rally Confirmed - Increased Buy Volumes (02:00 UTC)
True to the bullish call of the previous pattern, the price climbed further, opening at $2.7918 and closing higher at $2.8474. This confirms the integrity of the earlier pattern and keeps the bullish sentiment alive. Trigger points were respected as prices didn’t dip below the lows of the previous three bars ($2.6383). Confidence grows as buyers continue to dominate.
Step 3: Profit-Taking Warning - VSA Manipulation Sell Pattern (03:00 UTC)
Here comes a shift. The market signals caution with a "VSA Manipulation Sell Pattern." Despite opening high at $2.8474, the price closed lower at $2.8304. The main_direction flipped bearish, and this was confirmed as the subsequent pattern saw a slight price drop. Traders who spotted this sell signal had a chance to lock in gains before the retracement deepened.
Step 4: Brief Reprieve - Increased Buy Volumes (17:00 UTC)
Bulls briefly regained control, as prices opened at $2.6146 and closed higher at $2.6553. However, the movement lacked the strength seen in earlier buy patterns. While the main_direction of this pattern was bullish, subsequent price action indicates that this bounce was fleeting—a classic bull trap for unprepared traders.
Step 5: The Market Takes a Turn - VSA Manipulation Sell Pattern (19:00 UTC)
The sell-off resumes with another VSA sell pattern. The price slid lower, respecting the bearish direction outlined earlier. Opening at $2.682 and closing at $2.6626, this pattern further solidified bearish control. Trigger points were cleanly activated as prices failed to regain previous highs, providing traders with an opportunity to ride the downtrend.
Step 6: Strategy Reset - The Bigger Picture Emerges
The sequence highlighted above demonstrates the power of reading patterns within a cohesive framework. Early buy signals paved the way for strong upward momentum, but the subsequent sell patterns hinted at deeper corrections. By following the roadmap, investors could have avoided traps and maximized profits during the transition from bullish to bearish phases.
What’s Next?
XRP’s roadmap reveals its inherent volatility. Each pattern offers insight into market behavior, but success comes from aligning these signals with a broader strategy. Stay tuned for the next move—will bulls or bears take the crown?
Technical & Price Action Analysis: Key Levels to Watch
Support Levels:
$2.6666 – First line of defense. If this level doesn’t hold, it’s likely to flip into resistance, attracting sellers like bees to honey.
$2.5783 – A deeper support level where buyers might regroup. If broken, expect it to act as a ceiling for any bounces.
$2.2748 – Critical zone for bulls to keep control. If this level is lost, momentum shifts decisively in favor of the bears.
$2.1349 – The market’s last-ditch effort to keep things afloat. Failure here could open the floodgates.
$1.9667 – A psychological barrier where value hunters might step in. But remember, if it cracks, it’s a wall on the way up.
Resistance Levels:
While the chart doesn’t scream significant resistance levels, any failed support will naturally transform into tough barriers for a comeback rally.
Powerful Resistance Levels:
$1.1047 – A long-term level where sellers are likely to dig in their heels. Watch for strong rejections here.
$0.5538 – Key zone for the long game. If this level is reached and rejected, the bears could strengthen their grip.
$0.5032 – An area that will attract big players if prices retrace this far. Keep an eye on the price action here.
$0.3646 – The fortress of resistance. If bulls manage to breach this, it’s a signal of a major shift in market sentiment.
Trading Strategies Using Rays: A Path Through the Fibonacci Framework
Concept of Rays
The "Rays from the Beginning of Movement" approach is a unique method that applies Fibonacci-based geometric principles to map the dynamics of price movement. These rays act as predictive tools, marking zones where significant price interactions occur—either signaling a continuation or a reversal. By focusing on interactions with these rays, traders can better gauge probabilities without attempting to pinpoint exact levels in a nonlinear financial system.
How Rays Work
Fibonacci Rays: Constructed at mathematically significant angles starting from the initial movement, not extremum points. This increases accuracy in trending or corrective phases.
Dynamic Levels: These rays adapt to new patterns, automatically updating ranges for potential price movements.
Moving Averages as Dynamic Factors: Key levels align with Moving Averages (MA50, MA100, MA200), providing strong zones of interaction.
Ascending and Descending Rays: These define movement boundaries, marking pathways for price to travel from one ray to another.
Optimistic Scenario
Entry Point: Interaction with a descending ray around $2.6666 (support). If the price bounces above this ray and confirms with a close above MA50 at $2.5597, the movement could head upward.
Target 1: $2.8295 – Interaction with the next ray above creates an opportunity to scale out partial profits.
Target 2: $2.9138 – Absolute high from recent history; a breakout here could extend gains toward higher Fibonacci levels.
Dynamic Factors: If RSI remains above 70 while interacting with ascending rays, the bullish scenario strengthens.
Pessimistic Scenario
Entry Point: Price interaction with an ascending ray near $2.6666, but fails to close above MA50, confirming bearish sentiment.
Target 1: $2.5783 – Initial support zone becomes the first profit target in the downtrend.
Target 2: $2.2748 – Second ray below and the next potential reaction level for a partial exit.
Target 3: $2.1349 – A critical area where price may consolidate or reverse.
Dynamic Factors: Watch for Moving Averages flipping into resistance zones, confirming further downward pressure.
Trade Ideas Using Rays
Long Trade from $2.6666 to $2.8295: Enter long when price interacts with the ray at $2.6666, confirming with a bullish close above MA50. Scale out at $2.8295, targeting the upper ray.
Short Trade from $2.6666 to $2.5783: Enter short if price interacts with $2.6666 but fails to break above MA50. Target $2.5783 for a clean exit at the next ray.
Breakout Trade above $2.9138: Go long if price cleanly breaks $2.9138, with a tight stop below the breakout candle. Use dynamic Fibonacci rays to set extended targets.
Reversal Trade at $2.1349: A bounce off the $2.1349 ray could signal a countertrend move. Enter with confirmation from price closing above MA200, targeting $2.2748.
Trading is all about finding those key levels where the magic happens, and now it's your chance to engage. Have questions about the analysis? Drop them right in the comments—I’m here to discuss, clarify, and brainstorm with you!
Found this idea helpful? Don’t forget to hit Boost and save it for later so you can track how price moves along the rays. Observing these levels in real-time will not only sharpen your skills but also deepen your understanding of how market dynamics work.
Curious about my indicator? The strategy you see here, drawing all the rays and levels automatically, is part of a private setup. If you’re interested in using it, feel free to reach out to me via direct message—I’ll explain how we can make that happen.
Need a custom analysis for your favorite asset? Whether you want it shared publicly or kept private for your eyes only, I’m open to discussing options. Just let me know in the comments or via DM, and I’ll do my best to help.
Remember, these rays work across all assets, and the price often respects them like clockwork. If you want me to mark up specific assets for you, write in the comments and don’t forget to hit Boost. I’ll tackle requests as time permits.
Finally, make sure to follow me here on TradingView for more in-depth ideas and strategies. This is where I share all my updates, and I’d love to have you as part of my trading community.
Let’s trade smarter together! 🚀

XRP/USD LONG TRADETitle: XRP/USD RIPPLE
Asset: Crypto
Symbol: BTC/USD
Order Type: Buy
Time Frame: 1D
Platform: Coinbase or MT4
Entry Price 1: $2.05
Entry Price 2: $1.85
Stop Loss: $1.70
Take Profit 1: $2.35
Take Profit 2: $2.75
Take Profit 3: $3.05
Take Profit 4: $3.35
Status: ACTIVE

XRP TriangleXRP remains at the center of attention in the cryptocurrency community and continues to show strength💪 compared to other altcoins. The test of the $2.2 level ended in favor of the bulls, and along with the narrowing range forming a triangle, it creates a solid foundation for growth.

XRPUSDT Remains Intact. Or I should Say: Super StrongHigher lows since the 10th of December.
The last session produced a clear reversal signal in the form of DragonFly Doji.
This candlestick based signal is confirmed by the current session turning full green.
Additional bullish support comes from the fact that the recent drop was minimal and accompanied by no volume. Little bearish pressure.
I told you that XRP traders are very smart and they are not likely to sell knowing what is coming to this market. Knowing the massive potential they are likely to hold all the way up. And this is shown by the price action on this chart.
Bitcoin was shaken. The market as well as some whales were taking profits. This produced very little negative effect on XRPUSDT. Since XRP moved first and remains strong and ready to continue growing, we know the market will do the same.
This is just one more confirmation; we are bullish now, the market is bullish now, XRP is ready to grow. Look for higher and higher prices for months to come.
Thank you for reading and for your continued support.
You can choose to follow if you want to see, hear and feel more.
Namaste.

XRP: A new high is coming!Keep an Eye on XRP
Now is the time to watch XRP. If the price breaks to the upside, we could see a significant move that might take it above $3.
Trading Setup
If you’re considering trading XRP, here’s a quick setup that may help you.
The idea is: Buy when the price breaks above $2.51 and take profits at the levels shown in the chart.
Targets:
1. $2.6
2. $2.68
3. $2.8
-------------------------------------------
About our trades:
Our success rate is notably high, with 10 out of 11 posted trade setups achieving at least their first target upon a breakout price breach (The most on TW!). Our TradingView page serves as a testament to this claim, and we invite you to verify it!

SHORT XRPI believe ripple is overbought. The SEC will appeal, also during Trump's inauguration the markets will start taking profits.

#XRP is forming a symmetrical triangle pattern! #XRP is forming a symmetrical triangle pattern!
We expect a strong bounce once it breaks out. 🚀
Keep an eye on this setup—it could be a great opportunity!
DYOR, NFA
#Crypto #BullRun2025 #Altseason

i just short on XRP due to my personal trending line strategyAfter XRP failed to break its $2.6 trendline and broke its trendlines , It have to down to 2.4 for next target . Please note that this is just my personal experience and should not be used as a guide for you to trade based on a personal theory.

XRP ON ELLIOTE WAVESRipple is completing its micro wave 4 in the form of an ABC triangle and is ready to reach the $5-$6 target after breaking the ceiling.
A trigger will be issued if the major ceiling is broken.
If you liked this analysis, share it with your friends and follow us.

XRP to $4? Examining the Bullish Case and Key Resistance Levels
The information provided in this article is for informational purposes only and does not constitute investment advice. Please do your own research before making any investment decisions.
XRP, the cryptocurrency associated with Ripple Labs, has been a subject of much discussion and speculation in the crypto community. Its price movements have been closely watched by investors, especially in light of the ongoing legal battle between Ripple and the U.S. Securities and Exchange Commission (SEC).
Recent Price Action and Market Sentiment
Recently, XRP has shown signs of bullish momentum, leading to questions about its potential to break through key resistance levels. Several factors have contributed to this positive sentiment:
• Legal Developments: The ongoing legal battle with the SEC has been a major overhang on XRP's price. However, recent positive developments in the case have instilled confidence in investors.
• Technical Analysis: From a technical analysis perspective, XRP has shown promising signs. It recently broke out of a symmetrical triangle pattern, which is often considered a bullish continuation indicator.
• Market Sentiment: The overall market sentiment towards XRP has improved, with many analysts predicting a potential price surge.
Technical Analysis and Price Targets
Technical analysts use various tools and patterns to predict future price movements. In the case of XRP, the breakout from the symmetrical triangle pattern suggests a potential price target of $4, representing a 60% increase from its current levels. This projection is calculated by adding the maximum height of the triangle to the breakout point.
However, it's important to consider critical support and resistance levels. The upper trendline of the triangle, now acting as support, is near $2.37. A failure to sustain above this level could invalidate the bullish pattern, potentially leading to a pullback toward $2.30, which aligns with the 50-period exponential moving average (EMA).
Factors Influencing XRP's Price
Several factors could influence XRP's price in the near future:
• Resolution of the SEC Case: A favorable outcome in the SEC case could significantly boost XRP's price.
• Adoption and Partnerships: Increased adoption of XRP by financial institutions and new partnerships could drive demand and price appreciation.
• Market Trends: Overall market trends in the cryptocurrency market can also impact XRP's price.
Price Prediction
Considering the recent developments, technical analysis, and market sentiment, XRP has the potential to reach the $4 price target. However, this is not guaranteed, and the price could face resistance at various levels.
It's crucial to remember that the cryptocurrency market is highly volatile, and prices can fluctuate significantly in short periods. Therefore, it's essential to exercise caution and conduct thorough research before making any investment decisions.
Disclaimer:
The information provided in this article is for informational purposes only and does not constitute investment advice. Please do your own research before making any investment decisions.


XRP is getting ready to conquer the peaks again!Ripple's CEO has met with a number of US officials, as well as Donald Trump! In addition, XRP is already being used by Bank of America and other large companies. The upcoming IPO will attract a lot of investors! I believe that the IPO will be the final factor and after that the fall will start. My first exit point is $4.4, the second is $5!
Kostenich Alex, Horban Brothers.

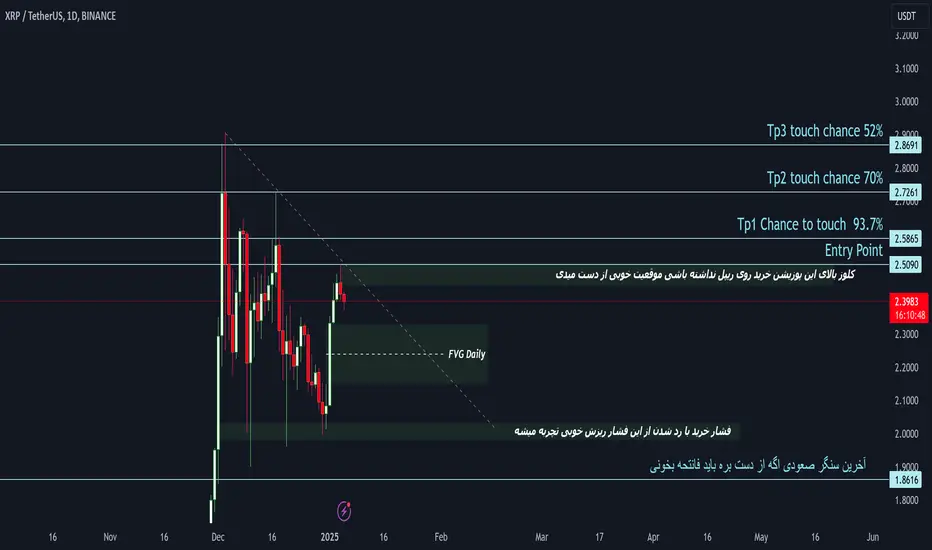
Ripple-XRPUSD Periodic Analysis (Issue 61)The analyst believes that the price of Ripple will increase in the next 24 Days. This prediction is based on quantitative analysis of the price trend..
Please note that the specified take-profit level does not imply a prediction that the price will reach that point. In this framework of analysis and trading, unlike the stop-loss, which is mandatory, setting a take-profit level is optional. Whether the price reaches the take-profit level or not is of no significance, as the results are calculated based on the start and end times. The take-profit level merely indicates the potential maximum price fluctuation within that time frame.

XRP currency analysisAccording to the daily chart, the flag pattern is formed, which can grow up to the specified level according to the open conditions and the break of the line. This is just an analysis.

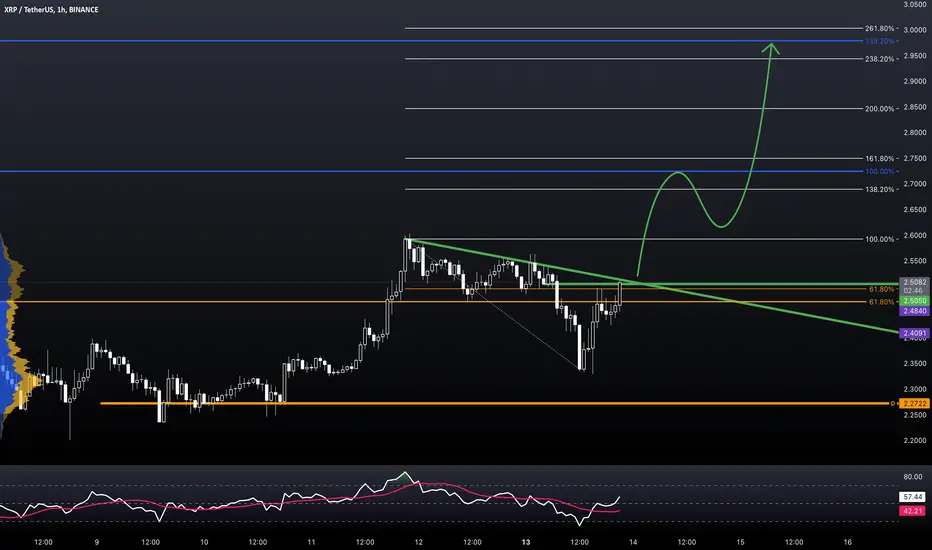
XRP/USDT 4H Timeframe AnalysisXRP/USDT 4H Timeframe Analysis
Trend Analysis
On the 4-hour timeframe, XRP/USDT is in an uptrend, forming a symmetrical triangle pattern. A downtrend line with three confirmed touches served as solid resistance, eventually breaking out and forming the symmetrical pattern.
Recently, the price broke above the minor key resistance at 2.4800, signaling bullish momentum. After accumulating buyers’ orders, the price briefly dipped to hunt liquidity below the minor resistance, where buyers had placed stop-losses.
Following the liquidity hunt, the price rebounded strongly, breaking above the minor resistance again. The current price action suggests potential bullish continuation, especially as the market reacts to news impacting XRP’s legal developments.
Price Action Expectation:
Our objective is to wait for a retest of the minor resistance (now turned support) at 2.5040.
Wait for the price to consolidate around this level, confirming strong buyer interest.
Monitor for a bullish reaction at the retest point, which validates the continuation of the uptrend.
After the retest, expect the price to rally toward the next significant resistance level.
Trade Setup-
Trade Type: Buy Limit (Retest Entry)
Entry: 2.5040 (upon confirmation of the retest)
Stop Loss: 2.3350 (below the liquidity zone to avoid false breakouts)
Take Profit: 2.9070 (next significant resistance level)
This setup requires patience and discipline to ensure all conditions are met before entering the trade.
News Catalyst
The recent increase in buying pressure for XRP is attributed to a notable update regarding Ripple's legal battle with the SEC. A prominent lawyer's insights on the SEC’s appeal have boosted market sentiment, reinforcing confidence in Ripple's position. This news has supported XRP’s bullish momentum and aligns with the current technical outlook.
Conclusion:
XRP/USDT shows strong bullish potential supported by a clear breakout pattern and positive news sentiment. The strategy emphasizes disciplined execution and proper validation of the retest to confirm the setup.
Risk Management:
Maintain a 1:2+ risk-to-reward ratio to optimize trade outcomes.
Position size should align with your account equity to manage risk effectively.
Monitor liquidity zones closely to avoid premature stop-outs.
Trading involves significant risks and is not suitable for all investors. Always:
Seek advice from a financial professional if unsure about trading decisions.

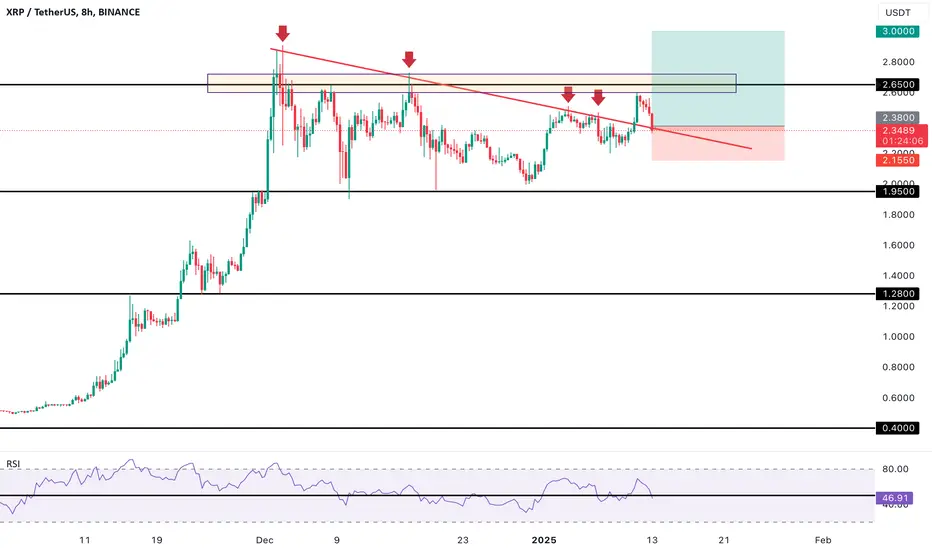
Ripple - XRP trade ideas Would love to trade the fake out of the triangle from either side
Short - region of resistance 2.53 - 2.60$
Long - region of support 2.13 - 2.00$

RIPPLE // countertrend breakThe market is at the countertrend break, daily fibo levels are the targets.
KEEP IT SIMPLE!
———
Orange lines represent impulse bases on major timeframes, signaling the direction and validity of the prevailing trend by acting as key levels where significant momentum originated.
Level colors:
Daily - blue
Weekly - purple
Monthly - magenta
H4 - aqua
Long trigger - green
Short trigger - red
———
Stay grounded, stay present. 🏄🏼♂️
<<please boost 🚀 if you enjoy💚
Strong XRP breakoutLoads of momentum, XRP ETF hype, Brad Garlinghouse + Trump photo
Could be a good one to trail up

Short term TA for XRP XRP is currently consolidating within a narrow range between 2.37 and 2.38, following a recent upward move. While a decisive breakout above the 2.40 resistance level remains pending, this consolidation period could be interpreted as a sign of strength.
In the near term, a cautious outlook is warranted as the price has yet to confirm a sustained upward trajectory. However, the current price action may be indicative of accumulation and base-building, potentially setting the stage for a future advance.
Longer-term prospects for XRP appear positive, with the cryptocurrency demonstrating a consistent pattern of higher highs and higher lows. This suggests an underlying bullish trend, although patience may be required for further upside momentum to materialize.
Traders and investors are advised to closely monitor key indicators such as trading volume and momentum, as well as news and developments related to XRP, to gauge the likelihood of a breakout and subsequent price appreciation.

XRp is Still on #MiracleHEllo there
I will enter to Long postions by the time price passed last high and there are some other reasons for this suggestion
one of them candle stick pattern in daily time frame that could be broken to go reverse ( Reversal pinbar )
#TradeWithMky
I suggest a long postions after Green Area
stop Lost blow last low
Good luck
XRP IdeaXRP has formed a valid descending trendline and broke the last touch of the trendline
Now its retesting it so we’re entering a buy position
GOOD Luck family
Follow us for more idea and analysis
This is worrying, is the rising wedge playing out?I previously pointed out a rising wedge in an idea of mine, it appears it could be forming. This really isn't good news. Targets are labelled on graph.
BINANCE:BTCUSDT is also dragging the price down which makes pattern validation more likely. BTC has also broke below the neckline on the H&S (high time frames) and Double Top (low time frames). This is very concerning, how will WS market react. There is a lot of fundamentals coming out this week, this could get very bloody.
People saying this is a re-test of our so called 'symmetrical' triangle. I'm still not sure.
I have been scalping the patterns so either way not too bothered about price action right now but this is genuinely concerning for the future of XRP.
